

Abstract
BACKGROUND AND PURPOSE
The lack of safe and effective treatments for obesity has increased interest in natural products that may serve as alternative therapies. From this perspective, we have analysed the effects of daidzein, one of the main soy isoflavones, on diet-induced obesity in rats.
EXPERIMENTAL APPROACH
Rats made obese after exposure to a very (60%) high fat-content diet were treated with daidzein (50 mg·kg−1) for 14 days. The dose was selected on the basis of the acute effects of this isoflavone on a feeding test. After 14 days, animals were killed and plasma, white and brown adipose tissue, muscle and liver studied for the levels and expression of metabolites, proteins and genes relevant to lipid metabolism.
KEY RESULTS
A single treatment (acute) with daidzein dose-dependently reduced food intake. Chronic treatment (daily for 14 days) reduced weight gain and fat content in liver, accompanied by high leptin and low adiponectin levels in plasma. While skeletal muscle was weakly affected by treatment, both adipose tissue and liver displayed marked changes after treatment with daidzein, affecting transcription factors and lipogenic enzymes, particularly stearoyl coenzyme A desaturase 1, a pivotal enzyme in obesity. Expression of uncoupling protein 1, an important enzyme for thermogenesis, was increased in brown adipose tissue after daidzein treatment.
CONCLUSIONS AND IMPLICATIONS
These results support the use of isoflavones in diet-induced obesity, especially when hepatic steatosis is present and open a new field of use for these natural products.
Keywords: daidzein, diet-induced obesity, oxidative metabolism, SCD1, UCP1, PPAR, cannabinoid receptor, skeletal muscle, liver, adipose tissue
Introduction
Epidemiologically, the prevalence of obesity and related diseases in Asian populations is lower than in Western countries. Such observations encouraged analysis of Asian diets, which typically include soy products rich in phytoestrogens (Severson et al., 1989; Tham et al., 1998). Recent research has been focused on the beneficial effects of dietary phyto-oestrogens, including the oestradiol (E2)-like soy isoflavones genistein, daidzein and glycitein, on obesity and diabetes (Kuiper et al., 1998; Bhathena and Velasquez, 2002). Data obtained from clinical, epidemiological and nutritional studies in animals and humans show that the improved metabolic consequences associated with ingestion of soy products include better glucose control, less insulin resistance and improved plasma lipid profile (reducing serum total cholesterol, low-density lipoprotein (LDL)-cholesterol and triglycerides) (Zhuo et al., 2004; Zhan and Ho, 2005; Taku et al., 2007), as well as reduction of weight gain in rats (Davis et al., 2007). Such changes are protective in disorders like hyperlipidaemia, cardiovascular disease, menopausal symptoms, atherosclerosis, osteoporosis, cancer and various forms of chronic renal disease (Kopelman, 2000; Clarkson, 2002; Messina et al., 2002; Clair and Anthony, 2005; Cassidy and Hooper, 2006; Zhang et al., 2010), all of which are associated with obesity and diabetes.
Currently, a variety of mechanisms have been proposed through which isoflavones may exert their beneficial effects. Firstly, because of their structural similarities to endogenous oestrogens, genistein and daidzein can act as weak oestrogens after binding to and activating the oestrogen receptors, ER-α and ER-β (Kuiper et al., 1998), mimicking the effects of low levels of the endogenous agonist (Zhu et al., 2006). Oestradiol, among other functions, is a major regulator of adipocyte development and number and these cells are very important in lipid homeostasis and the maintenance of the whole body energy balance (Cooke and Naaz, 2004; Rosen, 2005). Oestradiol is also a well-known modulator of glucose homeostasis (Godsland, 2005) and it has also been suggested to protect beta-cell biology, modulating insulin sensitivity and biosynthesis (Le May et al., 2006; Liu and Mauvais-Jarvis, 2010). Furthermore, ERs are expressed in many tissues, including adipose tissue and muscle, in a variable distribution pattern which explains their tissue-selective effects (Barros et al., 2006). Secondly, soy isoflavones also produce non-oestrogen effects as genistein and daidzein bind to and activate two peroxisome proliferator-activated receptors, PPARα and PPARγ, increasing β-oxidation, insulin sensation and improving serum triglyceride levels (Mezei et al., 2003; Shen et al., 2006; Ronis et al., 2009). Both PPARs have different but overlapping, tissue distribution and functions, associated with lipid and glucose metabolism (Mezei et al., 2006). Therefore, isoflavones may also act through pathways regulated by PPAR-regulated genes, and/or by other transcription factors such as the sterol regulatory element binding protein (Mullen et al., 2004; Ronis et al., 2009). This transcription factor (sterol regulatory element binding protein) is extensively involved in glucose utilization and fatty acid synthesis and metabolism in the liver, through the control of specific genes (Shin et al., 2007). Additionally, phytoestrogens are known to have potent antioxidative activity and counteract the damaging effects of free radicals in tissues (Vedavanam et al., 1999).
Apart from being structurally similar to oestradiol, daidzein also resembles the natural cannabinoids (see Figure S1), the lipid compounds present in Cannabis sativa. The structural relationships between daidzein and plant cannabinoids may facilitate a possible cannabinoid-like effect of isoflavones yet to be described. Cannabinoids act through cannabinoid receptors, which are part of the endogenous signalling system, called the endocannabinoid system. This system is critically involved in the onset of obesity and the metabolic syndrome, mainly due to its effects on appetite control and energy homeostasis. Basically, the endocannabinoid system is a network of fatty acid-derived signalling molecules including the endocannabinoid ligands, anandamide, oleylethanolamide and 2-arachidonoyl glycerol, all of which exert their effect by binding mainly to the cannabinoid CB1 receptors and also to CB2 receptors (receptor nomenclature follows Alexander et al., 2009). These endocannabinoids also bind to and activate PPARα and PPARγ (Piomelli, 2003). Furthermore, this molecular interaction is highly affected by the nature of dietary fat (Bathena, 2000; Evans et al., 2004). The major metabolic organs are also the main site of action for PPARs and a variety of other hormones that could contribute to the reduction in hepatic steatosis and insulin sensitization seen after soy feeding (Cederroth and Nef, 2009).
To date, there are few studies of the effects of isoflavones on diet-induced obesity and especially of the effects caused in the main metabolic organs. To answer the questions raised, we have studied the changes caused by both diet and treatment with the isoflavone daidzein on lipid and glucose metabolism, in the three major metabolic organs: liver, adipose tissue and skeletal muscle, in order to understand the mechanism of action of isoflavones in improving metabolic parameters. Consequently, in this work, we have assessed the effect of daidzein treatment on food intake and body weight reduction in male Wistar rats and investigated the effect of a very high-fat diet (HFD) on genes relevant to lipid and glucose metabolism and related proteins, in liver, white and brown adipose tissues and skeletal muscle. We have also analysed the changes caused by treatment with daidzein on the levels of expression of these genes and proteins in rats being fed a standard/low-fat diet (STD, 10% fat) and an HFD (60% fat). Finally, we have compared the metabolic changes following the combination of the HFD and daidzein.
Because of the lack of information on cannabinoid-like actions of isoflavones, we have included in the present study the analysis of the effects of daidzein on the expression of cannabinoid receptors. From our work, we concluded that daidzein treatment may modulate the influence of the HFD on genes and proteins related to lipid and glucose metabolism, through various interrelated pathways. The most striking effects were inhibition of lipogenesis via stearoyl-CoA desaturase 1 (SCD1) and PPARα/γ, and over activation of thermogenesis via the uncoupling protein 1 (UCP1).
Methods
Animals
All animal care and experimental procedures were performed in compliance with the European Communities directive 86/609/ECC and Spanish legislation (BOE 252/ 34367-91, 2005) regulating animal research. Male Wistar rats (∼250 g, 10–12 weeks old) (Charles Rivers, Barcelona, Spain) were housed in groups of two in cages maintained in standardized conditions of animal facilities (Servicio de Estabulario, Facultad de Medicina, Universidad de Málaga) at 20 ± 2°C room temperature, 40 ± 5% relative humidity and a 12 h light/dark cycle with dawn/dusk effect.
Diet-induced obesity. Measurement of food, caloric intake and body weight
Rats (n = 16 per group) were fed for 12 weeks with two different types of diets: the HFD (60% fat diet-D12492, Brogaarden, Gentofke, Denmark) and the STD (10% fat diet-D1245B) for 10 weeks in order to induce obesity. The STD consisted of 3.85 kcal·g−1 (with 20% protein, 70% carbohydrates and 10% fat) and the HFD had 5.24 kcal·g−1 (of which, 20% of the metabolizable energy content was protein, 20% carbohydrates and 60% fat) (see Table S1). The accumulated food/caloric intake by each rat and their body weight gain were measured every day for 12 weeks. Treatment with daidzein was started when the weight curves showed a clear divergence and stabilization between the two diets was reached, which lasted 10 weeks (see Figure S2).
Treatment
After 10 weeks (divergence of weight curves), diet-fed rats received one injection (i.p.) or a daily i.p. injection of either vehicle (1 mL·kg−1 of 10% Tocrisolve in saline) or daidzein (7-β-glucoside; LC Laboratories, Woburn, WA, USA) at 5 or 50 mg·kg−1, dissolved in 10% Tocrisolve for acute dose–response treatment, and at 50 mg·kg−1 for subchronic treatment during 14 days, while the diets remained unchanged (Figure S2). After one administration of daidzein (acute treatment), the accumulated food intake was measured over a time course of 30, 60, 120 and 240 min. During subchronic treatment, we measured the accumulated food/caloric intake and the body weight gain every day during the 14 days of treatment (see Figure S2). Finally, we generated six experimental groups for acute treatment with daidzein: STD-Vehicle, STD-Daidzein 5 mg·kg−1, STD-Daidzein 50 mg·kg−1, HFD-Vehicle, HFD-Daidzein 5 mg·kg−1 and HFD-Daidzein 50 mg·kg−1; and four experimental groups for subchronic treatment with daidzein: STD-Vehicle, STD-Daidzein, HFD-vehicle and HFD-Daidzein.
Sample collection
Animals from the four experimental groups were anaesthetized (sodium pentobarbital, 50 mg·kg−1, i.p.) 2 h after the last dose of treatment in a room separate from the other experimental animals. Blood samples were briefly collected from the orbital cavity and centrifuged (1250×g for 8 min, 4°C), and all plasma samples were frozen at −80°C for biochemical and hormonal analysis. Liver, white and brown adipose tissues and skeletal muscle from the abdominal wall were dissected. Part of each sample was fixed with 4% paraformadehyde in 0.1 M PBS by immersion until immunohistochemical analysis. The remaining of each sample, excluding brown adipose tissue, was frozen at −80°C until RT-PCR analysis.
RNA isolation and RT-PCR analysis
RNA from liver, skeletal muscle and adipose tissue samples was extracted using Trizol® method, according to the manufacturer's instructions (Gibco BRL Life Technologies, Baltimore, MD, USA). Samples of liver, skeletal muscle and adipose tissue (∼100, ∼100 and ∼300 mg respectively) were placed into 1–3 mL of Trizol Reagent (Invitrogen, CA, USA) and homogenized with an IKA-Ultra-Turrax® T8 (IKA-Werke GmbH, Staufen, Germany). In order to ensure purity of the mRNA sequences excluding molecules smaller than 200 nucleotides, RNA samples were isolated with RNAeasy minelute cleanup-kit (Qiagen, Hilden, Germany), which included digestion with DNase I column (Rnase-free DNase Set, Qiagen), according to manufacturer's instructions. Total mRNA concentration was quantified using a spectrophotometer (Eppendorf® BioPhotometer, Hamburg, Germany) to ensure A260/280 ratios of 1.8 to 2.0.
Reverse transcriptase reactions were carried out with 4 µg of muscle mRNA or liver mRNA and 1 µg of adipose tissue mRNA using the Transcriptor Reverse Transcriptase kit and random hexamer primers (Transcriptor RT, Roche Diagnostic GmbH, Manheim, Germany). Negative controls included reverse transcription reactions omitting reverse transcriptase. Quantitative real-time reverse transcription PCR (quantitative RT-PCR) was performed using an iCycler System (Bio-Rad, Hercules, CA, USA) or a CFX96TM Real-Time PCR Detection System (Bio-Rad), and the SYBR Green detection format (FastStart Universal Master Kit, Roche, Mannheim, Germany). Sample quantification was carried out differently in the three tissues for better performance. Skeletal muscle and liver samples were analysed by the classic standard curve method, whereas adipose tissue samples were analysed by relative quantification following In-Silico PCR system technology. Each reaction was run in duplicate and contained 5 µL of cDNA. For muscle and liver samples, cycling parameters were: 95°C for 3 min and 30 s to activate DNA polymerase followed by 45 cycles at 95°C for 15 s, annealing temperature for 30 s and a final extension step of 72°C for 15 s in which fluorescence was acquired. Melting curves analysis were performed to ensure only a single product was amplified. We analysed various housekeeping genes, selecting the most suitable for each tissue according to their homogeneity. Absolute values from each sample were normalized with regard to the housekeeping gene for β-actin, in skeletal muscle and for Sp1 in liver. For adipose tissue samples, cycling parameters were: 95°C for 5 min and 30 s to activate DNA polymerase followed by 40 cycles at 95°C for 10 s, annealing temperature for 30 s at 60°C and a final extension step of 72°C for 15 s in which fluorescence was acquired. The accepted amplification limit of the non-template controls was selected five cycles below the samples Cp value. The mean PCR amplification efficiency and quantification cycle for each gene was calculated by submitting raw fluorescence data generated with the CFX96 software (Bio-Rad) to Real-Time PCR Miner software (http://www.miner.ewindup.info). The qBase Excel software program was used to measure the relative expression level for each gene, and geNorm application for selecting reference genes to normalize mRNA expression levels, determining that Sp1 and Rpl19 were stable for this treatment. Finally, Sp1 was the reference gene selected to normalized mRNA expression levels in adipose tissue. Primers for PCR reaction (Table S2) were designed based on NCBI database sequences of rat reference mRNA, checked for specificity with blast software from NCBI website (http://blast.ncbi.nlm.nih.gov/Blast.cgi) and synthesized by Invitrogen.
Oil Red O staining
Liver samples were analysed for lipid and fat depots by staining with a fat-specific dye, Oil Red O. Frozen samples were cut into 30 µm-thick sections using a sliding microtome (Leica SM200R, Wetzlar, Germany) and fixated with 10% formol calcium. Sections were washed with distilled water and rinsed with 60% isopropanol. Then, sections were stained with freshly prepared Oil Red O working solution for 20 min (Oil Red O stock stain: 0.5 g of Oil Red O and 100 mL of isopropanol; Oil Red O working solution: 30 mL of the stock stain and 20 mL of distilled water). Sections were rinsed with 60% isopropanol, lightly stained with Mayer's haematoxylin, rinsed with tap water and mounted in aqueous mountant.
Immunohistochemistry
Paraffined tissue microarray blocks (Manual Tissue Arrayer MTA-1, beecher Instruments, Inc., Sun Prairie, WI, USA) of rat liver and brown adipose tissue were analysed for the presence and quantification of PPARα, SCD1, fatty acid synthase (FAS) and UCP1 by immunohistochemistry, immunofluorescence and quantified by densitometry. The primary antibodies were: rabbit polyclonal antibody PPARα (diluted 1:200; ABR cat. n° PA1-822A, Golden, CO, USA), goat polyclonal antibody SCD1 (diluted 1:50; Santa Cruz cat. n° sc-14720, Santa Cruz, CA, USA), rabbit polyclonal antibody FAS (diluted 1:50; Cell Signaling cat. #3180) and goat polyclonal antibody UCP1 (diluted 1:50; Santa Cruz cat. n° sc-14720) (see Appendix S1).
Digital high-resolution microphotographs of the liver and brown adipose tissue were taken under the same conditions of light and brightness/contrast by an Olympus BX41 microscope equipped with a 10x objective, an Olympus DP70 digital camera (Olympus Europa GmbH, Hamburg, Germany) and an Olympus X-Cite fluorescence system (X-Cite series 120Q, Olympus). Quantification of immunoreactivity and immunofluorescence were carried out by measuring densitometry of the images obtained from replicates and samples: two replicates per sample, eight samples per group and four groups, using the analysis software ImageJ 1,38x (National Institute of Health, Bethesda, MD, USA).
Data analysis
All data are shown as mean ± SEM of at least eight determinations per experimental group. Kolmogorov–Smirnov normality tests indicated that all data followed a Gaussian distribution (P > 0.1), so we selected a parametric statistical test. Differences between the diets and treatments were analysed by two-way anova for repeated measures, followed by Bonferroni post hoc test for multiple comparisons. The level of statistical significance was set at P < 0.05.
Results
In order to control the effect of the HFD and daidzein treatment; we first monitored the accumulated food/caloric intake and body weight gain after either acute (dose–response) or subchronic treatment. We have also analysed biochemical parameters such as glucose, triglycerides, cholesterol and hepatic enzymes, among others, and plasma levels of adiponectin, insulin and leptin. In order to analyse the metabolic impact of an HFD (60% fat) and the response to daidzein treatment we studied the expression of specific genes and proteins in the liver, white and brown adipose tissues and skeletal muscle. The selected enzymes and receptors represent a selection of molecules implicated in lipid and glucidic metabolism with a putative role in energy metabolism. Clearly, the physiological differences between liver, skeletal muscle and adipose tissues determine that the molecules analysed for gene expression are not the same in the three tissues. So, the nuclear receptors PPAPα and PPARγ and the acetyl-CoA-oxidase (ACOX) were analysed in these three tissues. The hormones adiponectin and leptin were analysed in the white adipose tissue only as well as its receptors, the adiponectin receptor 1 (AdipoR1) and adiponectin receptor 2 (AdipoR2) in the skeletal muscle and liver respectively. Additional gene expressions for FAS and SCD1 were analysed in liver and white adipose tissue; the growth hormone receptor in muscle and liver; acyl-CoA carboxylase (ACC) only in adipose tissue and fatty acid binding protein 1 only in liver. The results obtained for gene expressions were compared with those for the corresponding proteins, for PPARα, SCD1 and FAS in liver. In addition, UCP1, an enzyme involved in the regulation of body temperature and glucose metabolism, was analysed in brown adipose tissue. SCD1 has recently been shown to be a critical control point of lipid partitioning and body weight regulation. It catalyses the rate-limiting step in the biosynthesis of monounsaturated fatty acids, which are required for normal rates of synthesis of triglycerides, cholesterol esters and phospholipids (Dobrzyn et al., 2004). Finally, we also evaluated the gene expression of the cannabinoid CB1 and CB2 receptors in the three tissues.
Effect of diet on accumulated food, caloric intake and body weight gain
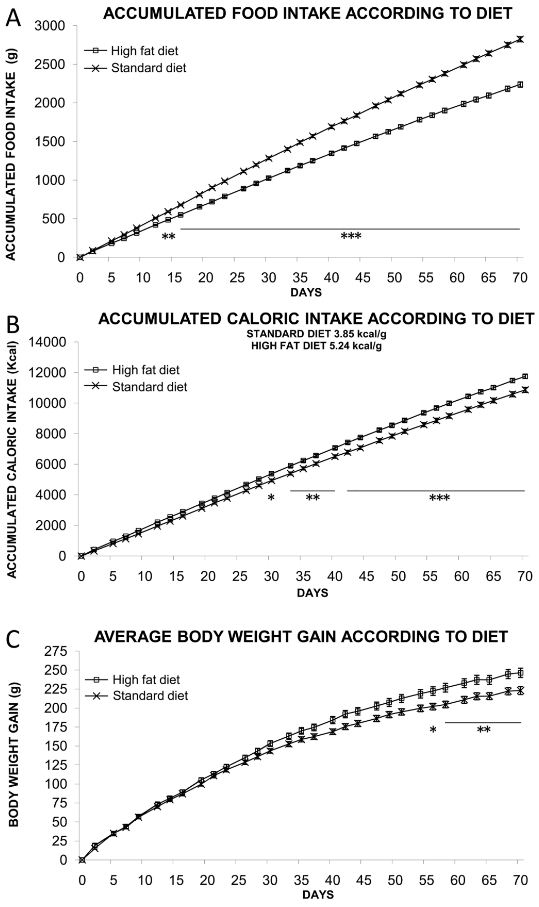
The accumulated food intake, caloric intake and body weight gain in the rats fed with either the STD (10% fat) or with the HFD (60% fat) over the first 10 weeks of the feeding period are shown in Figure S3. Rats fed with STD accumulated significantly more food intake than rats fed with the HFD from the day 15 on (P < 0.01 between day 14 and 16, P < 0.001 from day 17 on) (Figure S3A). On the contrary, the accumulated caloric intake was higher in HFD than in STD rats and such differences were also statistically significant from the day 30 on (P < 0.05 in day 30, P < 0.01 between day 34 and 41, P < 0.001 from day 42 on) (Figure S3B). The lower food intake in HFD rats is due to the higher caloric/energy content in the HFD than the STD (Table S1). Accumulated caloric intake correlates with the body weight increase (Figure S3C). Interestingly, body weight gain also showed a significant divergence in HFD rats in comparison with STD rats from the eighth week on (56 days) (P < 0.05 in day 56, P < 0.01 from day 57 on). Two-way anova analysis showed a very significant diet effect on accumulated food intake [Diet: F(1,900) = 3092.56, P < 0.0001], accumulated caloric intake [Diet: F(1,900) = 447.53, P < 0.0001] and body weight gain [Diet: F(1,900) = 130.75, P < 0.0001]. When body weight gain was stable over time (after 10 weeks in each of the diets), we scheduled both acute (5 and 50 mg·kg−1) and subchronic (50 mg·kg−1) treatments with daidzein, while the diets remained unchanged.
Dose–response of the accumulated food intake with STD and HFD after acute treatment with daidzein
After a feeding period of 10 weeks, rats only received one injection (acute treatment) of either vehicle or two different doses of daidzein (5 mg·kg−1 and 50 mg·kg−1), at different periods of time 30, 60, 120 and 240 min (Figure 1). This was to identify the optimal dose at which treatment with daidzein would be more effective on food/caloric intake and body weight changes. We detected a marked reduction in accumulated food intake using the 50 mg·kg−1 dose of daidzein in both STD (P < 0.001) and HFD (P < 0.01) in all the time periods analysed in the experiment (Figure 1A and B). On the contrary, the 5 mg·kg−1 dose of daidzein did not affect food intake in the time periods analysed. Interestingly, two-way anova analysis showed that daidzein induced a significant decrease by a dose–response effect on accumulated food intake in STD [5 mg·kg−1: F(1,56) = 5.51, P < 0.05; 50 mg·kg−1: F(1,56) = 479.4, P < 0.0001], while daidzein produced an opposite dose–response on accumulated food intake in HFD [raised at 5 mg·kg−1: F(1,56) = 11.98, P = 0.001; decreased at 50 mg·kg−1: F(1,56) = 122.15, P < 0.0001]. These results indicated that the 50 mg·kg−1 dose of daidzein was the most appropriate for the subchronic experiment.
Figure 1.
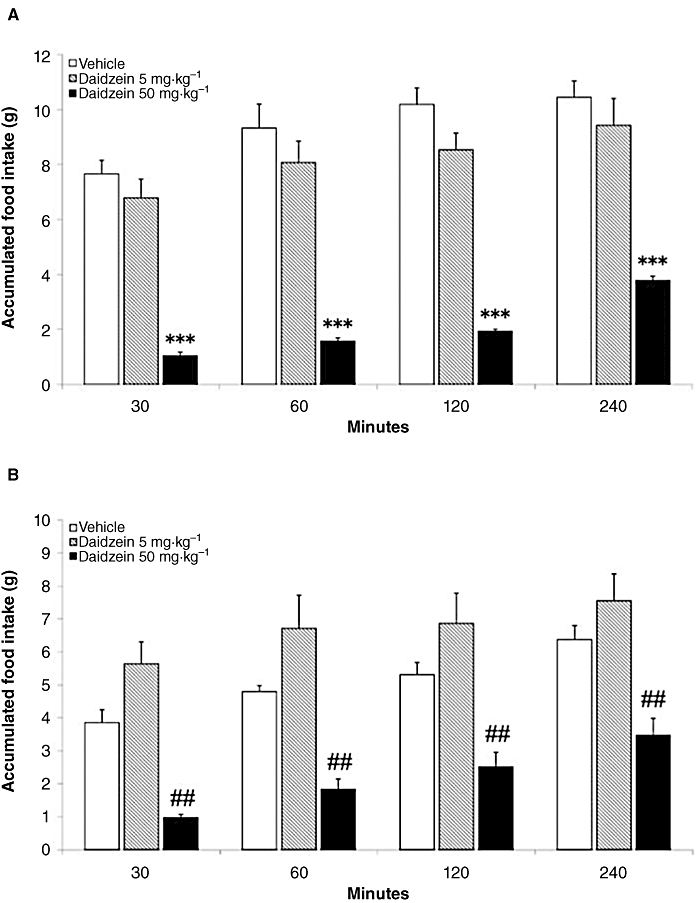
Dose–response effects of acute administration of daidzein at 5 and 50 mg·kg−1 on accumulated food intake in male rats fed with a standard/low-fat diet (STD) and a very high-fat diet (HFD) at different periods of time 30, 60, 120 and 240 min. There was a significant reduction in accumulated food intake using the 50 mg·kg−1 dose of daidzein in both STD (A) and HFD (B) in all the time periods analysed in the experiment. On the contrary, the 5 mg·kg−1 dose of daidzein did not exert any effects on food intake in the time periods analysed. Histograms represent the mean ± SEM (eight animals per group). Two-way anova followed by Bonferroni post test: ***P < 0.001 significantly different from vehicle-treated STD group; ##P < 0.01 significantly different from vehicle-treated HFD group. Treatment effects are summarized in Table S3.
Effect of subchronic treatment with daidzein on accumulated food/caloric intake and body weight gain
After a feeding period of 10 weeks, rats received a daily dose of either vehicle (1 mL·kg−1 of 10% Tocrisolve) or daidzein (1 mL·kg−1 of 50 mg·kg−1 in 10% Tocrisolve) during 14 days, while the diets remained unchanged (Figure 2). Treatment with daidzein reduced the accumulated food intake in rats on both diets from the day 11 of treatment on (Figure 2A), while daidzein reduced accumulated caloric intake only in rats on STD from the day 6 of treatment until the end of the experiment (Figure 2B). This also correlated with a decrease in body weight gain in both diets from days 3–4 of treatment, an effect more prominent in HFD feeding (Figure 2C). Two-way anova analysis showed that daidzein induced a significant decrease on accumulated food intake [Treatment: F(1,196) = 48.27, P < 0.0001 for STD; F(1,196) = 76.69, P < 0.0001 for HFD], accumulated caloric intake [Treatment: F(1,196) = 133.89, P < 0.0001 for STD; F(1,196) = 34.33, P < 0.0001 for HFD] and average body weight gain [Treatment: F(1,196) = 92.08, P < 0.0001 for STD; F(1,196) = 130.36, P < 0.0001 for HFD].
Figure 2.
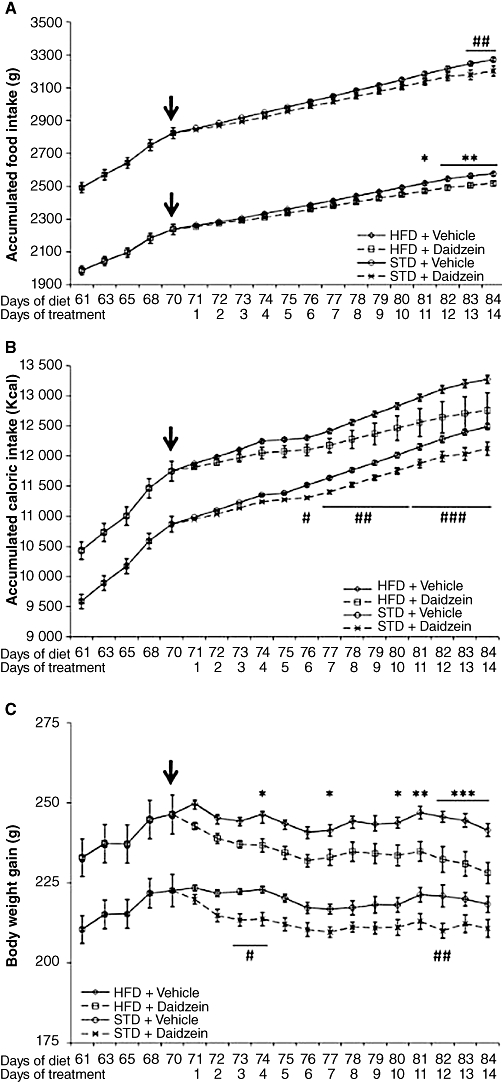
Effects of the STD and the HFD for 10 days before daidzein administration and during 14 days of daidzein treatment (50 mg·kg−1) on accumulated food/caloric intake and body weight gain, while the diets remained unchanged. Treatment with daidzein reduced accumulated food (A) and caloric (B) intake in both diets, from day 8 of treatment, and this correlated with a significant body weight decrease (C). Arrows point to the beginning of daidzein administration. Histograms represent the mean ± SEM (eight animals per treated group). Two-way anova followed by Bonferroni post hoc test: *P < 0.05, **P < 0.01, ***P < 0.001 significantly different from daidzein-treated HFD group; #P < 0.05, ##P < 0.01, ###P < 0.001 significantly different from daidzein-treated STD group. Treatment effects are summarized in Table S3.
Fat profile in skeletal muscle and liver after diet and subchronic treatment of daidzein
To assess the magnitude of the changes in accumulated fat deposits on the metabolic tissues studied in our models; we analysed the total fat content in both skeletal muscle and liver (Figure 3). In skeletal muscle, daidzein treatment did not affect fat content [Treatment: F(1,26) = 3.917, P = 0.058] (Figure 3A). In liver, after HFD, there was a significant increase in the amount of fat [Diet: F(1,25) = 9.27, P < 0.01] (Figure 3B). We did not detect interaction between diet and treatment factors in any case.
Figure 3.
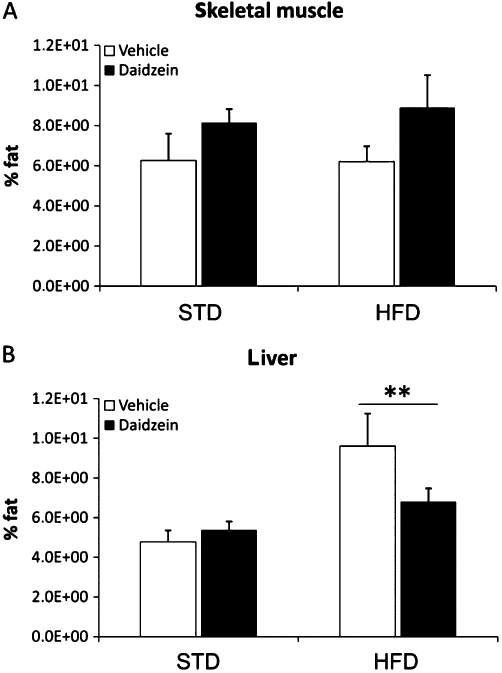
Effects of a subchronic treatment of daidzein (50 mg·kg−1, 14 days) on skeletal muscle and liver fat profile in male rats fed with the STD or the HFD. There were no significant differences in the amount of fat in the skeletal muscle with either diet or daidzein treatment (A). There was only a significant increase in the amount of fat in the liver by a diet effect (B). Histograms represent the mean ± SEM (eight animals per group). Two-way anova followed by Bonferroni post hoc test: **P < 0.05 for diet effect.
The biochemical analysis of fat content agreed with the results obtained with a specific lipid and fat depot stain, Oil Red O, in liver (Figure 4). The fat depots in the liver of rats fed with the HFD were increased (P < 0.01; Figure 4A–C) and were decreased after daidzein treatment (P < 0.05; Figure 4A, C and E). Two-way anova analysis also revealed a significant effect between diets [Diet: F(1,8) = 11.45, P < 0.01]. We also detected a significant interaction between both factors [diet vs. treatment: F(1,8) = 14.49, P < 0.01], that is, daidzein induced a different effect on liver fat content depending on the diet. Interestingly, it seems that treatment with daidzein reverses the amount of fat in the liver caused by high-fat feeding (Figures 3B and 4A).
Figure 4.
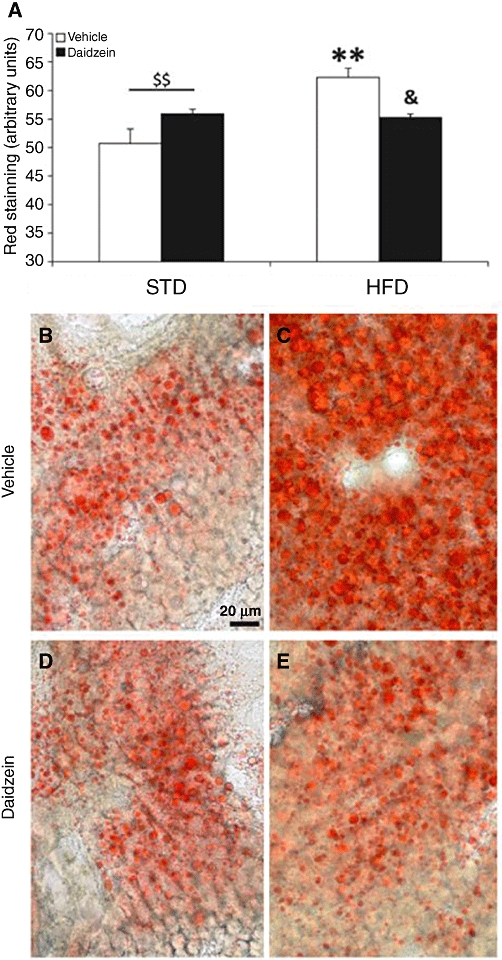
Effect of a subchronic treatment of daidzein (50 mg·kg−1, 14 days) on liver fat depots in male rats fed with the STD or the HFD. We found a significant increase in the fat depots in the liver after HFD feeding; and a significant fall after daidzein treatment in HFD-fed rats (A). Representative high-magnification images from the liver, stained with Oil Red O in the four rat groups (B–E). Histograms represent the mean ± SEM (three animals per group). Two-way anova followed by Bonferroni post hoc test: **P < 0.01 significantly different from vehicle-treated STD group, &P < 0.05 significantly different from vehicle-treated HFD group, $$P < 0.01 for diet effect. Scale bar is shown in image B.
Effect of diet and subchronic treatment with daidzein on plasma metabolites and liver enzymes
Results of the analysis of plasma metabolites and liver enzymes analysed are shown in Table 1. The HFD showed a significant decrease in the circulating levels of urea (P < 0.05) and triglycerides (P < 0.01), compared with values in the STD group. Some of these results could be explained by the composition of the two diets used (Table S1). Combining STD and treatment with daidzein (50 mg·kg−1) decreased the plasma levels of creatinine (P < 0.001), urea, high-density lipoprotein (HDL)-cholesterol and triglycerides (P < 0.05), compared with those in vehicle-treated animals (Table 1). However, glucose levels were very significantly increased after treatment with daidzein (P < 0.01). The combination of HFD with daidzein decreased levels of creatinine in plasma (P < 0.001). Once again, glucose levels were raised after HFD and treatment with daidzein, although less than the results with STD (Table 1). Two-way anova analysis revealed a significant diet effect in the plasma levels of glucose [Diet: F(1,27) = 10.49, P < 0.01], urea [Diet: F(1,27) = 10.68, P < 0.01], creatinine [Diet: F(1,27) = 4.69, P < 0.05] and triglycerides [Diet: F(1,27) = 9.2, P < 0.01] and a significant treatment effect in the plasma levels of glucose [Treatment: F(1,27) = 21.04, P < 0.0001], urea [Treatment: F(1,27) = 9.87, P < 0.01], creatinine [Treatment: F(1,27) = 76.56, P < 0.0001], triglycerides [Treatment: F(1,27) = 4.41, P < 0.05] and cholesterol [Treatment: F(1,27) = 3.53, P < 0.05]. We only detected interaction in HDL-cholesterol [Diet vs. Treatment: F(1,26) = 5.89, P < 0.05], that is, daidzein had a different effect on HDL-cholesterol depending on the diet.
Table 1.
Effect of diet and daidzein on plasma metabolites of obese male Wistar rats
| STD | HFD | |||
|---|---|---|---|---|
| Plasma metabolites | Vehicle | Daidzein | Vehicle | Daidzein |
| Glucose (mg·mL−1) | 1.052 ± 0.089 | 1.638 ± 0.121** | 0.75 ± 0.109 | 1.205 ± 0.133# |
| Urea (mg·mL−1) | 0.395 ± 0.017 | 0.326 ± 0.024* | 0.338 ± 0.0074* | 0.267 ± 0.0187 |
| Creatinine (mg·mL−1) | 0.0082 ± 0.0002 | 0.0058 ± 0.0002*** | 0.0086 ± 0.0002 | 0.0065 ± 0.0004### |
| Uric acid (mg·mL−1) | 0.0057 ± 0.0017 | 0.0066 ± 0.0007 | 0.0043 ± 0.0007 | 0.0060 ± 0.0011 |
| HDL-C (mg·mL−1) | 0.273 ± 0.012 | 0.223 ± 0.012* | 0.227 ± 0.015 | 0.245 ± 0.016 |
| Triglycerides (mg·mL−1) | 2.007 ± 0.331 | 1.133 ± 0.113* | 0.935 ± 0.148** | 0.914 ± 0.180 |
| Cholesterol (mg·mL−1) | 0.920 ± 0.073 | 0.716 ± 0.051 | 0.816 ± 0.087 | 0.761 ± 0.051 |
| ALT (U·L−1) | 41.12 ± 3.88 | 36.63 ± 6.65 | 48.12 ± 4.75 | 37.85 ± 2.53 |
| AST (U·L−1) | 112.57 ± 14.04 | 77.13 ± 6.41 | 112.38 ± 20.60 | 95.43 ± 30.34 |
| GGT (U·L−1) | 6.12 ± 0.74 | 5.75 ± 0.56 | 5.86 ± 0.43 | 5.53 ± 0.67 |
Data shown are the plasma levels of metabolites in rats fed with STD or HFD and treated with vehicle or daidzein (50 mg·kg−1, 14 days). Values represent the mean ± SEM (eight animals per treated group). Two-way anova and Bonferroni post test for multiple comparisons:
P < 0.05
P < 0.01
P < 0.001 significantly different from STD rats treated with vehicle
P < 0.05
P < 0.001 significantly different from HFD rats treated with vehicle.
Diet, treatment and interaction effects are summarized in Table S3.
Although plasma levels of transaminases (ALT, AST and GGT) did not differ between diets or treatment of the four experimental groups, there was a tendency towards decreased AST, after treatment with daidzein with either STD or HFD (Table 1). We did not detect interaction between diet and treatment in any case. Table S3 summarizes the significance and the direction of the diet and treatment effects, including the interaction between both factors, on plasma metabolites.
Effect of diet and subchronic treatment with daidzein on plasma hormone levels
Treatment with daidzein (50 mg·kg−1) did not affect insulin in plasma using either diet (Figure 5A). However, the levels of adiponectin in plasma were reduced after treatment with daidzein in both STD and HFD groups (both at P < 0.05) (Figure 5B). Two-way anova analysis confirmed a significant decrease on adiponectin levels by daidzein [Treatment, F(1,27) = 14.11, P < 0.001]. Interestingly, daidzein induced a significant increase on leptin levels [Treatment, F(1,17) = 9.05, P < 0.01] (Figure 5C). We did not detect interaction between diet and treatment in any case. Table S3 summarizes the significance and the direction of the diet and treatment effects, including the interaction between both factors, on plasma hormone levels.
Figure 5.
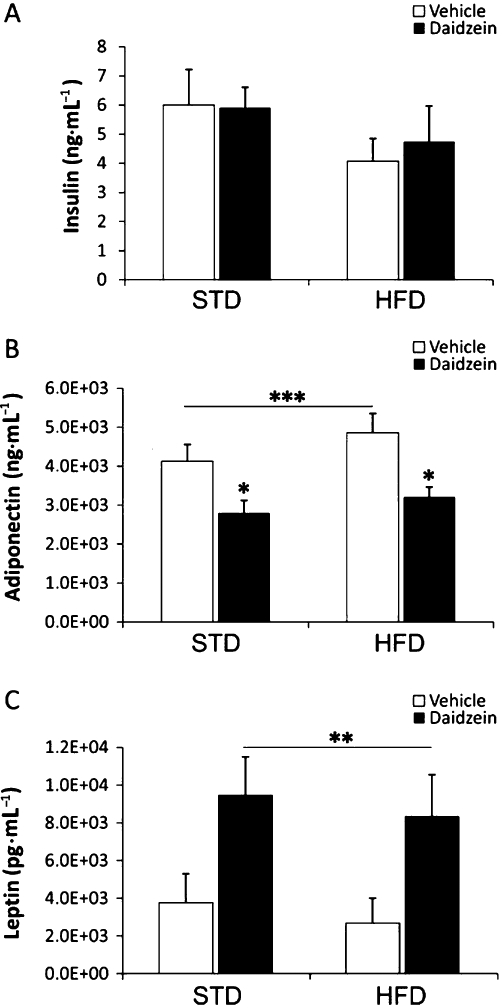
Effects of a subchronic treatment of daidzein (50 mg·kg−1, 14 days) on plasma insulin (A), adiponectin (B) and leptin (C) levels in rats fed with the STD or the HFD. Treatment with daidzein did not affect levels of insulin, but reduced levels of adiponectin and increased levels of leptin in the plasma of both STD and HFD rats. Histograms represent the mean ± SEM (eight animals per group). Two-way anova followed by Bonferroni post hoc test: *P < 0.05 significantly different from vehicle-treated groups, **P < 0.01 and ***P < 0.001 for treatment effect.
Effect of diet on the expression of selected genes for metabolic control in white adipose tissue, skeletal muscle and liver
After the complete feeding period (12 weeks) with either the STD or the HFD, animals were killed and samples from adipose tissue, skeletal muscle and liver extracted and processed for RT-PCR analysis. As shown in Figure 6, changes in gene expression were most marked in adipose tissue and least in skeletal muscle. Table S3 summarizes the significance and the direction of the diet effects on gene expression.
Figure 6.
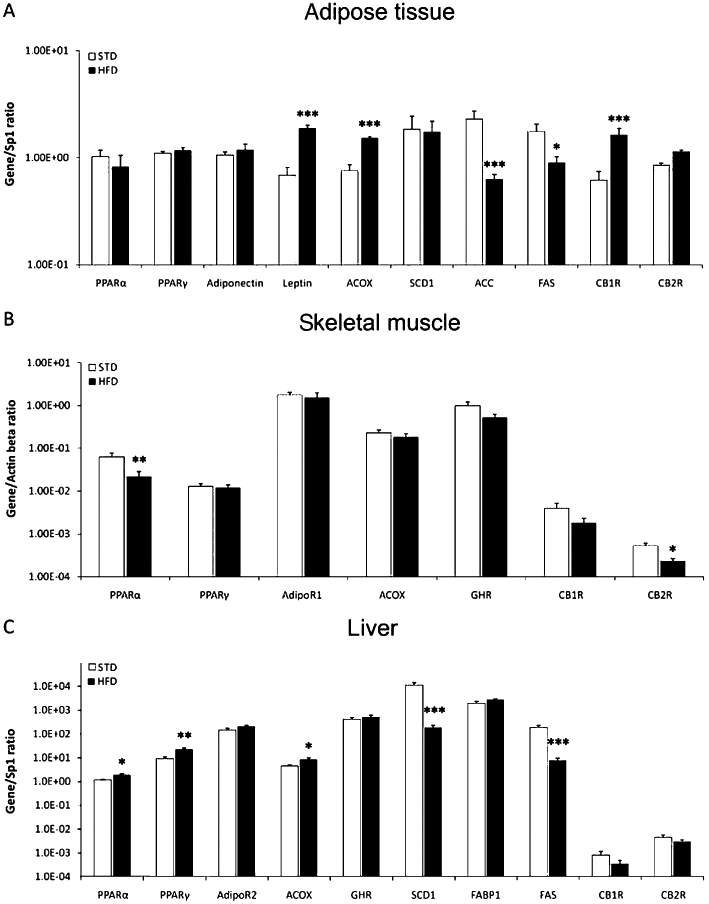
Effects of diet on gene expression of molecules involved in glucose and lipid metabolism, in adipose tissue, skeletal muscle and liver. Regarding the adipose tissue, HFD feeding increased gene expression of leptin, ACOX and CB1 receptors, but decreased those of ACC and FAS. In the skeletal muscle, gene expression of PPARα and CB2 receptors was reduced after the HFD. In liver, the HFD increased gene expression for PPARα, PPARγ and ACOX, but reduced those of SCD1 and FAS. Values from each sample were normalized with regard to the housekeeping gene Sp1 for adipose tissue and liver and β-actin for skeletal muscle. Histograms represent the mean ± SEM (eight animals per group). Two-way anova followed by Bonferroni post hoc test: *P < 0.05, **P < 0.01, ***P < 0.001 significantly different from STD. Diet, treatment and interaction effects are summarized in Table S3.
White adipose tissue
Feeding with the HFD increased the levels of leptin and ACOX, and of the cannabinoid CB1 receptor (P < 0.001). HFD feeding also decreased gene expression of the enzymes ACC (P < 0.001) and FAS (P < 0.05) (Figure 6A). Gene expression of any of the remaining molecules and enzymes studied in adipose tissue were not affected by the HFD. Two-way anova analysis showed a diet effect on PPARα[F(1,20) = 5.11, P < 0.05], leptin [F(1,21) = 29.34, P < 0.0001], ACOX [F(1,22) = 23.36, P < 0.0001], ACC [F(1,22) = 19.08, P < 0.001], FAS [F(1,22) = 20.37, P < 0.001], CB1 receptor [F(1,22) = 47.91, P < 0.0001] and CB2 receptor [F(1,23) = 6.02, P < 0.05] gene expressions (Table S3).
Skeletal muscle
PPARα and CB2 receptor gene expression was reduced (P < 0.01 and P < 0.05 respectively) after the HFD (Figure 6B). Although not significant, there was a tendency towards a decrease for the other molecules analysed in the skeletal muscle. Two-way anova analysis showed a diet effect on PPARγ[F(1,25) = 7.22, P < 0.05] and CB2 receptor [F(1,23) = 10.47, P < 0.01] gene expressions (Table S3).
Liver
Liver is the main regulatory organ with specific metabolic effects in the other peripheral tissues. In our model, the HFD increased expression of PPARα, PPARγ and ACOX (P < 0.05, P < 0.01 and P < 0.05 respectively). However, the same diet reduced the enzymes, SCD1 and FAS (P < 0.001). Such decreases in synthetic enzymes agreed with results observed in adipose tissue. No significant changes were observed for the remaining molecules analysed in liver (Figure 6C). Two-way anova analysis showed a diet effect on PPARα[F(1,22) = 9.54, P < 0.01], PPARγ[F(1,23) = 9.3, P < 0.01], ACOX [F(1,23) = 6, P < 0.05], SCD1 [F(1,20) = 21.09, P < 0.001], FAS [F(1,21) = 30.53, P < 0.0001] and CB2 receptor [F(1,21) = 4.73, P < 0.05] gene expressions (Table S3).
Effect of diet and subchronic treatment with daidzein on the expression of selected genes for metabolic control in white adipose tissue, skeletal muscle and liver
After feeding with STD or HFD for 10 weeks, rats received a daily i.p. injection of daidzein (50 mg·kg−1) for 14 days, then were killed 2 h after treatment and samples from their adipose tissue, skeletal muscle and liver extracted and analysed by RT-PCR (Figures 7 and 8). Table S3 summarizes the significance and the direction of the treatment effect on gene expression, including the interaction between diet and treatment.
Figure 7.
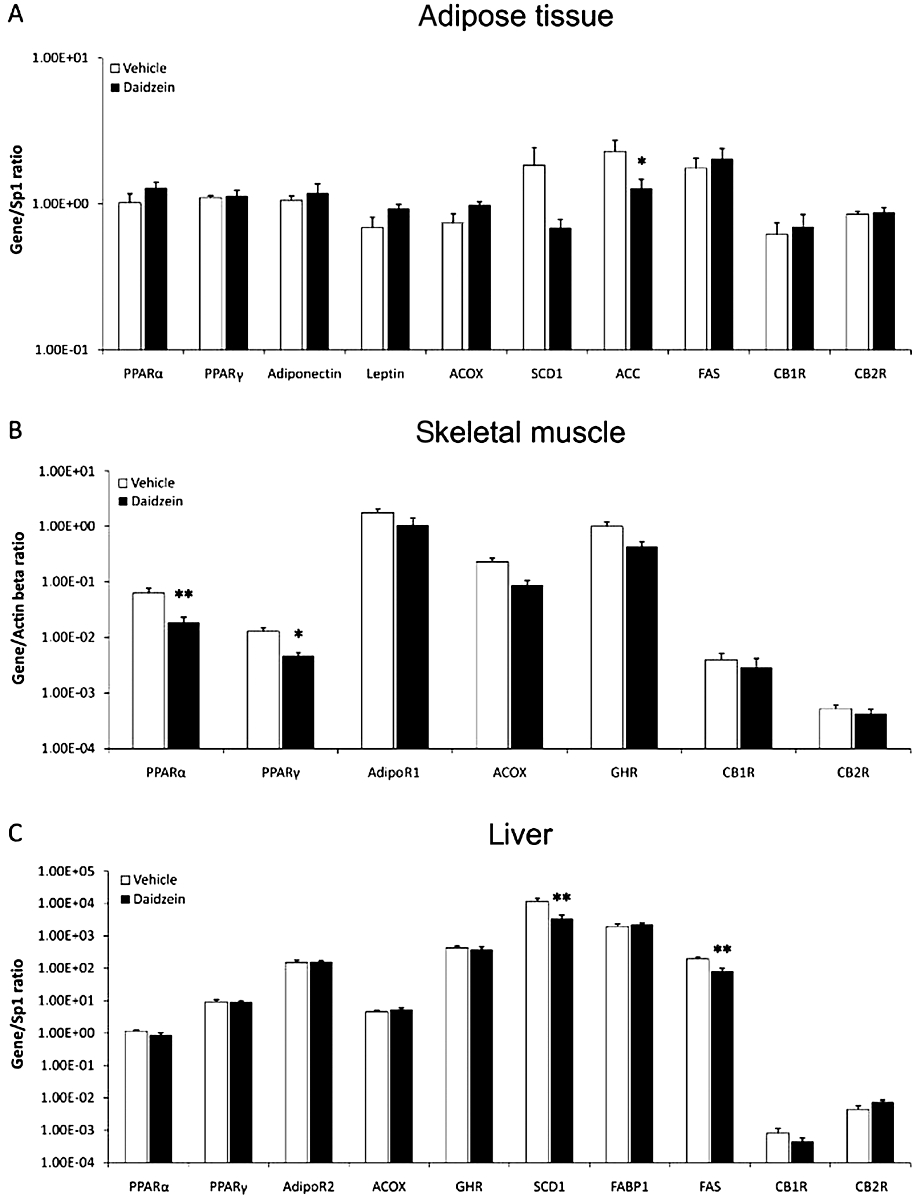
Effect of a subchronic treatment of daidzein (50 mg·kg−1, 14 days) using the STD, on gene expression of molecules involved in glucose and lipid metabolism, in adipose tissue, skeletal muscle and liver. There was a decrease in the levels of gene expression of ACC in adipose tissue (A), PPARα and PPARγ in skeletal muscle (B), and SCD1 and FAS in liver (C). Values from each sample were normalized with regard to the housekeeping gene Sp1 for adipose tissue and liver and β-actin for skeletal muscle. Histograms represent the mean ± SEM (eight animals per group). Two-way anova followed by Bonferroni post hoc test: *P < 0.05, **P < 0.01 significantly different from vehicle. Diet, treatment and interaction effects are summarized in Table S3.
Figure 8.
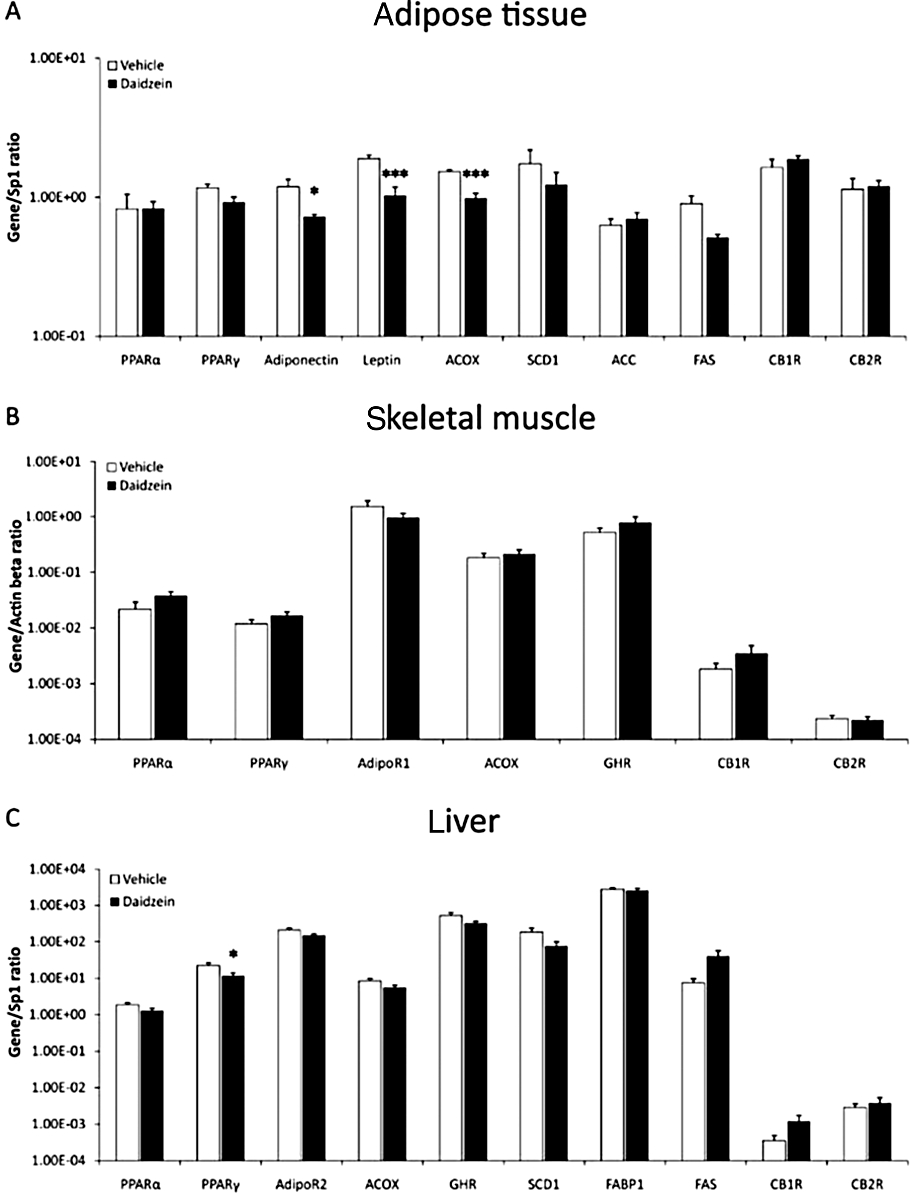
Effect of a subchronic treatment of daidzein (50 mg·kg−1, 14 days) using the HFD, on gene expression of molecules involved in glucose and lipid metabolism, in adipose tissue, skeletal muscle and liver. Gene expression of adiponectin, leptin and ACOX in adipose tissue (A), and PPARγ in liver (C) were decreased. None of the genes studied in skeletal muscle were changed. Values from each sample were normalized with regard to the housekeeping gene Sp1 for adipose tissue and liver and β-actin for skeletal muscle. Histograms represent the mean ± SEM (eight animals per group). Two-way anova followed by Bonferroni post hoc test: *P < 0.05, ***P < 0.001 significantly different from vehicle. Diet, treatment and interaction effects are summarized in Table S3.
White adipose tissue
Treatment with daidzein and the STD decreased gene expression of the lipogenic enzyme ACC only (P < 0.05), with no effect on the rest of molecules studied in this tissue (Figure 7A). Feeding with the HFD and treatment with daidzein reduced the levels of adiponectin (P < 0.05), leptin (P < 0.001) and ACOX (P < 0.001) (Figure 8A). Although not significant, the levels of SCD1 also showed a tendency to decrease. However, such treatment did not have any effects on PPARα, ACC or the CB1 and CB2 receptors (Figure 8A). Two-way anova analysis only showed a significant treatment effect on leptin gene expression [F(1,21) = 6.69, P < 0.05], and a tendency for ACOX and SCD1 gene expressions (P < 0.06). Interaction between diet and treatment was detected in adiponectin [F(1,21) = 5.98, P < 0.05], leptin [F(1,21) = 21.03, P < 0.001] and ACOX [F(1,22) = 23.36, P < 0.0001] gene expressions, that is, daidzein had a different effect depending on the diet (Table S3).
Skeletal muscle
Expression of the nuclear receptors PPARα and PPARγ was reduced (P < 0.01 and P < 0.05 respectively) after feeding with the STD and treatment with daidzein. There were no effects on the other genes studied (Figure 7B). Feeding with the HFD and treatment with daidzein did not change the expression of any of the genes studied in skeletal muscle (Figure 8B). Two-way anova analysis did not detect treatment effect on any of the genes analysed, but detected interaction between diet and treatment, that is, daidzein produced a different response depending on the diet in PPARα[F(1,26) = 11.87, P < 0.01], PPARγ[F(1,25) = 9.92, P < 0.01], ACOX [F(1,26) = 5.57, P < 0.05] and growth hormone receptor [F(1,26) = 5.65, P < 0.05] gene expressions (Table S3).
Liver
After treatment with daidzein using the STD, the mRNA levels of SCD1 and FAS (P < 0.01), both lipogenic enzymes, were reduced in liver. There were no changes on the gene expression for any of the other molecules (Figure 7C). Combination of daidzein and the HFD reduced the levels of PPARγ gene expression in liver (P < 0.05), without affecting expression of the other genes (Figure 8C). Two-way anova analysis showed a significant treatment effect on PPARα[F(1,22) = 6.05, P < 0.05], PPARγ[F(1,23) = 4.32, P < 0.05] and SCD1 [F(1,20) = 6.74, P < 0.05] gene expressions. Daidzein produced a different effect depending on the diet (interaction) in PPARγ[F(1,23) = 4.32, P < 0.05], ACOX [F(1,23) = 4.6, P < 0.05], SCD1 [F(1,20) = 6.38, P < 0.05] and FAS [F(1,21) = 12.39, P < 0.01] gene expressions (Table S3).
Effect of diet and daidzein on the expression of selected proteins for metabolic control in liver and brown adipose tissue
After evaluating the most relevant changes observed on gene expression, we analysed the levels of proteins such as PPARα, SCD1 and FAS in liver, and UCP1 in brown adipose tissue. Figure 9 shows a panel of representative high-magnification images from the liver immunostained for PPARα, SCD1 and FAS in the four rat groups (STD, STD-daidzein, HFD, HFD-daidzein). Densitometric analysis of these images showed changes similar to those of the gene expression studies. Immunoreactive PPARα was increased in HFD rats (P < 0.05; Figure 9E), but tended to decrease after daidzein treatment. Two-way anova analysis also revealed a significant effect between diets [Diet, F(1,28) = 11.24, P < 0.01] and a significant effect with daidzein [Treatment, F(1,28) = 4.22, P < 0.05] (Table S3). SCD1 immunofluorescence was decreased in HFD rats (P < 0.01; Figure 9J), a change accentuated in rats treated with daidzein and fed with either diet (P < 0.001 for STD; P < 0.05 for HFD). Two-way anova analysis also revealed a significant effect between diets [Diet, F(1,24) = 21.45, P < 0.001] and a significant effect with daidzein [Treatment, F(1,24) = 26.36, P < 0.001]. FAS also showed a very significant decrease on the immunofluorescence levels in HFD rats (P < 0.001). Diet effect was confirmed after two-way anova analysis [Diet, F(1,28) = 119.37, P < 0.0001] (Table S3). In Figure 10, UCP1 immunofluorescence in brown adipose tissue was increased by daidzein with either diet [Treatment, F(1,27) = 5.65, P < 0.05] (Figure 10A and Table S3).
Figure 9.
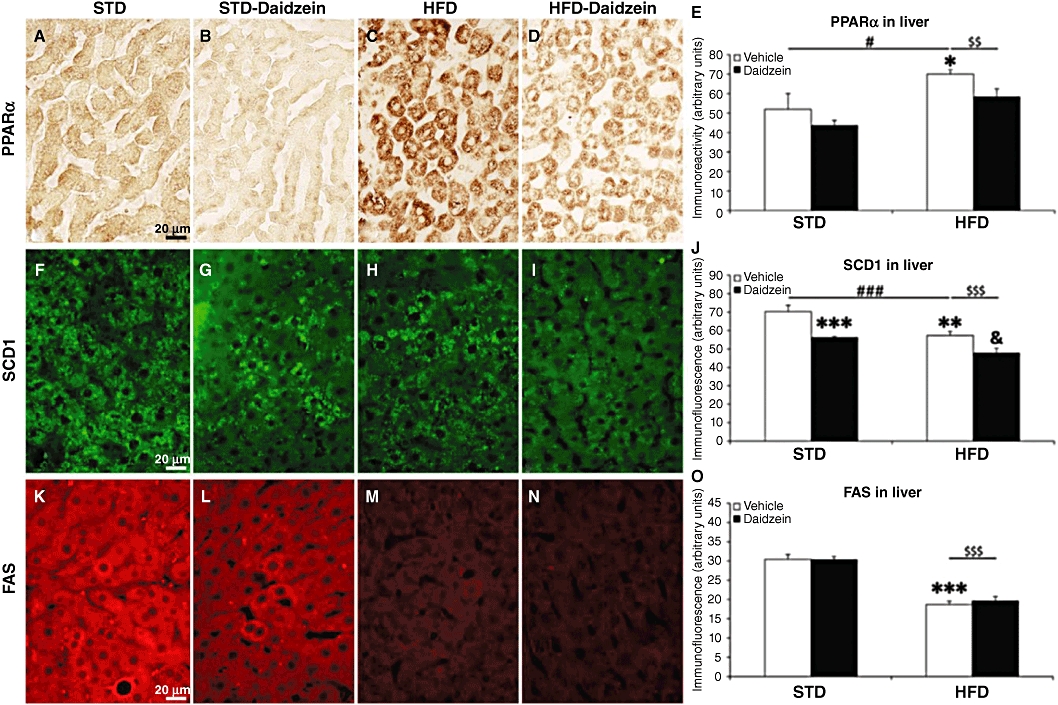
Effects of diet and daidzein treatment (50 mg·kg−1, 14 days) on protein expression of PPARα, SCD1 and FAS in liver by immunohistochemistry, immunofluorescence and densitometry. Representative high-magnification images from liver samples, immunostained for PPARα (A–D), SCD1 (F–I) and FAS (K–N) in the four rat groups (STD, STD-daidzein, HFD, HFD-daidzein). Quantification of densitometry showed an increase of PPARα expression in HFD (E), a decrease of SCD1 expression in HFD that was accentuated after daidzein treatment in both diets (J), and a decrease of FAS expression in HFD (O). Histograms represent the mean ± SEM (eight animals per group). Two-way anova followed by Bonferroni post hoc test: *P < 0.05, **P < 0.01, ***P < 0.001 versus vehicle-treated STD group, &P < 0.05 significantly different from vehicle-treated HFD group, $$P < 0.01, $$$P < 0.001 for diet effect, #P < 0.05, ###P < 0.001 for daidzein effect. Scale bar is shown in (A), (F) and (K). Diet, treatment and interaction effects are summarized in Table S3.
Figure 10.
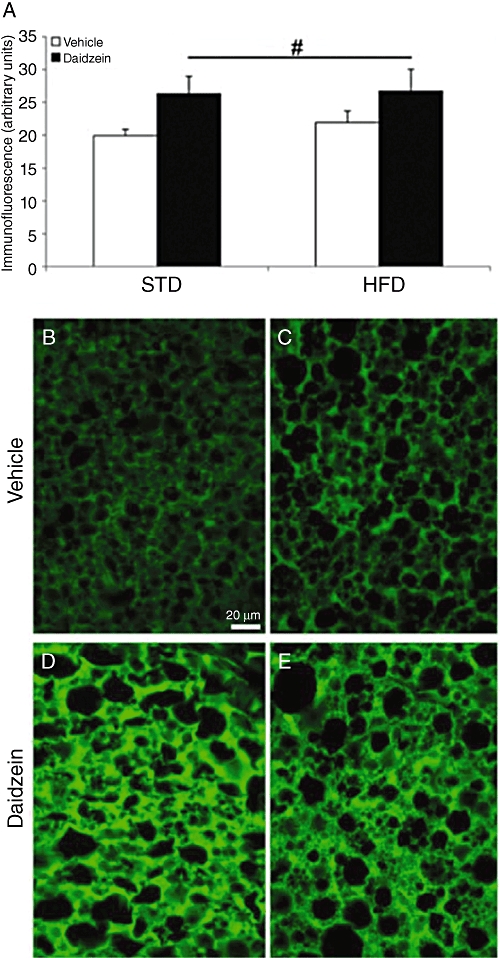
Effects of diet and daidzein treatment (50 mg·kg−1, 14 days) on protein expression of UCP1 in brown adipose tissue by immunofluorescence and densitometry. Quantification of densitometry only showed a significant increase of UCP1 expression after daidzein treatment (A). Representative high-magnification images from the brown adipose tissue immunostained for UCP1 in the four rat groups (STD, STD-daidzein, HFD, HFD-daidzein; B–E). Histograms represent the mean ± SEM (eight animals per group). Two-way anova followed by Bonferroni post hoc test: #P < 0.05 for daidzein effect. Scale bar is shown in (B).
Discussion
In many clinical trials and animal studies, feeding with soy isoflavones improved blood lipid profiles and glucose metabolism and, therefore, was beneficial for several chronic disorders associated with obesity and diabetes (Clarkson, 2002; Messina et al., 2002; Clair and Anthony, 2005; Cassidy and Hooper, 2006; Zhang et al., 2010). However, the hypolipidaemic actions of isoflavones and the mechanisms involved are still debated.
Here, we have evaluated the effects of the HFD and the responses to a subchronic treatment with daidzein, on body weight and several plasma parameters. We have also identified the molecular changes in the physiological pathways of the main metabolic tissues. Table S3 summarizes the effects induced by the diet and the isoflavone treatment, including the interaction between both factors, in all the parameters analysed in this study.
Our first results showed that the HFD caused weight gain in these animals. Interestingly, acute daidzein dose-dependently modified feeding, as acute treatment with daidzein (5 mg·kg−1) increased the accumulated HFD intake, whereas a significant intake reduction was observed using 50 mg·kg−1 of daidzein in both STD and HFD, at all the periods analysed in the experiment. This biphasic dose–response effect of daidzein on food intake may be explained as the result of a balance between activated PPARs and ERs, as described for osteogenesis and adipogenesis (Dang and Lowik, 2004). Chronic treatment with daidzein (50 mg·kg−1) reduced body weight, food and calorie intake in both diets. The observed reduction in body weight agrees with other experiments in rodents in which dietary isoflavones significantly decreased body weight and adipose tissue (Michael et al., 2006; Davis et al., 2007; Na et al., 2008; Guo et al., 2009; Kim et al., 2010).
HFDs increase hepatic lipids and adipose tissue, and overweight and obesity can lead to some forms of liver steatosis, mainly due to excessive accumulation of fat in the liver. Here the reversal by daidzein of the increased fat content in the liver produced by the HFD, could indicate a contribution of daidzein in reducing hepatic triglycerides and steatosis. Such effects can induce changes in gene expression profiling, especially of genes involved in adipogenesis or fatty acid β-oxidation. Less hepatic fat accumulation may also improve hepatic insulin resistance.
Consequently, the main objective of this work was to monitor the response of the major genes related to lipid and glucose metabolism, after treatment with daidzein using a STD and a HFD, for the three metabolic tissues: white adipose tissue, liver and skeletal muscle. In adipose tissue, HFD increased gene expression of leptin and the oxidative enzyme ACOX, and decreased that of the lipogenic enzymes ACC and FAS. Comparable effects were found in liver where gene expression of the lipogenic enzymes SCD1 and FAS was decreased and that of ACOX was increased, by HFD. Some of these effects were confirmed after the analysis of SCD1 and FAS protein expression by immunofluorescence. Therefore, it seems that chronic feeding with the HFD inhibited lipogenesis via a reduction in the expression of FAS, ACC and SCD1, and stimulated fat oxidation via ACOX, along with increased leptin, a hormone that regulates food intake and impedes accumulation of fat in non-adipose tissues. Interestingly, the expression of the cannabinoid CB1 receptors was increased in white adipose tissue which implies a role for the endocannabinoids in these processes; agreeing with previous results (Osei-Hyiaman et al., 2005; Crespillo et al., 2011).
In daidzein-treated, STD-fed rats, we again observed decreased ACC expression in white adipose tissue. Consistent with this, the lipogenic enzymes SCD1 and FAS in liver were also reduced after treatment with the isoflavone and this finding agrees with other work in which FAS mRNA expression was lowered after soy feeding (Nagasawa et al., 2003; Ascencio et al., 2004) and with results from recent similar work (Kim et al., 2010), pointing out that daidzein might alleviate liver steatosis directly, through the transcriptional control of hepatic lipogenesis and fatty acid β-oxidation. The same combination of STD/daidzein decreased the nuclear receptors PPARα and PPARγ in skeletal muscle. Genistein and daidzein bind directly to both PPARα and PPARγ and these effects on the PPARs could be tissue specific. In mouse skeletal muscle, some studies have associated activation of PPARs with AMP-activated kinase and with improvement in lipid and glucose signalling (Cederroth et al., 2008; Ronis et al., 2009). AMP-activated kinase modulates the activities of transcription factors and co-activators, resulting in either activation or repression of specific genes (Woods et al., 2000). In another study, dietary soy improved insulin sensitivity by increasing glucose uptake in skeletal muscle (Cederroth and Nef, 2009). Whichever pathway is involved, daidzein clearly has an effect on oxidative metabolism in skeletal muscle and our study confirms such effects in animals fed with the STD.
In daidzein-treated, HFD-fed rats, we found changes in some of the genes studied in adipose tissue. The hormones adiponectin and leptin and, particularly, the oxidative enzyme ACOX were reduced. Interestingly, analysing treatment effect, the expression of PPARα and PPARγ were also reduced in liver, together with a reduction in SCD1 levels. However, no significant changes were observed in the skeletal muscle in any of the genes studied. Once again, these results point to a possible inhibition of the lipogenic pathways in liver and white adipose tissue.
Clearly, excess of fat consumption after chronic feeding with HFD can influence adipogenesis (Rosen, 2005). Adipogenesis is regulated by the cooperative interaction of various hormones and nuclear receptors, including PPARγ, modulating the pattern of gene expression and lipid content in fat cells (Harp, 2004; Kota et al., 2005). Recent studies suggested that the effects of isoflavone feeding on insulin sensitivity and lipid homeostasis might also involve, among other factors, altered signalling in the liver through PPARα and PPARγ (Ascencio et al., 2004; Shukla et al., 2007).
Furthermore, daidzein can activate ERs as well as PPARα, and PPARγ (Dang and Lowik, 2004). A complex balance between activated ERs and PPARs could be an important mechanism in determining the biological effects of isoflavones, such as daidzein and genistein (Dang and Lowik, 2004). In this respect, ERs are expressed in muscle and various other cell types, apart from adipocytes, and the properties of the adipose ER varies with the depot and with different physiological states (Rosen, 2005; Barros et al., 2006).
Several studies have suggested a role for PPARα in UCP1 expression (Barbera et al., 2001). In addition, PPARγ acts in brown adipose tissue up-regulating the expression of UCP1, leading to thermogenesis. In terms of the effects of daidzein on thermogenesis, our results would indicate that daidzein treatment in our rats caused an important increase of UCP1 protein expression in brown adipose tissue, suggesting that this isoflavone could regulate uncoupling of ATP production, as a mechanism to deplete energy depots (Xue et al., 2005).
Feeding with soy protein can produce changes in hormone levels (Guo et al., 2009; Ronis et al., 2009) and in our experiments, the levels of adiponectin and leptin in plasma were clearly affected by treatment with daidzein (50 mg·kg−1), with opposite effects on each, results identical to those of Kim et al. (2010) measuring leptin and adiponectin in mouse serum. Leptin also mediates specific metabolic effects, including potent depletion of triglycerides from liver and other peripheral tissues. Identification and ranking of genes specifically repressed by leptin showed that SCD1 was at the top of this list and it was specifically repressed during leptin-mediated weight loss (Cohen et al., 2003). However, whether such effects of daidzein were due to changes in the adipose tissue physiology caused by the weight loss (both adiponectin and leptin are adipocyte-derived hormone playing a pivotal role in regulating food intake and energy expenditure) (Jiang et al., 2005), or due to the hormone-like effects exerted by daidzein after activation of ERs, is still to be determined.
Finally, treatment with daidzein showed a significant reduction in triglycerides and cholesterol levels in plasma. As stated above, HFD and excessive fat accumulation affects the liver, the primary organ regulating metabolism and serum composition as most of the fatty acids and cholesterol from food are processed here before they reach other tissues. Guo et al. (2009) found that free fatty acid (FFA) concentration in both plasma and liver was significantly reduced by daidzein indicating that daidzein might influence the elimination of FFAs by mechanisms involving FFA oxidation in the liver and muscle. These results support the use of isoflavones as a nutritional supplement for reducing liver fat in non-alcoholic steatohepatitis. In any case, high-fat feeding can also produce adipocyte hypertrophy and hyperplasia for extra storage (García-Serrano et al., 2011), which might alter the compensatory effects of daidzein, indicating that not only daidzein but also restriction of fat in the diet had to be implemented for this purpose. In addition, the action of isoflavones on PPARγ can also influence adipocyte differentiation and tissue lipid accumulation, affecting also triglyceride levels in plasma.
In conclusion, our results suggest that daidzein treatment can significantly reduce body weight in rats and also ameliorate the HFD-induced hyperlipidaemia, which can partially explain the anti-steatotic, cholesterol-lowering and insulin-sensitizing effects of soy, confirming previous results with isoflavones (Nagasawa et al., 2003; Shukla et al., 2007; Kim et al., 2010). This general physiological effect shows a complex interaction of many different factors through various possible interrelated pathways, but with a particular role for the inhibition of lipogenesis, involving PPARγ and the enzyme SCD1. The size of the effect may vary depending on the physiology of the subjects (rat strains, altered leptin/endocannabinoid signalling) as well as the different procedures used (routes of administration) which could be crucial for their physiological functions. Such diversity of actions of isoflavones supports the proposal that their consumption is, overall, beneficial. However, further investigation is needed to evaluate the long-term effects of isoflavones on obesity, type 2 diabetes and its associated disorders, and to assess whether the same mechanisms exist in humans.
Glossary
Abbreviations
- ACC
acyl-CoA carboxylase
- ACOX
acyl-CoA oxidase
- AdipoR1/AdipoR2
adiponectin receptor 1 and 2
- ALT
alanine aminotransferase
- AST
aspartate aminotransferase
- FAS
fatty acid synthase
- GGT
γ-glutamyltranspeptidase
- HDL
high-density lipoprotein
- HFD
high-fat diet
- LDL
low-density lipoprotein
- Rpl19
ribosomal protein 19
- SCD1
stearoyl-CoA desaturase 1
- Sp1
Sp1 transcription factor
- STD
standard/low-fat diet
Funding
This work is supported by the seventh Framework Programme of European Union (grant number HEALTH-F2-2008-223713, REPROBESITY); Instituto de Salud Carlos III del Ministerio de Ciencia e Innovación (grant numbers PI07/1226, PI07/0953, PI07/0880, SAF2010-19087 and SAF 2010–20521); Instituto de Salud Carlos III del Ministerio de Ciencia e Innovación, UE-ERDF, Red de Trastornos Adictivos (grant number RD06/0001); Instituto de Salud Carlos III del Ministerio de Ciencia e Innovación, UE-ERDF, CIBER OBN; Consejería de Economía, Innovación y Ciencia de la Junta de Andalucía, UE/ERDF (grant numbers CTS-433, CVI-1038 and P07-CVI-03079); Consejería de salud de la Junta de Andalucía (grant numbers PI0232/2008 and PI0029/2008). F. J. B. S. is recipient of ‘Miguel Servet’ research contracts from the National System of Health (Instituto de Salud Carlos III, grant number CD07/00283). J. S. is recipient of a ‘Sara Borrell’ postdoctoral contract from the National System of Health (Instituto de Salud Carlos III, grant number CD08/00203).
Conflicts of interest
There is no conflict of interest reported to this article.
Supporting information
Additional Supporting Information may be found in the online version of this article:
Figure S1 Chemical structure of daidzein (isoflavone), present in Glycine max (soybean), 17β-estradiol (estradiol), Δ9-tetrahydrocannabinol (THC), the main cannabinoid receptor agonist present in Cannabis preparations, and AM251, a synthetic CB1 cannabinoid receptor inverse agonist.
Figure S2 Experimental design used for diet-induced obesity and daidzein administration.
Figure S3 Effect of a standard/low-fat diet (STD) and a very high-fat diet (HFD) on accumulated food/caloric intake and body weight gain during 10 weeks. We observed that rats fed with STD accumulated more food intake than rats fed with an HFD (A), in contrast with the accumulated caloric intake (B), and this difference was statistically significant. Body weight gain showed a significant divergence in HFD rats in comparison with STD rats from the eighth week on (C). When body weight gain stabilized over time (at least, for 10 weeks), daidzein was administrated, while the diets remained unchanged. Histograms represent the mean ± SEM (16 animals per diet group). Two-way anova followed by Bonferroni post test: *P < 0.05, **P < 0.01, ***P < 0.001 versus STD rats. Diet effects are summarized in Table S3.
Table S1 Composition of the two diets used to induce obesity in the rats: standard/low-fat diet and high-fat diet
Table S2 Primer sequences used for real-time PCR
Table S3 Summary of the effects produced by diet, treatment and interaction on each parameter analysed1
Appendix S1 Immunohistochemistry and immunofluorescence.
Please note: Wiley-Blackwell are not responsible for the content or functionality of any supporting materials supplied by the authors. Any queries (other than missing material) should be directed to the corresponding author for the article.
References
- Alexander SPH, Mathie A, Peters JA. Guide to Receptors and Channels (GRAC), 4th edn. Br J Pharmacol. 2009;158(Suppl 1):S1–S254. doi: 10.1111/j.1476-5381.2009.00499.x. [DOI] [PMC free article] [PubMed] [Google Scholar]
- Ascencio C, Torres N, Isoard-Acosta F, Gómez-Pérez FJ, Hernandez-Pando R, Tovar AR. Soy protein affects serum insulin and hepatic SREBP-1 mRNA and reduces fatty liver in rats. J Nutr. 2004;134:522–529. doi: 10.1093/jn/134.3.522. [DOI] [PubMed] [Google Scholar]
- Barbera MJ, Schluter A, Pedraza N, Iglesias R, Villarroya F, Giralt M. Peroxisome proliferator-activated receptor alpha activates transcription of the brown fat uncoupling protein-1 gene. A link between regulation of the thermogenic and lipid oxidation pathways in the brown fat cell. J Biol Chem. 2001;276:1486–1493. doi: 10.1074/jbc.M006246200. [DOI] [PubMed] [Google Scholar]
- Barros RP, Machado UF, Warner M, Gustafsson JA. Muscle GLUT4 regulation by estrogen receptors ERbeta and ERalpha. Proc Natl Acad Sci U S A. 2006;103:1605–1608. doi: 10.1073/pnas.0510391103. [DOI] [PMC free article] [PubMed] [Google Scholar]
- Bathena SJ. Dietary fatty acids and fatty acid metabolism in diabetes. In: Chow CK, editor. Fatty Acids in Foods and Their Health Implications. 2nd edn. New York: Marcel Dekker; 2000. pp. 915–961. [Google Scholar]
- Bhathena SJ, Velasquez MT. Beneficial role of dietary phytoestrogens in obesity and diabetes. Am J Clin Nutr. 2002;76:1191–1201. doi: 10.1093/ajcn/76.6.1191. [DOI] [PubMed] [Google Scholar]
- Cassidy A, Hooper L. Phytoestrogens and cardiovascular disease. J Br Menopause Soc. 2006;12:49–56. doi: 10.1258/136218006777525776. [DOI] [PubMed] [Google Scholar]
- Cederroth CR, Nef S. Soy, phytoestrogens and metabolism: a review. Mol Cell Endocrinol. 2009;304:30–42. doi: 10.1016/j.mce.2009.02.027. [DOI] [PubMed] [Google Scholar]
- Cederroth CR, Vinciguerra M, Gjinovci A, Kuhne F, Klein M, Cerderroth M, et al. Dietary phytoestrogens activate AMP-activated protein kinase with improvement in lipid and glucose metabolism. Diabetes. 2008;57:1176–1185. doi: 10.2337/db07-0630. [DOI] [PubMed] [Google Scholar]
- Clair RS, Anthony M. Soy, isoflavones and atherosclerosis. Handb Exp Pharmacol. 2005;170:301–323. doi: 10.1007/3-540-27661-0_10. [DOI] [PubMed] [Google Scholar]
- Clarkson TB. Soy, soy phytoestrogens and cardiovascular disease. J Nutr. 2002;132:566S–569S. doi: 10.1093/jn/132.3.566S. [DOI] [PubMed] [Google Scholar]
- Cohen P, Ntambi JM, Friedman JM. Stearoyl-CoA desaturase-1 and the metabolic syndrome. Curr Drug Targets Immune Endocr Metabol Disord. 2003;3:271–280. doi: 10.2174/1568008033340117. [DOI] [PubMed] [Google Scholar]
- Cooke PS, Naaz A. Role of estrogens in adipocyte development and function. Exp Biol Med. 2004;229:1127–1135. doi: 10.1177/153537020422901107. [DOI] [PubMed] [Google Scholar]
- Crespillo A, Suárez J, Bermúdez-Silva FJ, Rivera P, Vida M, Alonso M, et al. Expression of cannabinoid system in muscle: effects of high fat diet and CB1 receptor blockade. Biochem J. 2011;433:175–185. doi: 10.1042/BJ20100751. [DOI] [PubMed] [Google Scholar]
- Dang Z, Lowik CW. The balance between concurrent activation of ERs and PPARs determines daidzein-induced osteogenesis and adipogenesis. J Bone Miner Res. 2004;19:853–861. doi: 10.1359/JBMR.040120. [DOI] [PubMed] [Google Scholar]
- Davis J, Higginbotham A, O'Connor T, Moustaid-Moussa N, Tebbe A, Kim YC, et al. Soy protein and isoflavones influence adiposity and development of metabolic syndrome in obese male ZDF rat. Ann Nutr Metab. 2007;51:42–52. doi: 10.1159/000100820. [DOI] [PubMed] [Google Scholar]
- Dobrzyn P, Dobrzyn A, Miyazaki M, Cohen P, Asilmz E, Hardie G, et al. Stearoyl-CoA desaturase 1 deficiency increases fatty acid oxidation by activating AMP-activated protein kinase in liver. Prot Natl Acad Sci U S A. 2004;101:6409–6414. doi: 10.1073/pnas.0401627101. [DOI] [PMC free article] [PubMed] [Google Scholar]
- Evans RM, Barish GD, Wang Y. PPARs and the complex journey to obesity. Nat Med. 2004;10:355–361. doi: 10.1038/nm1025. [DOI] [PubMed] [Google Scholar]
- García-Serrano S, Moreno-Santos I, Garrido-Sánchez L, Gutierrez-Repiso C, García-Almeida JM, García-Arnés J, et al. Stearoyl-CoA desaturase-1 is associated with insulin resistance in morbidly obese subjects. Mol Med. 2011;17:273–280. doi: 10.2119/molmed.2010.00078. [DOI] [PMC free article] [PubMed] [Google Scholar]
- Godsland IF. Oestrogens and insulin secretion. Diabetologia. 2005;48:2213–2220. doi: 10.1007/s00125-005-1930-0. [DOI] [PubMed] [Google Scholar]
- Guo Y, Wu G, Su X, Yang H, Zhang J. Antiobesity action of a daidzein derivative on male obese mice induced by a high-fat diet. Nutr Res. 2009;29:656–663. doi: 10.1016/j.nutres.2009.09.005. [DOI] [PubMed] [Google Scholar]
- Harp JB. New insights into inhibitors of adipogenesis. Curr Opin Lipidol. 2004;15:303–307. doi: 10.1097/00041433-200406000-00010. [DOI] [PubMed] [Google Scholar]
- Jiang G, Li Z, Liu F, Ellsworth K, Dallas-Yang Q, Wu M, et al. Prevention of obesity in mice by antisense oligonucleotide inhibitors of stearoyl-CoA desaturase-1. J Clin Invest. 2005;115:1030–1038. doi: 10.1172/JCI23962. [DOI] [PMC free article] [PubMed] [Google Scholar]
- Kim MH, Park JS, Jung JW, Byun KW, Kang KS, Lee YS. Daidzein supplementation prevents non-alcoholic fatty liver disease through alternation of hepatic gene expression profiles and adipocyte metabolism. Int J Obes. 2010 doi: 10.1038/ijo.2010.256. doi: 10.1038/ijo.2010.256 [Epub ahead of print] [DOI] [PubMed] [Google Scholar]
- Kopelman PG. Obesity as a medical problem. Nature. 2000;404:635–643. doi: 10.1038/35007508. [DOI] [PubMed] [Google Scholar]
- Kota BP, Huang TH, Roufogalis BD. An overview on biological mechanisms of PPARs. Pharmacol Res. 2005;51:85–94. doi: 10.1016/j.phrs.2004.07.012. [DOI] [PubMed] [Google Scholar]
- Kuiper GG, Lemmen JG, Carlsson B, Corton JC, Safe SH, van der Saag PT, et al. Interaction of estrogenic chemicals and phytoestrogens with estrogen receptor β. Endocrinology. 1998;139:4252–4263. doi: 10.1210/endo.139.10.6216. [DOI] [PubMed] [Google Scholar]
- Le May C, Chu K, Hu M, Ortega CS, Simpson ER, Korach KS, et al. Estrogens protects pancreatic beta-cells from apoptosis and prevent insulin-deficient diabetes mellitus in mice. Proc Natl Acad Sci U S A. 2006;103:9232–9237. doi: 10.1073/pnas.0602956103. [DOI] [PMC free article] [PubMed] [Google Scholar]
- Liu S, Mauvais-Jarvis F. Estrogenic protection of beta-cell failure in metabolic diseases. Endocrinology. 2010;151:850–864. doi: 10.1210/en.2009-1107. [DOI] [PMC free article] [PubMed] [Google Scholar]
- Messina M, Gardner C, Barnes S. Gaining insight into the health effects of soy but a long way still to go: commentary on the fourth International Symposium on the Role of Soy in Preventing and Treating Chronic Disease. J Nutr. 2002;132:547S–551S. doi: 10.1093/jn/132.3.547S. [DOI] [PubMed] [Google Scholar]
- Mezei O, Banz WJ, Steger RW, Peluso MR, Winster TA, Shay N. Soy isoflavones exert antidiabetic and hypolipidemic effects through the PPAR pathway in obese Zucker rats and murine RAW 264.7 cells. J Nutr. 2003;133:1238–1243. doi: 10.1093/jn/133.5.1238. [DOI] [PubMed] [Google Scholar]
- Mezei O, Li Y, Mullen E, Ross-Viola JS, Shay NF. Dietary isoflavone supplementation modulates lipid metabolism via PPARalpha-dependent and – independent mechanisms. Physiol Genomics. 2006;26:8–14. doi: 10.1152/physiolgenomics.00155.2005. [DOI] [PubMed] [Google Scholar]
- Michael MR, Wolz E, Davidovich A, Pfannkuch F, Edwards JA, Bausch J. Acute, subchronic and chronic safety studies with genistein in rats. Food Chem Toxicol. 2006;44:56–80. doi: 10.1016/j.fct.2005.05.021. [DOI] [PubMed] [Google Scholar]
- Mullen E, Brown RM, Osborne TF, Shay NF. Soy isoflavones affect sterol regulatory element binding proteins (SREBPs) and SREBP regulated genes in HepG2 cells. J Nutr. 2004;34:2942–2947. doi: 10.1093/jn/134.11.2942. [DOI] [PubMed] [Google Scholar]
- Na XL, Ezaki J, Sugiyama F, Cui HB, Ishimi Y. Isoflavone regulates lipid metabolism via expression of related genes in OVX rats fed on a high-fat. Diet. 2008;21:357–364. doi: 10.1016/S0895-3988(08)60055-0. [DOI] [PubMed] [Google Scholar]
- Nagasawa A, Fukui K, Kojima M, Kishida K, Maeda N, Nagaretani H, et al. Divergent effects of soy protein diet on the expression of adipocytokines. Biochem Biophys Res Commun. 2003;311:909–914. doi: 10.1016/j.bbrc.2003.10.087. [DOI] [PubMed] [Google Scholar]
- Osei-Hyiaman D, DePetrilllo M, Parcher P, Liu J, Radaeva S, Bátkai S, et al. Endocannabinoid activation at hepatic CB(1) receptors stimulates fatty acid synthesis and contributes to diet-induced-obesity. J Clin Invest. 2005;115:1298–1305. doi: 10.1172/JCI23057. [DOI] [PMC free article] [PubMed] [Google Scholar]
- Piomelli D. The molecular logic of endocannabinoid signaling. Nat Rev Neurosci. 2003;4:873–884. doi: 10.1038/nrn1247. [DOI] [PubMed] [Google Scholar]
- Ronis MJ, Chen Y, Badeaux J, Badger T. Dietary soy protein isolate attenuates metabolic syndrome in rats via effects on PPAR, LXR, and SREBP signaling. J Nutr. 2009;139:1431–1438. doi: 10.3945/jn.109.107029. [DOI] [PubMed] [Google Scholar]
- Rosen ED. The transcriptional basis of adipocytes development. Prostaglandins Leukot Essent Fatty Acids. 2005;73:31–34. doi: 10.1016/j.plefa.2005.04.004. [DOI] [PubMed] [Google Scholar]
- Severson RK, Nomura AM, Grove JS, Stemmermann GN. A prospective study of demographics, diet, and prostate cancer among men of Japanese ancestry in Hawaii. Cancer Res. 1989;49:1857–1860. [PubMed] [Google Scholar]
- Shen P, Liu MH, Ng TY, Chan YH, Yong EL. Differential effects of isoflavones, from Astragalus membranaceus and Pueraria thomsonii, on the activation of PPARalpha, PPARgamma, and adipocyte differentiation in vitro. J Nutr. 2006;136:899–905. doi: 10.1093/jn/136.4.899. [DOI] [PubMed] [Google Scholar]
- Shin ES, Lee HH, Cho SY, Park HW, Lee SJ, Lee TR. Genistein downregulates SREBP-1 regulated gene expression by inhibiting Site 1 Protease expression in HepG2 cells. J Nutr. 2007;137:1127–1131. doi: 10.1093/jn/137.5.1127. [DOI] [PubMed] [Google Scholar]
- Shukla A, Brandsch C, Bettzieche A, Hirche F, Stangl GI, Eder K. Isoflavone-poor soy protein alters the lipid metabolism of rats by SREBP-mediated down-regulation of hepatic genes. J Nutr Biochem. 2007;18:313–321. doi: 10.1016/j.jnutbio.2006.05.007. [DOI] [PubMed] [Google Scholar]
- Taku K, Umegaki K, Sato Y, Taki Y, Endoh K, Watanabe S. Soy isoflavones lower serum total and LDL cholesterol in humans: a meta-analysis of 11 randomized controlled trials. Am J Clin Nutr. 2007;85:1148–1156. doi: 10.1093/ajcn/85.4.1148. [DOI] [PubMed] [Google Scholar]
- Tham DM, Gardner CD, Haskell WL. Potential health benefits of dietary phytoestrogens: a review of the clinical, epidemiological, and mechanistic evidence. J Clin Endocrinol Metab. 1998;83:2223–2235. doi: 10.1210/jcem.83.7.4752. [DOI] [PubMed] [Google Scholar]
- Vedavanam K, Srijayanta S, O'Reilly J, Raman A, Wiseman H. Antioxidant action and potential antidiabetic properties of an isoflavonoid-containing soyabean phytochemical extract (SPE) Phytother Res. 1999;13:601–608. doi: 10.1002/(sici)1099-1573(199911)13:7<601::aid-ptr550>3.0.co;2-o. [DOI] [PubMed] [Google Scholar]
- Woods A, Azzout-Marniche D, Foretz M, Stein SC, Lemarchand P, Ferre P, et al. Characterization of the role of AMP-activated protein kinase in the regulation of glucose-activated gene expression using constitutively active and dominant negative forms of the kinase. Mol Cell Biol. 2000;20:6704–6711. doi: 10.1128/mcb.20.18.6704-6711.2000. [DOI] [PMC free article] [PubMed] [Google Scholar]
- Xue B, Coulter A, Rim JS, Koza RA, Kozak LP. Transcriptional synergy and the regulation of Ucp1 during brown adipocyte induction in white fat depots. Mol Cell Biol. 2005;25:8311–8322. doi: 10.1128/MCB.25.18.8311-8322.2005. [DOI] [PMC free article] [PubMed] [Google Scholar]
- Zhan S, Ho SC. Meta-analysis of the effects of soy protein containing isoflavones on the lipid profile. Am J Clin Nutr. 2005;81:397–408. doi: 10.1093/ajcn.81.2.397. [DOI] [PubMed] [Google Scholar]
- Zhang C, Ho SC, Lin F, Cheng S, Fu J, Chen Y. Soy product and isoflavone intake and breast cancer risk defined by hormone receptor status. Cancer Sci. 2010;101:501–507. doi: 10.1111/j.1349-7006.2009.01376.x. [DOI] [PMC free article] [PubMed] [Google Scholar]
- Zhu BT, Han GZ, Shim JY, Wen Y, Jiang XR. Quantitative structure-activity relationship (QSAR) of various endogenous estrogen metabolites for human estrogen receptor alpha and beta subtypes: insight into the structural determinants favoring a differential subtype binding. Endocrinology. 2006;147:4132–4150. doi: 10.1210/en.2006-0113. [DOI] [PubMed] [Google Scholar]
- Zhuo XG, Melby MK, Watanabe S. Soy isoflavone intake lowers serum LDL cholesterol: a meta-analysis of 8 randomized controlled trials in humans. J Nutr. 2004;134:2395–2400. doi: 10.1093/jn/134.9.2395. [DOI] [PubMed] [Google Scholar]
Associated Data
This section collects any data citations, data availability statements, or supplementary materials included in this article.