

Abstract
Down syndrome (DS) results from inheritance of three copies of human chromosome 21 (Hsa21). Individuals with DS have a significantly smaller brain size overall and a disproportionately small cerebellum. The small cerebellum is seen in Ts65Dn mice, which have segmental trisomy for orthologs of about half the genes on Hsa21 and provide a genetic model for DS. While small cerebellar size is wellestablished in mouse and humans, much less is known about the shape of the brain in trisomy. Here we conduct a morphometric analysis of the whole brain and cerebellum in Ts65Dn mice and show that the differences with euploid littermates are largely a function of volume and not of shape. This is not the case in two aneuploid mouse models that have fewer genes orthologous to Hsa21 than Ts65Dn. Ts1Rhr is trisomic for genes corresponding to the so-called Down syndrome critical region (DSCR), which was purported to contain a dosage sensitive gene or genes responsible for many phenotypes of DS. Ms1Rhr is monosomic for the same segment. These models show effects on cerebellum and overall brain that are different from each other and from Ts65Dn. These models can help to identify the contributions of genes from different regions of the chromosome on this and other aspects of brain development in trisomy.
Keywords: Down syndrome, trisomy 21, aneuploidy, brain, shape, landmarks, Down syndrome critical region, mouse, cerebellum
Introduction
Trisomy of human chromosome 21 (Hsa21) results in Down syndrome (DS) which is the most common autosomal aneuploidy in liveborn infants, occurring in 1 in 733 live births [Canfield et al., 2006]. Individuals with DS express varying subsets of the phenotypes that characterize the syndrome, but some traits occur to varying degrees in all individuals with trisomy 21. Among the findings that are consistently present in DS are reduced stature [Kurjak and Kirkinen, 1982; Cronk et al., 1988; Arnell et al., 1996; Myrelid et al., 2002], changes in brain volume, especially of the cerebellum [Crome et al., 1966; Benda, 1971; Weis et al., 1991; Aylward et al., 1997; Pinter et al., 2001; White et al., 2003], and varying degrees of cognitive deficits, especially in tasks involving forebrain and hippocampus [e.g., Coyle et al., 1988; Epstein, 1989; Pennington et al., 2003]. It is unclear how triplication of the genes located on Chr21 causes phenotypes observed in DS. The “amplified developmental instability” hypothesis states that trisomy causes small changes in the expression of hundreds of genes which destabilizes a few key developmental genetic pathways, resulting in similar phenotypic outcomes regardless of what specific genes are up-regulated [Hall, 1965; Shapiro, 1997]. Alternatively, the “gene-dosage effects” hypothesis holds that effects of a specific gene or group of Hsa21 genes is responsible for specific DS phenotypes [Kola and Pritchard, 1999]. As noted by Reeves et al. [2001], these hypotheses are not mutually exclusive. More importantly, testing these semantic distinctions as null hypotheses does little to elucidate the genotype-phenotype interaction responsible for the pathogenesis of features in aneuploidy.
The “Down syndrome critical region” (DSCR) is a segment of Hsa21 containing about 33 genes that was hypothesized to be responsible for a subset of DS traits, including craniofacial and cognitive phenotypes [Delabar et al., 1993; Korenberg et al., 1994]. This concept was based on qualitative studies of a small group of the rare individuals with segmental trisomy for only part of Hsa21. Individuals who shared a given anomaly of DS were assessed genetically to define the smallest region of Hsa21 overlap among their segmental trisomies. The DSCR was coined to describe the smallest region of overlap of segments of Hsa21 at dosage imbalance among individuals who shared a given DS phenotype. The best-defined DSCR was thought to hold the molecular underpinnings of DS craniofacial phenotypes. However, chromosome engineering in mice to create segmental trisomy for only the DSCR showed that these genes are not sufficient and are largely not necessary to produce several defects attributed to the DSCR, including short stature and anomalies of the craniofacial skeleton [Olson et al., 2004a].
To date, phenotypic studies of the brain in humans with DS and in aneuploid mice have included qualitative descriptions of particular traits [e.g., Benda, 1971; Crome and Stern, 1972; Kemper, 1988; Becker et al., 1993; Davisson et al., 1993; Reeves et al., 1995; Holtzman et al., 1996], quantitative characterization of overall brain size [Baxter et al., 2000; Crome et al., 1966; Schapiro et al., 1987; Olson et al., 2004a], as well as size of particular brain regions [Wisniewski, 1990; Kesslak et al., 1994; Insausti et al., 1998; Krasuski et al., 2002; Teipel et al., 2003; Olson et al., 2004b], and histological characterization of specific brain structures [Holtzman et al., 1996; Insausti et al., 1998; Baxter et al., 2000; O'Doherty et al., 2005; Lorenzi and Reeves, 2006; Wisniewski, 1990].
Although differences in overall volume are an important aspect of the brain phenotype, a direct comparison of brain volumes cannot determine whether the difference results from scaling of the entire brain, or from changes in a localized region. The brain is a complex structure in which different parts serve different functions and arise from distinct cell populations across different temporal windows of development. The precise coordination of neurogenesis, growth, and development of each brain component is controlled by precisely localized patterns of gene expression [e.g., Abrous et al., 2005; Lukaszewicz et al., 2006]. Since the size and shape of brain components are dependent on the production of different neural cells, changes in early morphogenesis of a specific region can create a localized change in volume, resulting in associated displacement of nearby structures, together producing localized and global differences in shape. Still, change in overall brain volume and brain shape are not necessarily correlated, suggesting that size and shape phenotypes provide complementary information about the brain's developmental history [Aldridge et al., 2002].
Since gene expression patterns are regionally unique, distinguishing between localized changes in a phenotype and those affecting the entire brain is key to understanding the particular developmental perturbations that result from aneuploidy. Pairing precise, localized measures of the phenotype and knowledge of the specific genes at dosage imbalance with expanding knowledge of the molecular cascades involved in brain development will help to identify the correspondence of genotype with specific phenotypes.
In this study, we compare brain volume and shape phenotypes of two mouse models with segmental trisomy for genes orthologous to Hsa21. The Ts65Dn trisomic mouse [Davisson et al., 1993] has a large segment of mouse chromosome 16 (Mmu16) at dosage imbalance corresponding to a region of Hsa21 that contains about 104 of the 247 genes in the human Hsa21 catalogue (Fig. 1). Phenotypic characteristics parallel those observed in DS, including specific alterations to the craniofacial skeleton [Richtsmeier et al., 2000] and reduced volume of the cerebellum [Baxter et al., 2000; Roper et al., 2006] and hippocampus [Insausti et al., 1998; Lorenzi and Reeves, 2006], as well as defective hippocampal function [Escorihuela et al., 1995; Sago et al., 1998; Hyde et al., 2001; Reeves et al., 2001] in Ts65Dn mice.
Fig. 1.

Representation of the segment of genes at dosage imbalance in human trisomy 21 (Down syndrome), and in three aneuploid mouse models: Ts65Dn, Ts1Rhr, and Ms1Rhr. The horizontally stippled segment corresponds with the Down syndrome critical region (DSCR). Gene number represents number of conserved Hsa21-Mmu16 genes (Gardiner et al., 2003).
The Ts1Rhr mouse is trisomic for the ca 30 genes orthologous to those found in the DSCR on Hsa21 [Olson et al., 2004a] (Fig. 1). In contrast to Ts65Dn mice, alterations in body size and skull morphology in Ts1Rhr mice are different than characteristics documented in DS [Olson et al., 2004a], showing that triplication of only the genes in the DSCR is not sufficient to produce the small stature and distinctive facial changes characteristic of DS [Olson et al., 2004a]. Brain phenotypes have not yet been investigated in Ts1Rhr.
The goal of this study is to characterize the size and shape of the brain in Ts65Dn and Ts1Rhr trisomic mice as compared to their euploid counterparts using high-resolution magnetic resonance images (HR-MRIs). This study represents the first investigation to describe brain shape in mouse models of DS. We also provide brain size and shape statistics for Ms1Rhr mice that are monosomic for the genes in the DSCR. Overall, we find that each of the aneuploid mice displays a unique brain phenotype compared to their euploid counterpart and to each other.
Materials and Methods
Animal Husbandry
Ts65Dn cannot be inbred and instead is maintained as an advanced intercross, (B6 × C3)F1. Thus, phenotypes that appear in these mice are robust and not merely a function of a fortuitous combination of alleles in a specific inbred line. Trisomic B6EiC3Sn a/A-T(16C3-4;17A2)65Dn/J (Ts65Dn mice) [Davisson et al., 1993] females acquired from Jackson Laboratory were crossed with (B6J × C3HeJ)F1 male mice to produce six euploid and six trisomic progeny. Ploidy was determined by FISH analysis of cultured peripheral lymphocytes [Moore et al., 1999]. Dp (16Cbr1-ORF9)1Rhr (Ts1Rhr herein) and Del(16Cbr1-ORF9)1Rhr (Ms1Rhr herein) which have segmental trisomy or monosomy, respectively, for the Mmu16 region orthologous to the Hsa21 DSCR were created by chromosome engineering to contain a reciprocal duplication/deletion in ES cells derived from 129S6 strain mice as described (Olson et al., 2004a). Founder chimeras were mated to B6 mice and (B6.129S6)F1 offspring carrying the duplication or deletion were crossed to (B6J × C3HeJ)F1 mice. Thus the genetic background of the euploid (N = 10), trisomic Ts1Rhr (N = 8), and monosomic Ms1Rhr (N = 6) analyzed here was, on average, 50% B6, 25% C3H, and 25% 129S6.
At approximately 12 weeks of age, mice were deeply anesthetized with methoxyfluorane (Metofane), and perfused intra-cardially with 30 ml of phosphate-buffered saline (PBS) with heparin (50 U/ml) 4°C, followed by perfusion with 30 ml of ice-cold 4% paraformaldehyde in phosphate buffer. The head was removed and post-fixed overnight in 4% paraformaldehyde at 4°C. The brain was removed from the skull the following day and fixative was cleared from the brain by serial washes in PBS over several days. Fixed brains were stored in PBS at 4°C.
Body weights were obtained for Ts1Rhr and euploid controls at the time of sacrifice. Individual body weights are not available for the Ts65Dn mice and their euploid sibs used in this study; instead, previously published mean body weight data for a large sample of Ts65Dn mice and their euploid littermates were used as a surrogate [Roper et al., 2006].
High Resolution Magnetic Resonance Image Acquisition
Images were obtained in the Department of Radiology at the Johns Hopkins University School of Medicine as described [Baxter et al., 2000; Olson et al., 2004b] using a 400 MHz General Electric Omega nuclear magnetic resonance spectrometer interfaced to a 9.4 T/89 mm vertical bore magnet equipped with Accustar actively shielded gradients capable of developing gradient strengths up to 1,400 mT/m. A three-dimensional spin echo imaging sequence with an echo time of 32 msec and a recycle delay of 1 sec was employed. The radio frequency (RF) probe consisted of a cylindrical loop gap resonator (dimensions: 16 mm length, 12 mm diameter) made of copper foil. Adiabatic RF pulses of 1 msec duration were employed for uniform excitation across the sample. Brains were suspended in PBS for analysis, requiring the water signal from the buffer to be minimized through application of diffusion gradients symmetrically on both sides of the re-focusing pulse (200 mT/m for 3 msec along x and z directions). Data matrix size for the Ts65Dn mice was 128 × 128 × 64, with a field of view 16 mm × 16 mm × 8 mm, yielding isotropic pixel resolution of 125 μm. Data matrix size for the Ts1Rhr mice was 512 × 331 × 301, and the corresponding field of view was 17 mm × 11 mm × 10 mm, yielding isotropic pixel resolution of 33 μm.
Volume Phenotypes: Volumetric Data Collection and Statistical Comparison
Overall brain volume and volume of the cerebellum were estimated from the HR-MRIs using Amira software. Amira® allows the user to select a region-of-interest (ROI) from which the volume (mm3) is calculated. The user manually defines voxels to be included in each ROI, in our case overall brain and cerebellum. Amira® then calculates volume of each ROI by multiplying the number of voxels included in the ROI by the voxel resolution of the image data. The ROI selected to represent overall brain volume included the cerebral hemispheres, the midbrain, cerebellum, and brainstem to the level of the posteroinferior limit of the cerebellum and excluded the paraflocculi, olfactory bulbs, and lower brainstem. The ROI selected to represent cerebellar volume included the flocculi and vermis, but did not include the paraflocculi or brainstem. Volume data were collected from each specimen twice and the average of the two trials was used in analysis.
Overall brain volume, overall brain volume excluding the cerebellum, cerebellum volume, and the ratio of cerebellum volume to overall brain volume (proportional) were compared between euploid and trisomic mice. Since there is little agreement on the best way to account for differences in body size when comparing brain volume, we compared brain volume between groups before and after adjusting for body size differences using average body weights. Individual body weight data were not available for the Ts65Dn sample. Consequently, we determined whether average body weights available from Roper et al. [2006] could be used as surrogates in analysis by analyzing individual data available for Ts1Rhr and Ms1Rhr and then again using ploidy-specific average data. The results of these analyses were similar. Based on this outcome, and the lack of individual data for Ts65Dn animals we used ploidy-specific average body weights to adjust for body size differences in the results reported here. For example, the volumes for each Ts1Rhr mouse were divided by the average body weight of all Ts1Rhr mice, while the measures for each euploid mouse were divided by the average body weight of all euploid mice for that group (i.e., littermates of Ts65Dn, Ts1Rhr, or Ms1Rhr). Given the potential for large degrees of within-sample variation and the likelihood of small samples in studies like ours, we suggest that individual weights should be used when available.
Shape Phenotypes: Landmark Data Collection and Morphometric Methods
Anatomical landmarks represent biologically meaningful points that can be repeatedly located with a high degree of accuracy and precision [Richtsmeier et al., 1995]. Three-dimensional landmark coordinate data representing landmark locations were collected from the HR-MR images of each mouse using eTDIPS software (http://www.cc.nih.gov/cip/software/etdips/), written for a PC platform. Twenty-nine landmarks (11 bilateral and 7 midline) were defined for internal and surface cerebral, cerebellar, and midbrain structures (Table I, Fig. 2). Precision of landmark data collection was evaluated following previously published protocols [Richtsmeier et al., 1995] which require that the complete suite of 29 landmarks be collected for each of ten mice three times by a single observer, with a minimum of 24 hr elapsing between data collection trials to avoid memory-biased placement. The standard deviation of the placement of every landmark in 3D space was calculated for each mouse along three orthogonal axes and then averaged across mice to produce a measure of the error associated with each landmark along each axis. The mean standard deviation across all ten mice, 29 landmarks, and three axes is 0.077 mm, with the overall error ranging between 0.015 and 0.298 mm, demonstrating that these 29 landmarks can be located reliably and precisely (measurement error data trials available from the authors on request).
Table I. Definitions of 29 Three-Dimensional Landmarks Collected From Each HR-MRI. Landmarks Numbers (Left Side, Right Side) Are Keyed to Figure 2.
| Landmark definition | Surface (S) or internal (I) | Bilateral (B) or midline (M) | Cerebrum (C) or cerebellum (CBM) | |
|---|---|---|---|---|
| 1, 2 | Most superior and lateral point of the intersection of olfactory bulb with anterior frontal lobe | S | B | C |
| 3, 4 | Caudolateral-most point of occipital lobe | S | B | C |
| 5 | Most posterior point on interhemispheric fissure | S | M | C |
| 6, 7 | Centroid of posterior colliculus | I | B | CBM |
| 8 | Midline of cerebellar declive | S | M | CBM |
| 9, 10 | Intersection of Fissurae Intercruralis, Ansoparamediana, and Prima on cerebellar surface | S | B | CBM |
| 11, 12 | Intersection of Fissurae Prepyramidalis and Horizontalis on dorsal surface of cerebellum | S | B | CBM |
| 13, 14 | Most concave point of the intersection of Copula pyramidis with Uvula on surface of cerebellum | S | B | CBM |
| 15 | Most convex point on the midline of cerebellar Uvula | S | M | CBM |
| 16, 17 | Centroid of caudate head | I | B | C |
| 18, 19 | Centroid of thalamus | I | B | C |
| 20, 21 | Branching point of middle cerebral artery into cortical branches | S | B | C |
| 22, 23 | Origin of middle cerebral artery from Circle of Willis on ventral cerebral surface | S | B | C |
| 24 | Genu of corpus callosum at midline | I | M | C |
| 25, 26 | Centroid of septal nucleus | I | B | C |
| 27 | Anterior commissure at midline | I | M | C |
| 28 | Splenium of corpus callosum at midline | I | M | C |
| 29 | Intersection of pons with most caudal aspect of the ventral cerebral surface at midline | S | M | C |
Final three columns refer to the general location and characteristics of the landmark and the analytical subset to which the landmark belongs. Landmarks were analyzed in two subsets: the cerebrum subset (C), and the cerebellum and midbrain subset (CBM). Midbrain structures were analyzed with the cerebellum subset.
Fig. 2.

Three-dimensional landmarks collected from each mouse brain HR-MRI, illustrated on representative 3D surface reconstructions and slice images. Landmark placement in figure is approximate and may be slightly offset from the true location for clarity of presentation (see Table 1 for anatomical definition of landmark placement). Numbers are keyed to landmarks definitions in Table 1. A: Caudal surface 3D reconstruction. B: Transverse slice. C: Near mid-sagittal slice, right side. (Landmarks 17, 19 are located lateral to this plane; 5, 24, 27, 28, 29 are located medial to this plane, but are illustrated here to show their relative location on the sagittal plane.) D: Right lateral surface 3D reconstruction. (Landmarks 23, 29 are located deep to the surface, but are shown on this view for clarity of presentation.)
Once the locations of landmarks were determined to be reliable for study, landmark coordinate data were collected twice for each mouse by the same observer. After checking for gross errors of landmark placement, data from the two trials were averaged to minimize intra-observer error. The landmark coordinate data recorded in eTDIPS were analyzed using Euclidean distance matrix analysis, or EDMA [Lele and Richtsmeier, 2001] to measure differences in shape between euploid and aneuploid mice in each of the three models.
There are several quantitative methods available for the statistical analysis of landmark data in 3D. However, only a limited class of information related to the morphology of an object can be known when landmark data are used [Richtsmeier et al., 2002]. Morphometric methods like Procrustes analysis are based on models that require specific assumptions, some of which exceed what can be known from landmark data. For example, the orientation of an object with reference to other objects in a sample can never be known because this information is not included in landmark data. Consequently, a descriptor of form difference based on orientation is flawed because that information does not arise from evidence within the data, but instead is a product of a chosen orientation scheme. By not including orientation, EDMA enables valid localization of differences in shape to anatomical positions. Strengths and weaknesses of various morphometric methods are discussed by Richtsmeier et al. [2002].
Briefly, EDMA converts 3D coordinate data to a matrix of all possible linear distances between unique pairs of landmarks. Averages of these linear distances are calculated for each sample and statistically compared by calculating ratios of like linear distances from the samples. A ratio of 1.0 for the between-sample comparison of any specific linear distance indicates that the samples are similar for that measure. Across analyses, euploid mice are always placed in the numerator so ratios greater than 1.0 indicate that aneuploid mice are smaller for that measure. Differences in overall shape are estimated by analyzing the linear distances among all landmarks simultaneously and statistically evaluated using a nonparametric test [Lele and Richtsmeier, 2001]. Differences in overall shape were statistically evaluated for two anatomical regions: the cerebral region (consisting of landmarks 1, 2, 3, 4, 5, 16, 17, 18, 19, 20, 21, 22, 23, 24, 25, 26, 27, 28, 29), and the midbrain and cerebellar region (landmarks 6, 7, 8, 9, 10, 11, 12, 13, 14, 15) by testing the null hypothesis of similarity in shape (P ≤0.05) between aneuploid mice and their euploid littermates. In addition, for each linear distance, confidence intervals are estimated (α = 0.10) to statistically evaluate the similarity of individual linear distances (LDs) between samples using a nonparametric bootstrapping algorithm [Lele and Richtsmeier, 1995]. A ratio of 1.0 indicates that the two samples are the same for a particular distance. A null hypothesis of similarity between samples is rejected if the confidence interval does not include 1.0 [Lele and Richtsmeier, 1995]. This test of empirical differences in shape between samples is based on marginal confidence intervals of the bootstrap estimates of the linear distances between unique pairs of landmarks. Bonferonni-type corrections are not needed for these marginal confidence intervals because this approach does not conduct multiple tests of linear distance differences using the same data. Instead, with each bootstrapping step, all measures are estimated for an individual and tested in a high dimensional space where each dimension represents a unique linear distance. We report the low-dimensional projection of these results for each linear distance [see Lele and Richtsmeier, 1995, 2001 for details]. The combination of an overall test for statistical differences in shape and confidence intervals for differences in specific linear distances enables evaluation of gross differences in shape for two anatomical regions, as well as the localization of significant differences to specific brain regions.
Results
Brain Volume
On average, the overall volume of the whole brain and the volume of the brain excluding the cerebellum are not different from euploid in Ts65Dn mice, whereas the volume of the cerebellum as well as the proportion of cerebellar volume to overall brain volume are reduced in Ts65Dn mice (Table II). These results correspond to those of Baxter et al. [2000]. In contrast, Ts1Rhr mice differ from euploid in all four categories with a relatively smaller brain overall. Accordingly, the cerebellar proportion of overall volume, which is significantly reduced in Ts65Dn and in DS, is the same as euploid in Ts1Rhr.
Table II. Comparison of Trisomic and Monosomic Brain Volume Measurements (mm3) to their Euploid Counterparts in Ts65Dn, Ts1Rhr, and Ms1Rhr Mice (Values are Presented as Percentage of the Euploid Value).
| Ts65Dn (%) | Ts1Rhr (%) | Ms1Rhr (%) | |
|---|---|---|---|
| Body weight | 94.3 | 117.2* | 81.8* |
| Brain volume data | |||
| Overall brain volume | |||
| Raw | 99.7 | 94.6 | 82.6* |
| Size-adjusted | 105.8 | 80.6* | 101.0 |
| Overall minus cerebellum | |||
| Raw | 102.8 | 94.7 | 82.0* |
| Size-adjusted | 108.3 | 80.7* | 100.3 |
| Cerebellum volume | |||
| Raw | 88.9* | 94.0 | 85.1* |
| Size-adjusted | 94.4 | 80.2* | 104.1 |
| Cerebellum (normalized to whole brain) | |||
| Raw | 87.8* | 99.5 | 104.0 |
| Size-adjusted | 100.2 | 99.3* | 103.7 |
We show by an asterisk those differences in measures that were determined statistically significant by standard t tests. However, sample sizes are small.
Previous studies have shown a significant reduction in body weight of Ts65Dn relative to euploid throughout life; at 12 weeks, Ts65Dn body weight is 94.3% of euploid [Roper et al., 2006]. In contrast, Ts1Rhr mice are larger than their euploid siblings [Olson et al., 2004a]. Ts1Rhr have an increased body size relative to euploid and these mice show the opposite trend in brain size after adjusting for body size, with an overall reduction in brain volume and cerebellar volume. In absolute terms, the Ts65Dn brain overall is not different from euploid, while the larger Ts1Rhr mouse has an absolute brain volume 94.6% that of euploid. As noted, the cerebellum is significantly smaller in Ts65Dn, but about the same size as euploid in Ts1Rhr. Thus, this subset of Ts65Dn triplicated genes has very different effects.
Brain Shape
Ts65Dn cerebral region
Analysis of the cerebral region using 3D morphometric analysis showed a relatively small number of significantly different linear distances (LDs) between Ts65Dn and euploid littermates. Of the 171 LDs in the cerebral subset, 19 LDs (11%) are significantly different in Ts65Dn as compared to euploid mice using the non-parametric confidence interval test (0.95 ≤ α ≥ 1.05), with a mean ratio of 0.99, ranging from 0.91 to 1.09. The height of the cerebrum is significantly increased in Ts65Dn mice (Fig. 3C–F; white lines). LDs describing the height of the posterior cerebrum are increased in Ts65Dn, as are LDs that connect the ventral cerebral surface superiorly with cortical and subcortical landmarks (Fig. 3C–F, white lines). These traits correspond with the localized increased height of the Ts65Dn skull for this region as described previously [Richtsmeier et al., 2000]. Finally, the rostrocaudal length of the cerebrum and mediolateral width of the posterior cerebrum and of the cerebellum are both significantly reduced in Ts65Dn (Fig. 3A,B,D, black lines). These traits are reflected in the reduced breadth of the occiput in the Ts65Dn skull [Richtsmeier et al., 2000].
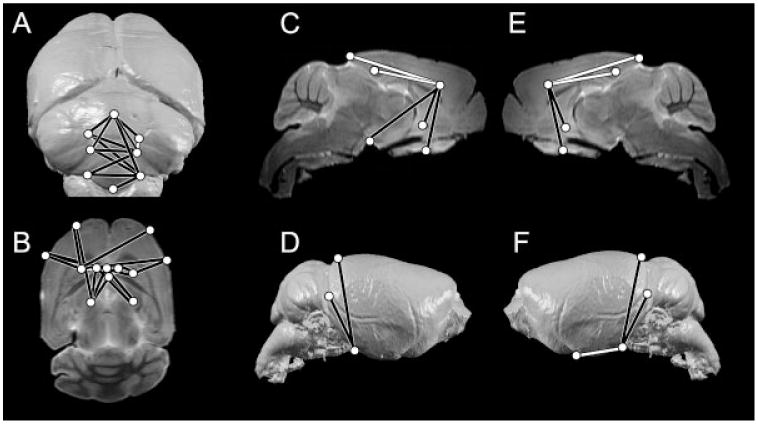
Fig. 3.

LDs that are significantly different by non-parametric confidence interval testing (0.95 ≤ α ≥ 1.05) in Ts65Dn aneuploid mice as compared to euploid littermates illustrated on representative 3D surface reconstructions and slice HR-MR images of a euploid mouse brain. White lines indicate LDs that are significantly increased in Ts65Dn aneuploid mice; black lines are significantly reduced. A: Caudal surface 3D reconstruction. B: Transverse slice. C: Parasagittal slice taken through the brain right of the midline. D: Right lateral surface 3D reconstruction. E: Parasagittal slice taken through the brain left of the midline. F: Left lateral surface 3D reconstruction. Landmarks are defined in Table II. Landmark placement is not exact on these diagrams so as to make all landmarks visible.
Ts1Rhr cerebral region
As was the case for Ts65Dn, analysis of the cerebral region in Ts1Rhr showed relatively few LDs that differed significantly. Thirty-two of the 171 LDs (19%) are significantly different in Ts1Rhr mice as compared to euploid, with a mean ratio of 1.02, ranging from 0.92 to 1.25. In direct contrast to Ts65Dn, the superoinferior height of the cerebrum is significantly reduced in Ts1Rhr, both anteriorly (Fig. 4C,E, black lines) and posteriorly (Fig. 4D,F, black lines). The anterior portion of the cerebrum is reduced along the rostrocaudal and mediolateral axes in Ts1Rhr (Fig. 4B). In contrast, the rostro-caudal length of the posterior portion of the cerebrum is significantly increased in Ts1Rhr (Fig. 4C,E,F, white lines), corresponding to the overall increase in skull length observed by Olson et al. [2004a].
Fig. 4.
LDs that are statistically significantly different by non parametric confidence interval testing (0.95 ≤ α ≥ 1.05) in Ts1Rhr aneuploid mice as compared to euploid littermates illustrated on representative 3D surface reconstructions and slice HR-MR images of a euploid mouse brain. White lines indicate LDs that are significantly increased in Ts1Rhr aneuploid mice; black lines are significantly reduced. A: Caudal surface 3D reconstruction. B: Transverse slice. C: Parasagittal slice taken through the brain right of the midline. D: Right lateral surface 3D reconstruction. E: Parasagittal slice taken through the brain left of the midline. F: Left lateral surface 3D reconstruction. Landmarks are defined in Table 1. Landmark placement is not exact in order to make all landmarks visible.
Ts65Dn cerebellar region
Although the size of the cerebellum is reduced in Ts65Dn, the shape is not markedly different from that in euploid littermates. The mean ratio of the comparisons of LDs measured on the euploid and aneuploid cerebellum is 1.03, ranging from 0.96 to 1.09. The overall height of the cerebellum is reduced on average in Ts65Dn as compared to euploid, but only a single LD spanning the superoinferior height of the cerebellum on the left side differs significantly from normal by confidence interval testing (Fig. 3A). The same LD on the right side is also reduced in Ts65Dn, though it does not reach statistical significance.
Ts1Rhr cerebellar region
Unlike Ts65Dn, the Ts1Rhr cerebellum shows many LDs that are significantly different from euploid. The mean ratio is 1.03, ranging from 0.877 to 1.12. Of the 45 LDs in the cerebellum subset, 13 (29%) are significantly different. Both height and width of the cerebellum are significantly reduced in Ts1Rhr. The height of the central portion of the vermis, however, is significantly increased in Ts1Rhr (Fig. 4A, white line). In contrast to Ts65Dn, the volume of the cerebellum is only slightly reduced relative to euploid in Ts1Rhr, but the shape is distinctly different.
Brain Structure in Ms1Rhr Mice
The same genes that are over-expressed in Ts1Rhr mice are under-represented in segmentally monosomic Ms1Rhr. In contrast to Ts1Rhr, Ms1Rhr mice are smaller than their euploid littermates, and this is reflected in their reduced brain size (Table II). In contrast to both Ts65Dn and Ts1Rhr, 137 of the 171 LDs (80%) in the cerebrum subset are significantly different in Ms1Rhr. Because the volume of the brain is reduced in Ms1Rhr by 82.6% relative to euploid, we would expect that many LDs would differ by a similar factor. However, the range of values is wide, from 0.93 (aneuploid > euploid) to 1.44 (aneuploid < euploid), suggesting that the difference between monosomic and euploid is not a simple scaling but instead a complex adjustment of varying neural structures. This adjustment includes significant reductions in height, width, and length of the cerebrum (Fig. 5, black lines), with significant increases in the rostrocaudal length of the posterior cerebrum (Fig. 5C,E white lines) and the mediolateral width of the most rostral portion of the cerebrum (Fig. 5B, white line). The midbrain and cerebellum are also markedly different in Ms1Rhr; 30 of the 45 LDs (67%) are significantly reduced, with a mean ratio of 1.10, ranging from 0.59 to 1.36, including reduction in both the mediolateral width and the height of the cerebellum (Fig. 5A, black lines). In strong contrast to the overall pattern of reduced brain dimensions, there is a significant increase in the mediolateral width of the Ms1Rhr midbrain (Fig. 5A, white line).
Fig. 5.

LDs that are significantly different by non-parametric confidence interval testing (0.95 ≤ α ≥ 1.05) in Ms1Rhr aneuploid mice as compared to euploid mice illustrated on representative 3D surface reconstructions and slice HR-MR images of a euploid mouse brain. White lines indicate LDs that are significantly increased in the Ms1Rhr mice; black lines are significantly reduced. A: Caudal surface 3D reconstruction. B: Transverse slice. C: Parasagittal slice taken through the brain right of the midline. D: Right lateral surface 3D reconstruction. E: Parasagittal slice taken through the brain left of the midline. F: Left lateral surface 3D reconstruction. Landmarks are defined in Table 1. Landmark placement is not exact in order to make all landmarks visible.
Discussion
Ts65Dn and Ts1Rhr Show Different Patterns of Brain Phenotypes
Volume and shape phenotypes differ among the three aneuploid mouse models (summarized in Table III). In general, segmental trisomy for the genes in the DSCR (Ts1Rhr) has an effect on both cerebral and cerebellar shape, but affects the volume of these structures only slightly. Trisomy of the larger Ts65Dn segment, on the other hand, has an effect on the shape but not volume of the cerebrum, whereas the cerebellum is reduced in volume without significant alterations in shape. When corrected for body size, the Ts65Dn brain is slightly larger and Ts1Rhr is smaller relative to euploid littermates.
Table III. Summary of Size and Shape Phenotypic Differences (Relative to Euploid) for Each Aneuploid Group.
| Ts65Dn | Ts1Rhr | Ms1Rhr | |
|---|---|---|---|
| Body weight | Reduced | Increased | Reduced |
| Cerebrum | |||
| Size | None | Reduced | Reduced |
| Shape | Increased height | Reduced height | Global change |
| Reduced occipital width | Increased rostrocaudal length | ||
| Reduced frontal width | |||
| Cerebellum | |||
| Size | Reduced | Reduced | Reduced |
| Shape | Little change | Reduced height and width | Global change |
Relative to their euploid littermates, measures of cerebellar volume are reduced in Ts65Dn, but not to the same degree as Ts1Rhr. Additionally, as compared to euploid mice, cerebellar but not cerebral volume is reduced in Ts65Dn. The shape of the cerebellum is considerably different from euploid in Ts1Rhr, while only a single LD differs in the Ts65Dn cerebellum.
The patterns describing the divergent shapes of euploid and aneuploid mice differ in each of the models. While Ts1Rhr mice are trisomic for only 1/3 of the genes triplicated in Ts65Dn, they show pronounced structural anomalies that do not occur in Ts65Dn. The pattern of significantly different LDs as well as the degree of abnormality varies across the aneuploid models, as well. A close look at the two trisomic strains reveals that different regions are affected. Even for those regions affected in both Ts65Dn and Ts1Rhr mice, the direction and magnitudes of the differences vary. While the height of the cerebrum is significantly increased in Ts65Dn, it is significantly reduced in Ts1Rhr. The anterior cerebrum is significantly reduced in Ts1Rhr, but does not differ from euploid in Ts65Dn. Finally, the spatial organization of the centrally located subcortical structures (caudate nuclei, thalami, anterior commissure) differs significantly from euploid in Ts1Rhr, but not in Ts65Dn. Though our nonparametric statistical methods are specifically designed to accommodate smaller samples, results approaching our chosen level of significance might cross that threshold with increased sample sizes.
Relationship to DS Phenotypes
Studies of the brain in DS have shown that individuals with trisomy have smaller brains overall [Crome et al., 1966; Crome and Stern, 1972; Schapiro et al., 1987; Wisniewski, 1990; Weis et al., 1991; Raz et al., 1995; Pearlson et al., 1998; Pinter et al., 2001]. This reduction is accompanied by regional shape changes that include an anteroposteriorly shorter cerebrum [Wisniewski, 1990], reduced frontal lobes [Benda, 1971; Crome and Stern, 1972; Wisniewski, 1990], and compressed occipital lobes that are steeply sloped in height [Kemper, 1988]. For the mouse models considered here, triplication of segments of mouse chromosome 16 containing genes orthologous to those on Hsa21 does not significantly reduce the size of the cerebrum relative to euploid as is observed in humans with DS, but it does change the cerebral shape, and these changes in shape vary according to the segment at dosage imbalance.
Cerebellar structure is similar in mouse and human, but cerebral structure is markedly different. Mice lack the sulci which greatly increase surface area in the human brain, and the cerebral cortex represents a much smaller proportion of the mouse brain. Given these fundamental structural differences, it is not surprising that mouse models do not reflect the full range of structural phenotypes identified in humans with DS. Nonetheless, there are significant parallels in the ways that trisomy affects brain development in mouse and human. In the trisomic models examined here, some of the DS-like cerebral phenotypes are observed exclusively in Ts65Dn while others are not observed in Ts65Dn but are expressed in Ts1Rhr mice. The compressed and steeply sloped occipital region observed in DS is mirrored in the increased cerebral height and reduced occipital width in Ts65Dn but not in Ts1Rhr, while the reduced frontal width and length in DS is reflected in Ts1Rhr brain phenotypes, but not in Ts65Dn. Neither Ts65Dn nor Ts1Rhr show an overall reduction in AP length of the cerebrum as observed in DS. Although the genes triplicated in Ts1Rhr are a subset of those at dosage imbalance in Ts65Dn, the Ts1Rhr phenotype is neither a milder expression of the Ts65Dn phenotype, nor does it contain a subset of the Ts65Dn phenotypic traits.
In contrast to the cerebrum, the mouse cerebellum demonstrates direct structural similarities to human. Ts65Dn mice display direct parallels with DS in the effects of trisomy on development [Baxter et al., 2000; Roper et al., 2006]. Following Crome et al. [1966], numerous studies have reported reduced volume of the cerebellum in humans with DS [Crome et al., 1966; Benda, 1971; Crome and Stern, 1972; Ieshima et al., 1984; Wisniewski, 1990; Weis et al., 1991; Raz et al., 1995; Aylward et al., 1997; Pinter et al., 2001; Kaufmann et al., 2003; White et al., 2003], as well as underdeveloped cerebellar folia [Benda, 1971]. The small size of the cerebellum is correlated with significantly reduced density of granule cell neurons [Baxter et al., 2000]. Although cerebellar volume is reduced in Ts65Dn, it is not accompanied by change in shape. In contrast, the Ts1Rhr cerebellum shows no reduction in volume but it differs markedly in shape from euploid. These results suggest that triplication of the DSCR alone does not produce the DS phenotype of reduced cerebellar volume, and suggests further that separate genetic factors influence volume (size) and shape of the cerebellum. Cerebellar shape has not been reported in humans with DS. Because Ts65Dn has been shown to be an appropriate model for DS phenotypes we would predict that deviation, if any, from euploid shape would be minimal in DS.
The Production of Aneuploid Phenotypes
Animal models for DS have proven useful in discovering phenotypes not previously described in humans with DS [Baxter et al., 2000]. Additional study of the human condition will determine whether the shape phenotypes in the mouse models described here are observed in humans with DS. Here we show that triplication of the Ts65Dn chromosomal segment produces a subset of the DS brain phenotypes, but an entirely different subset than that observed for the triplication of the DSCR alone. These results indicate that the characteristic DS brain phenotype is not the result of three copies of the genes in the DSCR in isolation. Instead, it is the combination of the specific genes at dosage imbalance and variation in modifier genes (likely located on other chromosomes) that are key to the production of brain phenotypes in DS.
Acknowledgments
We thank V.P. Chacko and Susumu Mori for outstanding work in providing high resolution-MRI data. We also thank Timothy Ryan and Cheryl Hill for technical assistance with Amira® software. Ts1Rhr and Ms1Rhr mice are available in the U.S. from the Jackson Laboratory Induced Mutant Resource and in Europe through the EMMA network (www.emmanet.org). This work was supported in part by PHS awards 1F33DE/HD05706 (JTR), HD38384 (RHR) and T32 MH17104 training grant (KA).
Grant sponsor: PHS; Grant numbers: 1F33DE/HD05706, HD38384, T32 MH17104.
References
- Abrous D, Koehl M, LeMoal M. Adult neurogenesis: From precursors to network and physiology. Physiol Rev. 2005;85:523–569. doi: 10.1152/physrev.00055.2003. [DOI] [PubMed] [Google Scholar]
- Aldridge K, Marsh JL, Govier D, Richtsmeier JT. Central nervous system phenotypes in craniosynostosis. J Anat. 2002;201:31–39. doi: 10.1046/j.1469-7580.2002.00074.x. [DOI] [PMC free article] [PubMed] [Google Scholar]
- Arnell H, Gustafsson J, Ivarsson S, Anneren G. Growth and pubertal development in Down syndrome. Acta Paediatr. 1996;85:1102–1106. doi: 10.1111/j.1651-2227.1996.tb14225.x. [DOI] [PubMed] [Google Scholar]
- Aylward E, Habbak R, Warren A, Pulsifer M, Barta P, Jerram M, Pearlson G. Cerebellar volume in adults with Down syndrome. Arch Neurol. 1997;54:209–212. doi: 10.1001/archneur.1997.00550140077016. [DOI] [PubMed] [Google Scholar]
- Baxter L, Moran T, Richtsmeier J, Troncoso J, Reeves R. Discovery and genetic localization of Down syndrome cerebellar phenotypes using the Ts65Dn mouse. Hum Mol Genet. 2000;9:195–202. doi: 10.1093/hmg/9.2.195. [DOI] [PubMed] [Google Scholar]
- Becker LE, Mito T, Takashima S, Onodera K, Friend WC. Association of phenotypic abnormalities of Down syndrome with an imbalance of genes on chromosome 21. APMIS Suppl. 1993;40:57–70. [PubMed] [Google Scholar]
- Benda CE. 97 Mongolism. In: Minckler J, editor. Pathology of the nervous system. New York: McGraw-Hill Book Company; 1971. pp. 1361–1371. [Google Scholar]
- Canfield M, Ramadhani T, Yuskiv N, Davidoff M, Petrini J, Hobbs C, Kirby R, Romitti P, Collins J, Devine O, et al. Improved national prevalence estimates for 18 selected major birth defects—United States, 1999–2001. MMWR, CDC Weekly News. 2006;54:1301–1305. [PubMed] [Google Scholar]
- Coyle JT, Oster-Granite ML, Reeves RH, Gearhart JD. Down syndrome, Alzheimer's disease, and the trisomy 16 mouse. Trends Neurosci. 1988;11:390–394. doi: 10.1016/0166-2236(88)90075-6. [DOI] [PubMed] [Google Scholar]
- Crome L, Stern J. Pathology of mental retardation. Baltimore: Williams and Wilkins Company; 1972. [Google Scholar]
- Crome L, Cowie V, Slater E. A statistical note on cerebellar and brain stem weight in mongolism. J Ment Defic Res. 1966;10:69–72. [Google Scholar]
- Cronk C, Crocker A, Pueschel S, Shea A, Zackai E, Pickens G, Reed R. Growth charts for children with Down syndrome: 1 month to 18 years of age. Pediatrics. 1988;81:102–110. [PubMed] [Google Scholar]
- Davisson MT, Schmidt C, Reeves RH, Irving NG, Akeson EC, Harris BS, Bronson RT. Segmental trisomy as a mouse model for Down syndrome. Prog Clin Biol Res. 1993;384:117–133. [PubMed] [Google Scholar]
- Delabar JM, Theophile D, Rahmani Z, Chettouh Z, Blouin JL, Prieur M, Noel B, Sinet PM. Molecular mapping of twenty-four features of Down syndrome on chromosome 21. Eur J Hum Genet. 1993;1:114–124. doi: 10.1159/000472398. [DOI] [PubMed] [Google Scholar]
- Epstein CJ. Down syndrome (trisomy 21) In: Shriver CR, Beaudet AL, Sly WS, Valle D, editors. The metabolic basis of inherited disease. New York: McGraw-Hill; 1989. pp. 291–326. [Google Scholar]
- Escorihuela RM, Fernandez-Teruel A, Vallina IF, Baamonde C, Lumbreras MA, Dierssen M, Tobena A, Florez J. A behavioral assessment of Ts65Dn mice: A putative Down syndrome model. Neurosci Lett. 1995;199:143–146. doi: 10.1016/0304-3940(95)12052-6. [DOI] [PubMed] [Google Scholar]
- Gardiner K, Fortna A, Bechtel L, Davisson MT. Mouse models of Down syndrome: How useful can they be? Comparison of the gene content of human chromosome 21 with orthologous mouse genomic regions. Gene. 2003;318:137–147. doi: 10.1016/s0378-1119(03)00769-8. [DOI] [PubMed] [Google Scholar]
- Hall B. Delayed ontogenesis in human trisomy syndromes. Hereditas. 1965;52:334–344. doi: 10.1111/j.1601-5223.1965.tb01966.x. [DOI] [PubMed] [Google Scholar]
- Holtzman DM, Santucci D, Kilbridge J, Chua-Couzens J, Fontana DJ, Daniels SE, Johnson RM, Chen K, Sun Y, Carlson E, et al. Developmental abnormalities and age-related neuro-degeneration in a mouse model of Down syndrome. Proc Natl Acad Sci USA. 1996;93:13333–13338. doi: 10.1073/pnas.93.23.13333. [DOI] [PMC free article] [PubMed] [Google Scholar]
- Hyde LA, Frisone DF, Crnic LS. Ts65Dn mice, a model for Down syndrome, have deficits in context discrimination learning suggesting impaired hippocampal function. Behav Brain Res. 2001;118:53–60. doi: 10.1016/s0166-4328(00)00313-2. [DOI] [PubMed] [Google Scholar]
- Ieshima A, Kisa T, Yoshino K, Takashima S, Takaeshita K. A morphometric CT study of Down's syndrome showing small posterior fossa and calcification of basal ganglia. Neuroradiology. 1984;26:493–498. doi: 10.1007/BF00342687. [DOI] [PubMed] [Google Scholar]
- Insausti AM, Megias M, Crespo D, Cruz-Orive LM, Dierssen M, Vallina IF, Insausti R, Florez J. Hippocampal volume and neuronal number in Ts65Dn mice: A murine model of Down syndrome. Neurosci Lett. 1998;253:175–178. doi: 10.1016/s0304-3940(98)00641-7. [DOI] [PubMed] [Google Scholar]
- Kaufmann WE, Cooper KL, Mostofsky SH, Capone GT, Kates WR, Newschaffer CJ, Bukelis I, Stump MH, Jann AE, Lanham DC. Specificity of cerebellar vermian abnormalities in autism: A quantitative magnetic resonance imaging study. J Child Neurol. 2003;18:463–470. doi: 10.1177/08830738030180070501. [DOI] [PubMed] [Google Scholar]
- Kemper TL. Neuropathology of Down Syndrome. In: Nadel L, editor. The psychobiology of Down syndrome. Cambridge, MA: MIT Press; 1988. pp. 269–290. [Google Scholar]
- Kesslak JP, Nagata SF, Lott I, Nalcioglu O. Magnetic resonance imaging analysis of age-related changes in the brains of individuals with Down's syndrome. Neurology. 1994;44:1039–1045. doi: 10.1212/wnl.44.6.1039. [DOI] [PubMed] [Google Scholar]
- Kola I, Pritchard M. Animal models of Down syndrome. Mol Med Today. 1999;5:276–277. doi: 10.1016/s1357-4310(99)01486-0. [DOI] [PubMed] [Google Scholar]
- Korenberg J, Chen XN, Schipper R, Sun Z, Gonsky R, Gerwehr S, Carpenter N, Daumer C, Dignan P, Disteche C, et al. Down syndrome phenotypes: The consequences of chromosomal imbalance. Proc Natl Acad Sci USA. 1994;91:4997–5001. doi: 10.1073/pnas.91.11.4997. [DOI] [PMC free article] [PubMed] [Google Scholar]
- Krasuski JS, Alexander GE, Horwitz B, Rapoport SI, Schapiro MB. Relation of medial temporal lobe volumes to age and memory function in nondemented adults with Down's syndrome: Implications for the prodromal phase of Alzheimer's disease. Am J Psychiatry. 2002;159:74–81. doi: 10.1176/appi.ajp.159.1.74. [DOI] [PubMed] [Google Scholar]
- Kurjak A, Kirkinen P. Ultrasonic growth pattern of fetuses with chromosomal aberrations. Acta Obstet Gynecol Scand. 1982;61:223–225. doi: 10.3109/00016348209156561. [DOI] [PubMed] [Google Scholar]
- Lele S, Richtsmeier JT. Euclidean distance matrix analysis: Confidence intervals for form and growth differences. Am J Phys Anthropol. 1995;98:73–86. doi: 10.1002/ajpa.1330980107. [DOI] [PubMed] [Google Scholar]
- Lele S, Richtsmeier JT. An invariant approach to the statistical analysis of shapes. London: Chapman and Hall-CRC Press; 2001. [Google Scholar]
- Lorenzi H, Reeves RH. Hippocampal hypocellularity in the adult Ts65Dn mouse begins early in development. Brain Res. 2006;1104:153–159. doi: 10.1016/j.brainres.2006.05.022. [DOI] [PubMed] [Google Scholar]
- Lukaszewicz A, Cortay V, Giroud P, Berland M, Smart L, Kennedy H, Dehay C. The concerted modulation of proliferation and migration contributes to the specification of the cytoarch-itecture and dimensions of cortical areas. Cereb Cortex. 2006;16:I26–I34. doi: 10.1093/cercor/bhk011. [DOI] [PubMed] [Google Scholar]
- Moore C, Lee J, Birren B, Stetten G, Baxter LL, Reeves RH. Integration of cytogenetic with recombinational and physical maps of mouse chromosome 16. Genomics. 1999;59:1–5. doi: 10.1006/geno.1999.5812. [DOI] [PubMed] [Google Scholar]
- Myrelid A, Gustafsson J, Ollars B, Anneren G. Growth charts for Down's syndrome from birth to 18 years of age. Arch Dis Child. 2002;87:97–103. doi: 10.1136/adc.87.2.97. [DOI] [PMC free article] [PubMed] [Google Scholar]
- O'Doherty A, Ruf S, Mulligan C, Hildreth V, Errington M, Cooke S, Sesay A, Modino S, Vanes L, Hernandez D, et al. An aneuploid mouse strain carrying human chromosome 21 with Down syndrome phenotypes. Science. 2005;309:2033–2037. doi: 10.1126/science.1114535. [DOI] [PMC free article] [PubMed] [Google Scholar]
- Olson LE, Richtsmeier JT, Leszl J, Reeves RH, Roper RJ, Baxter LL, Carlson EJ, Epstein CJ. A chromosome 21 critical region does not cause specific Down syndrome phenotypes. Science. 2004a;306:687–690. doi: 10.1126/science.1098992. [DOI] [PMC free article] [PubMed] [Google Scholar]
- Olson LE, Roper RJ, Baxter LL, Carlson EJ, Epstein CJ, Reeves RH. Down syndrome mouse models Ts65Dn, Ts1Cje, and Ms1Cje/Ts65Dn exhibit variable severity of cerebellar phenotypes. Dev Dyn. 2004b;230:581–589. doi: 10.1002/dvdy.20079. [DOI] [PubMed] [Google Scholar]
- Pearlson G, Breiter S, Aylward E, Warren A, Grygorcewicz M, Frangou S, Barta P, Pulsifer M. MRI brain changes in subjects with Down syndrome with and without dementia. Dev Med Child Neurol. 1998;40:326–334. [PubMed] [Google Scholar]
- Pennington B, Moon J, Edgin J, Stedron J, Nadel L. The neuropsychology of Down syndrome: Evidence for hippocampal dysfunction. Child Dev. 2003;74:75–93. doi: 10.1111/1467-8624.00522. [DOI] [PubMed] [Google Scholar]
- Pinter J, Eliez S, Schmitt J, Capone G, Reiss A. Neuroa-natomy of Down's syndrome: A high-resolution MRI study. Am J Psychiatry. 2001;158:1659–1665. doi: 10.1176/appi.ajp.158.10.1659. [DOI] [PubMed] [Google Scholar]
- Raz N, Torres IJ, Briggs SD, Spencer WD, Thornton AE, Loken WJ, Gunning FM, McQuain JD, Driesen NR, Acker JD. Selective neuroanatomic abnormalities in Down's syndrome and their cognitive correlates: Evidence from MRI morphometry. Neurology. 1995;45:356–366. doi: 10.1212/wnl.45.2.356. [DOI] [PubMed] [Google Scholar]
- Reeves RH, Irving NG, Moran TH, Wohn A, Kitt C, Sisodia SS, Schmidt C, Bronson RT, Davisson MT. A mouse model for Down syndrome exhibits learning and behaviour deficits. Nat Genet. 1995;11:177–183. doi: 10.1038/ng1095-177. [DOI] [PubMed] [Google Scholar]
- Reeves RH, Baxter LL, Richtsmeier JT. Too much of a good thing: Mechanisms of gene action in Down syndrome. Trends Genet. 2001;17:83–88. doi: 10.1016/s0168-9525(00)02172-7. [DOI] [PubMed] [Google Scholar]
- Richtsmeier JT, Paik C, Elfert P, Cole TM, Dahlman H. Precision, repeatability and validation of the localization of cranial landmarks using computed tomography scans. Cleft Palate Craniofac J. 1995;32:217–227. doi: 10.1597/1545-1569_1995_032_0217_pravot_2.3.co_2. [DOI] [PubMed] [Google Scholar]
- Richtsmeier JT, Baxter LL, Reeves RH. Parallels of craniofacial maldevelopment in Down syndrome and Ts65Dn mice. Dev Dyn. 2000;217:137–145. doi: 10.1002/(SICI)1097-0177(200002)217:2<137::AID-DVDY1>3.0.CO;2-N. [DOI] [PubMed] [Google Scholar]
- Richtsmeier JT, DeLeon VB, Lele S. The promise of geometrics morphometrics. Yrbk Phys Anthropol. 2002;45:63–91. doi: 10.1002/ajpa.10174. [DOI] [PubMed] [Google Scholar]
- Roper RJ, St John H, Philip J, Lawler A, Reeves RH. Perinatal loss of Ts65Dn Down syndrome mice. Genetics. 2006;172:437–443. doi: 10.1534/genetics.105.050898. [DOI] [PMC free article] [PubMed] [Google Scholar]
- Sago H, Carlson EJ, Smith DJ, Kilbridge J, Rubin EM, Mobley WC, Epstein CJ, Huang TT. Ts1Cje, a partial trisomy 16 mouse model for Down syndrome, exhibits learning and behavioral abnormalities. Proc Natl Acad Sci USA. 1998;95:6256–6261. doi: 10.1073/pnas.95.11.6256. [DOI] [PMC free article] [PubMed] [Google Scholar]
- Schapiro MB, Creasey H, Schwartz M, Haxby JV, White B, Moore A, Rapoport SI. Quantitative CT analysis of brain morphometry in adult Down's syndrome at different ages. Neurology. 1987;37:1424–1427. doi: 10.1212/wnl.37.8.1424. [DOI] [PubMed] [Google Scholar]
- Shapiro BL. Whither Down syndrome critical regions? Hum Genet. 1997;99:421–423. doi: 10.1007/s004390050383. [DOI] [PubMed] [Google Scholar]
- Teipel SJ, Schapiro MB, Alexander GE, Krasuski JS, Horwitz B, Hoehne C, Moller HJ, Rapoport SI, Hampel H. Relation of corpus callosum and hippocampal size to age in nondemented adults with Down's syndrome. Am J Psychiatry. 2003;160:1870–1878. doi: 10.1176/appi.ajp.160.10.1870. [DOI] [PubMed] [Google Scholar]
- Weis S, Weber G, Neuhold A, Rett A. Down syndrome: MR quantification of brain structures and comparison with normal control subjects. AJNR AM J Neuroradiol. 1991;12:1207–1211. [PMC free article] [PubMed] [Google Scholar]
- White N, Alkire M, Haier R. A voxel-based morphometric study of nondemented adults with Down Syndrome. Neuroimage. 2003;20:393–403. doi: 10.1016/s1053-8119(03)00273-8. [DOI] [PubMed] [Google Scholar]
- Wisniewski K. Down syndrome children often have brain with maturation delay, retardation of growth, and cortical dysgenesis. Am J Med Genet. 1990 7:274–281. doi: 10.1002/ajmg.1320370755. [DOI] [PubMed] [Google Scholar]