

Abstract
With the increasing occurrence of drug resistance in the malaria parasite, Plasmodium falciparum, there is a great need for new and novel anti-malarial drugs. We have developed a 384-well, high-throughput imaging assay for the detection of new anti-malarial compounds, which was initially validated by screening a marine natural product library, and subsequently used to screen more than 3 million data points from a variety of compound sources. Founded on another fluorescence-based P. falciparum growth inhibition assay, the DNA-intercalating dye 4′,6-diamidino-2-phenylindole, was used to monitor changes in parasite number. Fluorescent images were acquired on the PerkinElmer Opera High Throughput confocal imaging system and analyzed with a spot detection algorithm using the Acapella data processing software. Further optimization of this assay sought to increase throughput, assay stability, and compatibility with our high-throughput screening equipment platforms. The assay typically yielded Z'-factor values of 0.5–0.6, with signal-to-noise ratios of 12.
Introduction
Malaria is a disease that is responsible for the deaths of over 1 million people annually, largely affecting children < 5 years of age and pregnant women.1 Deaths associated with the disease occur predominantly in sub-Saharan Africa; however, Asia, Latin America, and the Middle East are also affected to varying degrees.2 The causative agent is a parasite belonging to the genus Plasmodium, with the majority of deaths occurring with Plasmodium falciparum infection. The parasite develops by asexual replication in the human host and sexual differentiation in the Anopheles mosquito.3 Sporozoites, transmitted to the human host by a mosquito bite; infect human liver cells giving rise to merozoites that invade circulating erythrocytes. The asexual blood stage of their life cycle involves the development from ring stage parasites to trophozoites, which then mature into schizonts containing daughter merozoites. Upon schizont rupture, merozoites are again released into the blood stream, which infect new erythrocytes in a cycle that takes ∼48 hours to complete. Although a small proportion of the parasites differentiate into the sexual erythrocytic form, gametocytes, which are taken up by the mosquito to undergo sexual development. It is the blood stage parasites that are responsible for the clinical manifestations of the disease, thus the focus of the most current drug discovery programs.
Parasite resistance to anti-malarial drugs has become major impedance in the treatment of malaria. The chemical diversity of the recognized anti-malarial drugs to date is limited, consisting of four major classes of compounds, namely aminoquinolines, antifolates, artemisinin derivatives, and hydroxynapthoquinones.4 The concern, with respect to this limited chemical diversity, is that combination therapy of “new” drugs based on the known chemistry backbones will suffer from parasite resistance within a short period of time, caused by priming of the parasite by the “existing” drug. Sequencing of the P. falciparum genome has also demonstrated over 5,000 genes comprising a large number of diverse drug targets, many of which have yet to be characterized.5 However, most of the current drugs to date interact with only a small selection of these drug targets including heme detoxification (chloroquine), folate metabolism, and the parasite's mitochondria (atovaquone).6 There is, therefore, an urgent need for new anti-malarial drugs with chemical and biological diversity, to combat the increasing parasite resistance to current drug treatments.
To optimize the potential of identifying compounds active against all possible parasite drug targets, a high-throughput screen measuring inhibition of parasite growth was required. The gold standard methods for parasite detection and drug susceptibility testing are considered to be microscopic examination of stained blood smears or a radiometric assay measuring the incorporation of [3H]-hypoxanthine by the parasite.7 Other methods for detection of erythrocyte infection and drug susceptibility testing have also been developed using flow cytometry (YOYO-1 dye),8 enzyme-linked immunosorbent assays (ELISA) measuring histidine-rich protein II,9 ELISA and colorimetric assays measuring parasite lactate dehydrogenase,10,11 and fluorescence-based microplate assays using DNA-binding dyes such as Hoechst,12 PicoGreen,13,14 SYBR green I,13,15 and 4′,6-diamidino-2-phenylindole (DAPI).16 A number of comparative studies have demonstrated the ability to detect P. falciparum at similar or greater sensitivity to microscopy and/or [3H]-hypoxanthine incorporation, and to yield similar IC50 values for known anti-malarial compounds.
However, not all of these assay formats are suitable for high-throughput screening (HTS) caused by factors such as cost, safety (radioactive waste disposal), assay stability and robustness, equipment availability, and quality of data produced.
The fluorescent DNA dye-based assays are obviously adaptable to high-throughput applications as demonstrated by screening programs conducted in 384- and 1536-well formats.16,17 These assays, however, measure total fluorescence intensity (TFI) outputs that are prone to potential interferences from the chemical entities being screened.18 To improve the sensitivity of these assays, Baniecki and others16 had previously described the modification of a DAPI P. falciparum growth assay for image-based analysis.
The efficiency of malaria drug discovery has been greatly enhanced by high content screening, the automated cell biology process using optics, chemistry, biology, and image analysis for rapid biological data acquisition.19 The application of automated data acquisition and image analysis has already been applied to the diagnosis of malaria using blood smears and light microscopy.20–22 The advantage of the image output when compared with total fluorescence, is the ability to detect specific isolated areas of fluorescence (parasite detection) allowing the subtraction of all non-parasite-related background readings. This background subtraction compensates for fluorescence activity of compounds that could mask parasite inhibition, thus potentially reducing false-negative rates. Although quenching compounds could yield false positives in both the imaging and total fluorescence assays, the effect of quenching compounds would be limited in the imaging assay, as the potential impact on the spot detection performed by the imaging software is far less than the impact on the actual fluorescence.
The protocol previously described for DAPI TFI and image analysis consisted of multiple centrifugation and reagent addition steps, which was not amenable for ultrahigh-throughput screening.16 This article describes the optimization of a high-throughput confocal imaging assay to identify anti-malarial compounds using DAPI for monitoring parasite growth. The simplification of the assay protocol, image acquisition, and data analysis allows for large numbers of compounds to be screened in a relatively short period of time. The HTS suitability of this assay was initially demonstrated by screening a marine natural product library, where the outcomes obtained using confocal imaging were compared with the alternative whole well fluorescent intensity readouts.
Materials and Methods
Reagents.
Hypoxanthine, 1 M NaOH, D-sorbitol, chloroquine diphosphate salt, artemisinin, 10× phosphate buffered saline (PBS) solution, EDTA, 0.5 M solution, Tris-HCl, saponin (from Quillaja Bark), Triton X-100, Giemsa stain, paraformaldehyde, dimethylformamide, and Petri dishes were purchased from Sigma Aldrich (St. Louis, MO). Methanol and dimethylsulphoxide (DMSO) were obtained from LabScan Analytical Services (Gliwice, Poland). RPMI-1640 with L-Glutamine, Albumax II, and DAPI (“fluoroPure” grade) were purchased from Invitrogen (Carlsbad, CA). CellCarrier-384 Imaging plates (clear, black, poly-D-lysine coated or tissue culture treated) were purchased from PerkinElmer (Waltham, MA). Human O+ erythrocytes were obtained from the Australian Red Cross Blood Service (agreement no: 09-05QLD-06).
P. falciparum culture.
The 3D7 and Dd2 strains of P. falciparum were kindly provided by Dr. Kathy Andrews (Queensland Institute of Medical Research, Brisbane, Australia). Cultures were grown in accordance with the protocol initially described by Trager and Jensen23 with some adaptations. The RPMI-1640 media with glutamine, supplemented with 50 μg/mL hypoxanthine, 5 mg/mL Albumax II, and 5% O+ human erythrocytes was used for all aspects of the parasite culture and assay. For general culture, parasites were maintained in non-synchronous form between 0.1% and 8% parasitemia in Petri dishes. Cultures were incubated in a Heraeus HeraCell 240 tri-gas incubator (Thermo Scientific, Waltham, MA) at 37°C using a gas mix of 5% CO2, 5% O2, and 90% N2. Cultures were split every 48 hours by simple dilution (1:5 or 1:10) in growth media and hematocrit corrected with the addition of fresh erythrocytes. Parasite growth was monitored using thin blood smears fixed in 100% methanol and stained for 10–20 min in Giemsa solution prepared in PBS.
Synchronization of P. falciparum cultures.
Synchronized parasites were obtained using D-sorbitol treatment as described by Lambros and Vanderberg24 and maintained in synchrony for up to 2 months. Basically, cultures containing > 3% ring stage parasites were harvested and centrifuged at 600 × g for 5 min (Heraeus Multifuge 3-SR, Thermo Scientific). The media was aspirated from the red blood cell (RBC) pellet and 5 mL of 5% (w/v) D-sorbitol added, the mixture swirled gently and left to stand for 5 min at room temperature. Tubes were then centrifuged, sorbitol removed, RBC pellet resuspended in media to the original volume and culture incubated under standard conditions for at least 7 hours before sorbitol treatment was repeated. Cultures were then split 1:2 or 1:4 maintaining a 5% hematocrit. The next day, parasite growth was monitored using Giemsa-stained thin blood smears, If the % parasitemia was higher than 2%, then the cultures were further split to give a maximum parasitemia of 1%. Forty-eight hours after the first sorbitol treatment, 4–8% ring stage parasites are typically observed and two sorbitol treatments (> 7 hours apart) were repeated. After at least two cycles of synchronization, cultures were used in the HTS assay and/or sorbitol treatment repeated for propagation of the parasite for an assay to be run 2 days later. In respect to this synchronization protocol and the in vitro loss of synchronicity within 24 hours, we believe the parasites are between zero and 24 hours old when used within the assay.
Preparation of P. falciparum cultures for assay.
Parasite culture in early ring stage was harvested and centrifuged as previously described. The supernatant was removed and an equal volume of fresh growth media added to the cell pellet. Fifty microliters of the cell suspension was then added to 950 μL of RPMI-1640 media and a cell count performed using a hemocytometer. From the RBC number, the actual % hematocrit was calculated, where 1% hematocrit solution = 75 × 106 RBC/mL. A thin smear of the culture was then made and percentage parasitemia was calculated by counting at least 500 RBC (∼6–8 fields of vision). Using the percentage parasitemia and actual hematocrit values, the culture was then diluted to 2% parasitemia in 0.75% hematocrit for the 3D7 strain and 3% parasitemia in 0.75% hematocrit for the Dd2 strain.
DAPI high-throughput anti-malarial assay.
Library plates of marine natural product extracts (250 μge/μL stock in 100% DMSO, μge = amount of biota used to prepare the extract) prepared at the Eskitis Institute, Griffith University were diluted 1/25 by adding 1 μL of stock extract using a 384-well head dispenser (MiniTrak Robotic Liquid Handling System, PerkinElmer) to 24 μL sterile water, in clear, sterile 384-well plates (BD Falcon, San Jose, CA). These plates were lidded and stored overnight at 4°C. Before use, the dilution plates were brought to room temperature and 25 μL of sterile water containing either 4% DMSO or 20 μM artemisinin (in 4% DMSO) as “in-plate” controls were added to the last two columns of the 384-well plates using an electronic multichannel pipette.
Five microliters (5 μL) of the diluted library plate (including in-plate controls) was then transferred into CellCarrier-384 well Imaging plates (MiniTrak). Twenty-five microliters (25 μL) of assay media was dispensed into the plates using a Multidrop 384 dispenser (Thermo Scientific) followed by the addition of 20 μL of parasite preparation, The final assay well volume of 50 μL therefore contained either 0.4% DMSO only (minimum inhibition control), with 2 μM artemisinin (maximum inhibition control) or 1 μge/μL natural product fraction, 2% or 3% parasitemia and 0.3% hematocrit. The plates were lidded and incubated for 72 hours at 37°C/5% CO2. Different parasitemias for 3D7 and Dd2 were initially used in this study to obtain similar assay windows, because initially it was found that when the assay was performed with Dd2 this always resulted in reduced spot numbers, thus a smaller assay window. The IC50 value obtained for reference compounds did not alter with the higher parasitemia, and a comparable assay signal to background ratio was obtained. After continued evaluation, the % parasitemia was subsequently changed to 2% for 3D7 and Dd2 (and additional strains such as HB3, FCR3, and K1), because the parasite number is more relevant than the assay window, which is more a feature of the parasite strain growth rate.
After 72 hours incubation, all plates were brought to room temperature. Batches of 10 plates were then processed through the DAPI staining procedure in an overlapping format to increase throughput. Thirty × 384-well plates were run through the DAPI staining procedure at any one time. Using a 384-channel disposable tip dispensing head (Biomek FX, Beckman Coulter, Fullerton, CA), 30 μL of 1X PBS was added to all 10 plates, after which 60 μL of diluted supernatant was aspirated to waste. Thirty microliters (30 μL) of DAPI in permeabilization buffer (1X PBS, 0.01% Triton-X100, 0.001% saponin, 5 mM EDTA, and 0.5 μg/mL DAPI was then added to all 10 plates and left to incubate for 40 min at room temperature in the dark. After incubation, 30 μL of excess DAPI-permeabilization buffer was aspirated from the wells. The plates were stacked and left at room temperature in the dark for at least 4 hours or until the assay window was greater than 10-fold. All the additions and aspirations using the Biomek FX were optimized to minimize any disturbance of the RBC cell layer and reduce aerosol formation. Waste was immediately evacuated into a lidded container with 500 mL of concentrated bleach.
After incubation, the plates were then loaded onto the Twister II Microplate Handler (PerkinElmer) and imaged on the Opera confocal microplate imaging reader (PerkinElmer) using the following settings; image size 0.430 × 0.345 mm2, 20X water objective with a 405-nm excitation line and 420–490-nm band pass emission filter, laser power of 1,870 μW, and camera exposure times of 80 msec. A single image per well was taken 1 μm above the bottom of the plate within the erythrocyte cell layer. After reading on the Opera, the plates were also measured on a Victor2 microplate reader (PerkinElmer) at 355 nmexc/460 nmem to obtain total well fluorescence intensity.
Data analysis.
Image analysis was performed with the Acapella version 2.0 data processing software (PerkinElmer) using a spot detection algorithm. First, local pixel intensity maximums were detected over the entire image of each well (0.430 × 0.345 mm2). A circle, four pixels in radius, was drawn around the intensity maximums and designated as a spot. The spots were then classified as real spots, on the basis of two parameters. Contrast of the maximum fluorescence intensity of the spot with the surrounding pixels in the circle and SpotToCell Intensity, which was used to compare maximum spot intensity to the background intensity found over the whole image. For this assay a contrast of 0.5 and SpotToCell Intensity of 4 was used.
Converted data was then exported as the number of spots per image to calculate percentage inhibition values of treated wells (T) using the minimum inhibition control (0.4% DMSO, Min) and maximum inhibition control (2 μM Artemisinin, Max) as shown in Eq. (1).
The IC50 values were calculated from dose response curves generated using GraphPad Prism version 4.0 (Hallogram Publishing, Aurora, CO).
Results
Establishment of RBC number: percentage hematocrit relationship.
Hematocrit in medical fields is defined as the percentage, by volume of packed RBCs, in a given sample of blood after centrifugation. The % hematocrit is a standard term used in Malaria culture protocols and refers to the percentage of packed RBC in the culture, based on the RBC pellet, after centrifugation, being 100% hematocrit. For example 5% hematocrit is 0.5 mL of compacted RBC added to 9.5 mL of culture media. As this term is used in almost all protocols for Malaria culture we have maintained its use for comparison purposes. However, the actual number of RBC per ml of culture in a standard Malaria culturing protocol can be quite variable caused by multiple factors such as cell lysis caused by parasite replication, disturbance of compacted RBC suspension, and pipetting accuracy of 100% compact RBC. Throughout the initial development of the DAPI-imaging assay, significantly varied optimum and signal to background (S/B) ratio responses were observed. Although we routinely determined the % parasitemia by Giemsa-stained blood smears, we worked on a supposed hematocrit value of 5% for the culture and made all dilutions based on this value. At this point, we postulated that the total number of RBC in a well could have an effect on the detection of parasite infected RBC, and thus assay reproducibility.
To standardize this parameter, and thus the reproducibility of the assay, an RBC number value that equates to 1% hematocrit was established. From five individual tubes of 100% erythrocyte preparations, a sample volume was diluted in assay media to give a 2.5% hematocrit. To ensure accuracy, this was performed using Gilson micropipettes rather than serological pipettes. Each tube was then further diluted 1:200 and a cell count performed using a hemocytometer.
The average cell number and % coefficient of variation (% CV) was calculated for the five independent RBC preparations, taking into account the 1:200 dilutions of the 2.5% hematocrit solutions. The average cell number for 2.5% hematocrit was then converted to the number of erythrocytes as standard in 1% hematocrit. It was determined that an average of 187.5 × 10⁶ RBC/mL represented 2.5% hematocrit (6.3% CV obtained). Therefore, 1% hematocrit has an average of 75 × 106 RBC/mL. This concentration was subsequently used for preparation of parasite cultures for screening. During routine culture maintenance the value of % hematocrit is still used, but when preparing the culture for use in the screening assay the number of RBC/mL is measured using a hemocytometer and subsequent conversion to its % hematocrit value is made for comparison with other assay protocols in the literature. The accurate % hematocrit value in conjunction with % parasitemia, determined by Giemsa smear, can be used to determine the actual total number of RBC in the assay well, and therefore the number of infected RBC per well (observed effect can be seen in the Results section: Effect of percentage hematocrit on parasite detection).
Optimization of image acquisition using the Opera Confocal Image Reader.
In this assay, unlike most mammalian cell imaging assays, we are not imaging a single monolayer of cells. Each well contained homogeneous layers of compacted RBCs in all possible orientations. During the staining process, a minor degree of disturbance to the compacted cell layer occurs, resulting in areas of less compacted cell densities, which may result in poor interwell precision within the assay.
To optimize image acquisition during assay development and HTS, a “z-stack” of images was taken using the Opera software to determine the optimum focal plane for imaging, but more specifically for assay reproducibility. This was achieved by imaging CellCarrier plates containing minimum (0.4% DMSO) and maximum (2 μM artemisinin) inhibition controls using 3D7 strain parasites at 2% parasitemia and 0.3% hematocrit. Images of the cells were captured using settings previously described (Materials and Methods section: DAPI HTS anti-malarial assay) of wells in 1.00 μm intervals, starting from −1.00 μm (the distance the image is captured from the liquid-solid interface layer detected by the autofocus laser). Control well images were examined by eye and the Acapella spot detection algorithm was used to obtain the optimum focus height for the greatest differentiation between the control wells. The actual focus height had only minimal effect on the detection of spot numbers but we found that the lower the read height, the greater the fluorescence measurement. This was most likely caused by less dissipation of the laser stimulation through the RBC layers. These parameters were then applied to control plates containing at least 96 minimum and maximum control wells for evaluation of Z′. This evaluation of focus height was used numerous times throughout the development of the assay and was found to be consistent at a 1μm focus height, resulting in Z′ values of 0.5 and above.
A reference image was also used to correct for excitation intensity differences across the well as the laser excitation is brightest in the center. The reference image was composed of one fluorescent dye excited using the 405-nm laser, which was scanned before the data images. Upon detecting fluctuations in emission intensity across the well, correction factors were applied automatically to subsequent images to reproduce the effect of even excitation. Laser power and camera exposure times were set to ensure fluorescence counts of between 300 and 3,000 were obtained (the optimum operating range of the charge-coupled device). For these assays, a laser power of 1,870 μW and camera exposure of 80 ms was used. An example of control images containing various concentrations of artemisinin with corresponding spot detection analysis is shown in (Figure 1).
Figure 1.
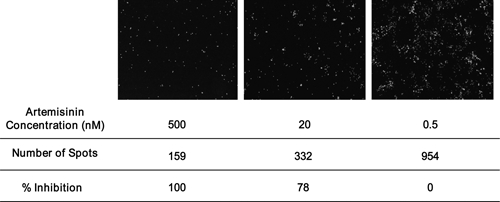
Representative images of wells containing the 3D7 parasite and varying concentrations of artemisinin. Images obtained on the Opera with the number of spots determined using the Acapella software with a spot detection algorithm. Relative % inhibition values were also calculated.
Effect of percentage hematocrit on parasite detection.
The effect of percentage hematocrit on the detection of parasite (number of spots) was evaluated by examining the same number of infected RBC in different total numbers of non-infected RBC. This investigation was performed after the standardization of the RBC number to percentage hematocrit relationship and shows the effect of % hematocrit (or number of RBC/mL) on parasite detection.
A culture containing Dd2 strain parasites was diluted to different numbers of infected RBC and the hematocrit altered to give different hematocrit percentages. Each variable was tested in 16 wells containing both minimum and maximum inhibition control wells.
Increasing the number of non-infected erythrocytes resulted in a decrease in the signal (number of spots) obtained for the same number of infected erythrocytes (Figure 2). This is a consequence of the non-infected and infected cells competing for the detection/imaging area on the Opera. This effect is of considerable importance in this imaging assay, as any variation in the non-infected RBC number can increase or decrease the signal for the same number of parasites. The same effect may possibly have resulted because of variation in parasite growth; however, data obtained using cultures of very high parasitemia, with a minimal settling period before the plates being processed through the DAPI staining protocol, also demonstrated the same trend (data not shown).
Figure 2.
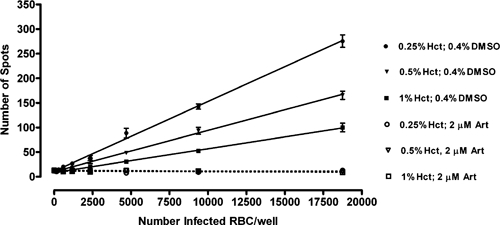
Comparison of minimum inhibition (0.4% DMSO) and maximum inhibition (2 μM artemisinin) control responses at varying concentrations of Dd2 parasites (infected red blood cells) using 0.25%, 0.5%, and 1.0% hematocrit. Each point represents the mean ± SEM of eight wells. Each data point represents the mean ± SEM of 16 wells.
Effect of the permeabilization buffer and paraformaldehyde fixation on parasite staining, linearity, and assay precision.
Optimization of the plate processing steps required for image analysis, previously recommended by Baniecki and others16 initially involved elimination of time-consuming centrifugation steps while retaining the fixation of cells with paraformaldehyde and the use of Tris-HCl permeabilization buffer. However, this resulted in a diminished assay precision (Figure 3A). Visual inspection of plates during processing suggested excessive erythrocyte lysis was a contributing factor. The Tris-HCl permeabilization buffer (20 mM Tris-HCl pH 7.5, 5 mM EDTA, 0.001% Triton-X100, and 0.001% saponin) and an alternative PBS permeabilization buffer (PBS pH 7.4, 5 mM EDTA, 0.01% Triton X-100, and 0.001% saponin) were therefore assessed for ability to induce cell lysis.
Figure 3.
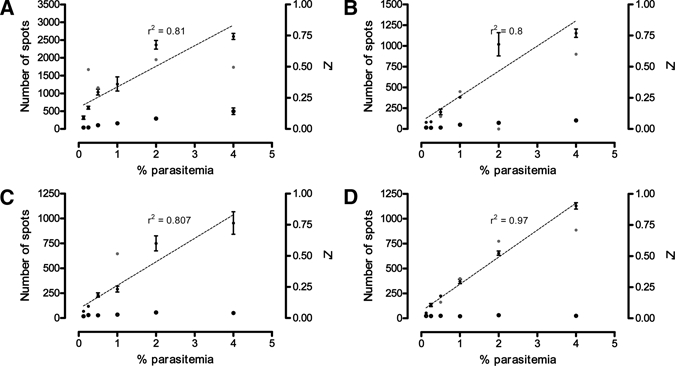
Comparison of permeabilization buffer and paraformaldehyde fixation on minimum inhibition response (solid squares), maximum inhibition response (solid triangles), and Z' factor (red circles) of Plasmodium falciparum Dd2 strain parasites at varying parasitemia and 0.3% hematocrit. Combinations of Tris-HCl buffer with fixation (A), Tris-HCl buffer without fixation (B), phosphate-buffered saline (PBS) buffer with fixation (C), and PBS buffer without fixation (D) are shown. Where a linear relationship between parasitemia and minimum inhibition response was observed, linear regression (dotted) line and r2 values were included.
Red blood cells were diluted to 1% hematocrit with either PBS or Tris-HCl permeabilization buffer, incubated at room temperature for 10 min, and centrifuged at 600 × g for 2 min. The supernatant was removed and Giemsa-stained thin blood smears were prepared from the resultant cell pellet and analyzed under a light microscope to determine the degree of cell lysis. It was clearly demonstrated by the Giemsa smears, and observed readily by eye, that the use of the Tris-HCl buffer resulted in almost total RBC lysis where no intact RBC could be visualized in the Giemsa smear. In comparison, intact RBC was observed in the presence of PBS buffer.
To further improve the quality and efficiency of the assay, the effect of paraformaldehyde fixation on linearity of fluorescent staining and assay precision was also assessed. Plates containing Dd2 strain parasites (0.3% hematocrit, 0–4% parasitemia) added to six minimum and six maximum inhibition control wells were processed using either Tris-HCl or PBS permeabilization buffer, with or without paraformaldehyde fixation. The latter process involved the addition of 30 μL of 7% paraformaldehyde to the plate, followed by 1-hour incubation at room temperature before aspiration of 60 μL of well volume and addition of stain.
In the absence of paraformaldehyde fixation, 30 μL of assay volume was aspirated directly from the well before staining. This, however, while eliminating a processing step in the assay, caused plate edge effects that were attributed to the disruption of the cell bed during the aspiration step and variation of well volumes caused by evaporation during the 72-hour incubation period. Subsequently, the addition of 30 μL of paraformaldehyde was replaced with 30 μL of PBS buffer and 60 μL of supernatant aspirated before staining, which reduced the edge effects previously observed. It is likely that the buffer addition in the absence of fixation performs two roles. First, it equals out the volumes in all the wells allowing accurate aspiration, minimal disruption/disturbance to the cell bed, and standardizes the remaining well volumes. Second, the addition of buffer provides a wash step that removes potentially interfering compounds in the DAPI staining or measurement.
The results (Figure 3B–D) indicate that the use of PBS buffer without paraformaldehyde fixation produced superior assay precision and performance. The linear relationship between percentage parasitemia and spot number when using PBS-based permeabilization buffer, showed that the parameters and settings selected for use in the algorithm for spot detection (size, shape, and fluorescence of malaria parasites) allow a direct measurement of parasite number.
From this experiment the final % hematocrit and % parasitemia were chosen for each parasite strain based on the number of spots obtained and the Z′.
Optimization of aspirating and dispensing using Biomek FX.
Processing of plates for the addition of DAPI after incubation was optimized using the Biomek FX liquid handling system. All protocols used on the Biomek FX were optimized for minimum aerosol production and disturbance of the erythrocyte layer.
The assay can also be run in a homogeneous format with stain and permeabilization buffer added directly to the wells, post incubation, with no aspiration required. The plates processed in this way result in comparable IC50 values for chloroquine and artemisinin when measured on the Opera, but could not be measured on the Victor2 microplate reader as the residual media and stain background is too high (i.e., no signal window observed). The effect of running the assay in a homogeneous format on false positive or negative rates had not been fully evaluated at the writing of this article.
Effect of time on DAPI staining before measurement on maximum and minimum control responses and reference compound IC50 values.
As the Opera takes ∼10 min to load, image, and unload a plate, the impact of different staining times on the assay performance was assessed. Processing of large plate sets through the DAPI staining process without timing restrictions with respect to imaging would greatly facilitate HTS efficiency. To determine the effect of incubation time following staining on imaging, 48 plates were run through the HTS DAPI-imaging assay using 3D7 strain parasites. After 30 min incubation with DAPI in the dark, 30 μL of the total 50 μL DAPI stain was removed, leaving 20 μL of stain (0.3 μg/mL DAPI). The plates were then measured on the Opera. Forty-three plates were measured over an 8-hour period, and five plates were left overnight and measured the next morning. The Opera data was converted to number of spots and the mean ± SEM internal plate control values (16 maximum and 16 minimum control wells per plate) plotted against plate number, which is equivalent to time (Figure 4A). An increase in maximum spot number is seen for plates incubated overnight in relation to those imaged on the day of staining. However, if the data is analyzed for S/B ratio the average ratio has only increased from 20 to 22 for those left overnight. Because of this very minor increase in S/B ratio it is felt that the increase in spot number for the maximum response is caused by continued permeabilization of the RBC by the saponin and Triton X-100, which allows for more parasites to be stained. These results showed that the assay plates, once processed for DAPI staining, can be kept for up to 48 hours at room temperature ready for imaging without any effect on precision or activity (only 24 hours shown). For longer storage, sealing and storing at 4–8°C is possible.
Figure 4.
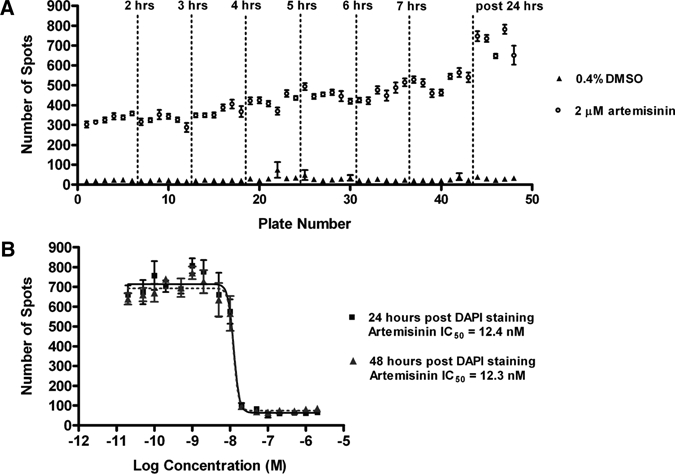
Stability of signal after 4′,6-diamidino-2-phenylindole (DAPI) staining of assay plates containing the 3D7 strain of parasite. The response to in-plate controls of plates (mean ± SEM of 16 wells) read up to 24 hours after DAPI staining is shown in (A). Dose response curves of artemisinin read 24 and 48 hours after DAPI staining (B). Each point represents the mean ± SEM of 4 wells.
A full control plate was also included within these 48 plates and measured after 24 and 48 hours, post-DAPI incubation and aspiration. The IC50 concentrations of artemisinin at both time points were comparable (Figure 4B), however a slight drop in Z' values from 0.6 at 24 hours to 0.52 at 48 hours was observed, most likely associated with some slight edge effects.
Evaluation and validation of the anti-malarial imaging assay for HTS.
An HTS campaign was run using the anti-malarial imaging assay consisting of 336, 384-well assay plates containing fractionated marine natural products. These plates were screened against both the 3D7 and Dd2 strains of P. falciparum during seven consecutive screening days. Each day, 100 plates were processed through the imaging assay in batches of 50 consisting of 48 fraction plates and two control plates. Each control plate consisted of a 16-dose concentration curve for artemisinin and chloroquine (4 wells per dose each), 128 × 0.4% DMSO wells and 128 × 2 μM artemisinin wells. For comparison, the plates were also measured for TFI on the Victor2 microplate reader (355 nmexc/460 nmem).
In-plate control values within a representative 50-plate batch run (3D7 strain) were plotted (Figure 5A) and showed stability of the assay window with minimal intraplate variation. The average response of in-plate controls between screening days obtained using image analysis or TFI measurement with calculated S/B ratios were also compared (Figure 5B–D). The first 2 days of screening were measured on the day of staining, whereas the later screening days were left for at least 8 hours after staining before image acquisition. This is reflected in the apparent variation in screening day versus number of spots graph (Figure 5B), but the comparable signal to background data (Figure 5D) indicates a reproducible assay window through screening days. The S/B ratio obtained with image analysis was on average over two times greater than that observed using TFI readouts. These results also suggest that the total fluorescence measurements obtained by the Victor2 are more susceptible to slight variation in assay volumes, as an instrumentation error involved with DAPI permeabilization buffer addition and aspiration on Day 6 significantly reduced the TFI S/B ratios; however, measurement on the Opera still retained only a slightly reduced S/B ratio.
Figure 5.
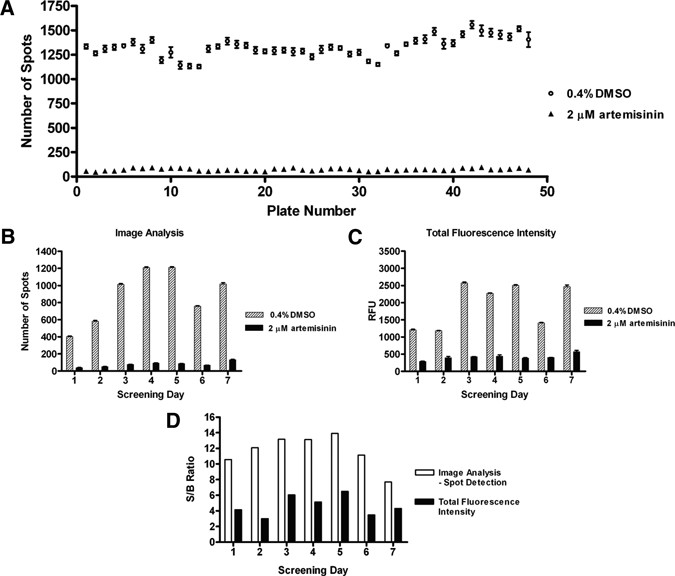
Evaluation of in-plate minimum inhibition (0.4% dimethylsulphoxide [DMSO]) and maximum inhibition (2 μM artemisinin) controls during a 7-day screening run using 3D7 parasites. In-plate controls (mean ± SEM of 16 wells) within a 48-plate batch as measured with image analysis were compared (A). Average in-plate control values (mean ± SEM of 256 wells) for each screening day as measured using spot detection image analysis (B) or total well fluorescence (C). Average signal-to-background ratio for each screening day using both detection methods were also calculated (D).
The IC50 values of artemisinin and chloroquine were also calculated using results obtained from control plates for each screening day, measured on both the Opera and Victor2 for 3D7 (Table 1) and the Opera alone for Dd2. The average IC50 values for artemisinin and chloroquine were also compared for both the chloroquine-sensitive parasite strain, 3D7 and chloroquine-resistant strain, Dd2 (Table 2). Two whole control plates containing 16-point dose response curves for chloroquine and artemisinin (4 wells per dose) were run each screening batch. The results show comparable IC50 values using both image-based analysis or TFI readouts. In anti-malarial compound screening assays described elsewhere, artemisinin can be seen to be significantly more active than chloroquine in some instances,25 whereas in others they are much the same.16 The reason for these differences is not clear, but we believe they could be caused by the age and/or stage of the parasite at the start of the assay, the strain of parasite used (average cycle time), and the assay incubation time. The assay described within this article incorporates two cycles of proliferation based on the age of the parasite used at the start of the assay (0 to 24 hours old), the 72 hours of incubation and loss of synchronicity throughout the incubation. The assay identifies both fast and slow acting compounds but does not distinguish between them.
Table 1.
Comparison of average IC50 values of positive controls calculated from image analysis or total well fluorescence during a 7-day 3D7 screening run*
| Anti-malarial control compound | Screening day | IC50 (nM) | |||
|---|---|---|---|---|---|
| Spot analysis | Total fluorescence intensity | ||||
| Plate 1 | Plate 2 | Plate 1 | Plate 2 | ||
| Chloroquine | 1 | 28.1 | 222.3 | 22.6 | 25.7 |
| 2 | 19.9 | 19.8 | 20.0 | 18.9 | |
| 3 | 28.5 | 26.0 | 21.9 | 32.0 | |
| 4 | 25.5 | 25.3 | 22.5 | 20.8 | |
| 5 | 39.8 | 24.7 | 27.6 | 34.6 | |
| 6 | 19.6 | 16.6 | 18.4 | 18.9 | |
| 7 | 29.9 | – | 23.0 | 25.3 | |
| Artemisinin | 1 | 22.1 | 17.8 | 20.6 | 20.4 |
| 2 | 13.6 | 12.4 | 15.2 | 13.2 | |
| 3 | 22.0 | 23.0 | 22.7 | 22.0 | |
| 4 | 23.7 | 32.0 | 20.8 | 24.5 | |
| 5 | 37.2 | 23.6 | 27.9 | 22.4 | |
| 6 | 11.7 | 12.6 | 11.3 | 11.2 | |
| 7 | 14.4 | – | 30.8 | 20.3 | |
Two whole plate controls containing chloroquine and artemisinin concentration curves (4 wells per dose) were run each day.
Table 2.
Comparison of average IC50 values of positive controls calculated from image analysis during a 7-day screening run for both 3D7 and Dd2 parasites*
| Control compound | Screening day | IC50 (nM) | |
|---|---|---|---|
| 3D7 spot analysis | Dd2 spot analysis | ||
| Chloroquine | 1 | 28.1 | 151 |
| 2 | 19.9 | 130.2 | |
| 3 | 28.5 | 111.1 | |
| 4 | 25.5 | 125.3 | |
| 5 | 39.8 | 163.3 | |
| 6 | 19.6 | 98.4 | |
| 7 | 29.9 | 133.7 | |
| Artemisinin | 1 | 22.1 | 18.8 |
| 2 | 13.6 | 30 | |
| 3 | 22.0 | 20.1 | |
| 4 | 23.7 | 22.9 | |
| 5 | 37.2 | 16.5 | |
| 6 | 11.7 | 16.7 | |
| 7 | 14.4 | 21 | |
Two whole plate controls containing chloroquine and artemisinin concentration curves (4 wells per dose) were run each day.
The initial HTS of the marine natural product library yielded 1,071 fractions of interest. Greater than 80% of the HTS fractions confirmed activity at retest, which was performed in a 5-point dose response against both 3D7 and Dd2 parasite strains. Of these, 727 fractions from 154 independent marine biota passed cytotoxicity testing against HEK-293 mammalian cells for evaluation of their selectivity index. A number of the compounds isolated have been published,26,27 whereas others have formed the basis of ongoing projects.
Advantage of anti-malarial imaging assay compared with TFI measurement.
As previously highlighted the anti-malarial imaging assay was developed in part to overcome potential interferences observed with TFI readings. The advantage of the imaging-based assay was particularly highlighted when dose response curves were analyzed for a compound isolated from a marine organism. A characteristic sigmoidal dose response curve was obtained from results using image analysis (Figure 6), whereas using TFI measurement, the curve did not plateau at the higher compound concentrations, preventing accurate IC50 value calculations.
Figure 6.
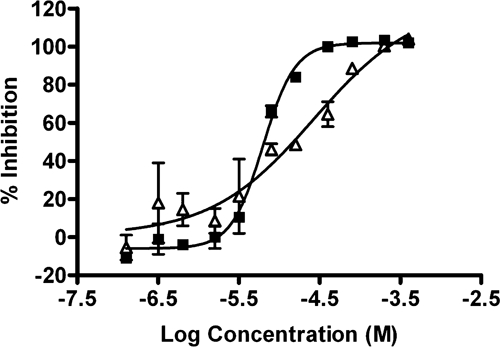
Comparison of dose response curves of a representative marine natural product against 3D7 parasites as measured using spot detection image analysis (solid squares) or total well fluorescence (open triangles).
The improved sensitivity of the image-based assay could be attributed to the limited available three-dimensional space where the image is captured (1 μm above the bottom of the well) minimizing the detection of fluorescent or quenching molecules. In addition, the parameters used for image capture and analysis are set to specifically detect fluorescent particles with respect to the size, shape, and fluorescence of malaria parasites. Conventional fluorescence assays, however, capture total fluorescence within a well, which would encompass any background fluorescence or fluorescence quenching compounds. This interference in the total fluorescence intensity measurement could be responsible for false negatives when screening at a single dose and applying a single “active” cutoff. This difference in IC50 curve shape has been seen for a number of isolated compounds. This advantage was also reported in a cross-laboratory study by Guiguemde and others28 where this imaging assay was used in conjunction with two TFI-based assays to screen a panel of compounds, which demonstrated activity in a TFI HTS campaign. Both TFI assays were found to have problems with obtaining IC50 values for some of the compounds. However, the imaging assay was able to circumvent the possible compound interference resulting in IC50 values being obtained for all of the compounds.
Discussion
In the search for new anti-malarial compounds to combat drug resistance, an HTS program was proposed. Evaluation of various P. falciparum growth inhibition assay formats indicated that for HTS purposes, the use of a fluorescent nucleic acid dye to monitor parasite growth would be the most amenable.
The P. falciparum growth assay using DAPI was previously developed using both TFI readouts and image-based analysis. As image-based analysis was preferred to improve data quality by eliminating potential interferences caused by fluorescent or quenching compounds, the original DAPI assay was further modified and optimized to significantly improve throughput, while maintaining assay precision and the magnitude and linearity of the fluorescent signal. Specifically, this was achieved by altering the assay buffer components, eliminating fixation and centrifugation steps, and optimization of RBC concentration (hematocrit).
Using these conditions, the assay was initially validated by screening a marine natural product library. The results obtained show that the response of minimum and maximum control wells was maintained up to 48 hours after DAPI staining with stability of the response for control wells consistent within screening batches and between screening days. Although we have also shown that plates may be measured using both image-based analysis and TFI, the advantage of the assay read on a confocal plate imager is evident in the superior signal-to-noise ratio and stability of the signal in response to assay variation. In addition, we have subsequently demonstrated that it is possible to run more than three times as many plates per screening run by further optimization of plate processing and measurement, despite the longer plate reading times of a confocal plate imager when compared with a standard microplate reader.
The ability to store and review the images also confers a distinct advantage to TFI measurements, whereby a more detailed interpretation may be applied to indicate the parasite stage at which growth was stopped. Parasite stage specificity experiments often include initial mode of action studies of lead anti-malarial compounds, however, these experiments are time consuming and low throughput. This is still under investigation but indications within our laboratory, and elsewhere, are that the parasites are more or less fluorescent at different stages of their life cycle caused by different levels of DNA.29 Using specific algorithms set to detect size and fluorescence of objects within the image, stage specificity information could be obtained during the initial screening process or, more likely, during assays performed specifically for stage effect during IC50 determination.
Subsequently, since screening of this initial marine natural product library, a large number of chemical libraries ranging in size from 5,000 to 500,000 compounds have been screened. The source of the libraries has been diverse including large and small pharmaceutical and biotech companies and academic laboratories. As expected the hit rate and percent confirmation has varied depending upon the chemical diversity and configuration of the library, and the HTS concentration. Since the initial development of the imaging assay, it has been estimated that well over 3 million data points have now been screened. The result of these screening campaigns has been the identification of thousands of compounds, which have progressed through to accurate IC50 determination against the parasite and measurement of their selectivity index against mammalian cells, resulting in the selection of lead compound series for progression into the next stages of the malaria drug discovery process. The performance of this assay has recently been compared with results obtained by other anti-malarial assays in a study by Guiguemde and others28 where it gave good reproducibility for compounds over a wide potency range. In conclusion, this work has described the development and validation of a high-throughput, robust, and sensitive anti-malarial assay designed specifically for image-based analysis, with significant advantages over current anti-malarial screening technologies.
ACKNOWLEDGMENTS
We thank Ian Bathurst (MMV) for his continued encouragement and support. We also thank members of the Molecular Libraries group (Eskitis Institute) for their assistance in the preparation of the screening library and Liza Fernandez for editorial assistance. We acknowledge the Australian Red Cross Blood Service for the provision of human erythrocytes.
Footnotes
Financial support: This work was supported by the Medicines for Malaria Venture (MMV).
Authors' addresses: Sandra Duffy and Vicky M. Avery, Eskitis Institute for Cell and Molecular Therapies, Griffith University, Nathan, Queensland, E-mails: sandra.duffy@griffith.edu.au and v.avery@griffith.edu.au.
References
- 1.WHO . World Malaria Report. Geneva: World Health Organization; 2008. [Google Scholar]
- 2.Guerra CA, Snow RW, Hay SI. Mapping the global extent of malaria in 2005. Trends Parasitol. 2006;8:353–358. doi: 10.1016/j.pt.2006.06.006. [DOI] [PMC free article] [PubMed] [Google Scholar]
- 3.Tuteja R. Malaria–an overview. Febs J. 2007;274:4670–4679. doi: 10.1111/j.1742-4658.2007.05997.x. [DOI] [PubMed] [Google Scholar]
- 4.Schlitzer M. Malaria chemotherapeutics part I: history of antimalarial drug development, currently used therapeutics, and drugs in clinical development. ChemMedChem. 2007;2:944–986. doi: 10.1002/cmdc.200600240. [DOI] [PubMed] [Google Scholar]
- 5.Gardner MJ, Hall N, Fung E, White O, Berriman M, Hyman RW, Carlton MJ, Pain A, Nelson KE, Rutherford K, Salzberg SL, Craig A, Kyes S, Chan MS, Nene V, Shallom SJ, Suh B, Peterson J, Angiuoli S, Pertea M, Allen J, Selengut J, Haft D, Mather MW, Vaidya AB, Martin DM, Fairlamb AH, Fraunholz MJ, Roos DS, Ralph SA, McFadden GI, Cummings LM, Subramanian GM, Mungall C, Venter JC, Carucci DJ, Hoffman SL, Newbold C, Davis RW, Fraser CM, Barell B. Genome sequence of the human malaria parasite Plasmodium falciparum. Nature. 2002;419:498–511. doi: 10.1038/nature01097. [DOI] [PMC free article] [PubMed] [Google Scholar]
- 6.Cunha-Rodrigues M, Prudencio M, Mota MM, Haas W. Antimalarial drugs—host targets (re)visited. Biotechnol J. 2006;1:321–332. doi: 10.1002/biot.200500038. [DOI] [PubMed] [Google Scholar]
- 7.Desjardins RE, Canfield CJ, Haynes JD, Chulay JD. Quantitative assessment of antimalarial activity in vitro by a semiautomated microdilution technique. Antimicrob Agents Chemother. 1979;16:710–718. doi: 10.1128/aac.16.6.710. [DOI] [PMC free article] [PubMed] [Google Scholar]
- 8.Li Q, Gerena L, Xie L, Zhang J, Kyle D, Milhous W. Development and validation of flow cytometric measurement for parasitemia in cultures of P. falciparum vitally stained with YOYO-1. Cytometry A. 2007;71A:297–307. doi: 10.1002/cyto.a.20380. [DOI] [PubMed] [Google Scholar]
- 9.Noedl H, Bronnert J, Yingyuen K, Attlmayr B, Kollaritsch H, Fukuda M. Simple histidine-rich protein 2 double-site sandwich enzyme-linked immunosorbent assay for use in malaria drug sensitivity testing. Antimicrob Agents Chemother. 2005;49:3575–3577. doi: 10.1128/AAC.49.8.3575-3577.2005. [DOI] [PMC free article] [PubMed] [Google Scholar]
- 10.Druilhe P, Moreno A, Blanc C, Brasseur PH, Jacquier P. A colorimetric in vitro drug sensitivity assay for Plasmodium falciparum based on a highly sensitive double-site lactate dehydrogenase antigen-capture enzyme-linked immunosorbent assay. Am J Trop Med Hyg. 2001;64:233–241. doi: 10.4269/ajtmh.2001.64.233. [DOI] [PubMed] [Google Scholar]
- 11.Makler MT, Ries JM, Williams JA, Bancroft JE, Piper RC, Gibbins BL, Hinrichs DJ. Parasite lactate dehydrogenase as an assay for Plasmodium falciparum drug sensitivity. Am J Trop Med Hyg. 1993;48:739–741. doi: 10.4269/ajtmh.1993.48.739. [DOI] [PubMed] [Google Scholar]
- 12.Smeijsters LJ, Zijlstra NM, Franssen FF, Overdulve JP. Simple, fast, and accurate fluorometric method to determine drug susceptibility of Plasmodium falciparum in 24-well suspension cultures. Antimicrob Agents Chemother. 1996;40:835–838. doi: 10.1128/aac.40.4.835. [DOI] [PMC free article] [PubMed] [Google Scholar]
- 13.Corbett Y, Herrera L, Gonzalez J, Cubilla L, Capson TL, Coley PD, Kursar TA, Romero LI, Ortega-Barria E. A novel DNA-based microfluorimetric method to evaluate antimalarial drug activity. Am J Trop Med Hyg. 2004;70:119–124. [PubMed] [Google Scholar]
- 14.Quashie NB, de Koning HP, Ranford-Cartwright LC. An improved and highly sensitive microfluorimetric method for assessing susceptibility of Plasmodium falciparum to antimalarial drugs in vitro. Malar J. 2006;5:95. doi: 10.1186/1475-2875-5-95. [DOI] [PMC free article] [PubMed] [Google Scholar]
- 15.Smilkstein M, Sriwilaijaroen N, Kelly JX, Wilairat P, Riscoe M. Simple and inexpensive fluorescence-based technique for high-throughput antimalarial drug screening. Antimicrob Agents Chemother. 2004;48:1803–1806. doi: 10.1128/AAC.48.5.1803-1806.2004. [DOI] [PMC free article] [PubMed] [Google Scholar]
- 16.Baniecki ML, Wirth DF, Clardy J. High-throughput Plasmodium falciparum growth assay for malaria drug discovery. Antimicrob Agents Chemother. 2007;51:716–723. doi: 10.1128/AAC.01144-06. [DOI] [PMC free article] [PubMed] [Google Scholar]
- 17.Plouffe D, Brinker A, McNamara C, Henson K, Kato N, Kuhen K, Nagle A, Adrian F, Matzen JT, Anderson P, Nam T, Gray NS, Chatterjee A, Janes J, Yan FS, Trager R, Caldwell JS, Scholtz PG, Zhou Y, Winzeler EA. In silico activity profiling reveals the mechanism of action of antimalarials discovered in a high-throughput screen. Proc Natl Acad Sci USA. 2008;105:9059–9064. doi: 10.1073/pnas.0802982105. [DOI] [PMC free article] [PubMed] [Google Scholar]
- 18.Simeonov A, Jadhav A, Thomas CJ, Wang Y, Huang R, Southall NT, Shinn P, Smith J, Austin CP, Auld DS, Inglese J. Fluorescence spectroscopic profiling of compound libraries. J Med Chem. 2008;51:2363–2371. doi: 10.1021/jm701301m. [DOI] [PubMed] [Google Scholar]
- 19.Wells TN, Alonso PL, Gutteridge WE. New medicines to improve control and contribute to the eradication of malaria. Nat Rev Drug Discov. 2009;8:879–891. doi: 10.1038/nrd2972. [DOI] [PubMed] [Google Scholar]
- 20.Ross NE, Pritchard CJ, Rubin DM, Duse AG. Automated image processing method for the diagnosis and classification of malaria on thin blood smears. Med Biol Eng Comput. 2006;44:427–436. doi: 10.1007/s11517-006-0044-2. [DOI] [PubMed] [Google Scholar]
- 21.Sio SW, Sun W, Kumar S, Bin WZ, Tan SS, Ong SH, Kikuchi H, Oshima Y, Tan KSW. MalariaCount: an image analysis-based program for the accurate determination of parasitemia. J Microbiol Methods. 2007;68:11–18. doi: 10.1016/j.mimet.2006.05.017. [DOI] [PubMed] [Google Scholar]
- 22.Frean JA. Reliable enumeration of malaria parasites in thick blood films using digital image analysis. Malar J. 2009;8:218. doi: 10.1186/1475-2875-8-218. [DOI] [PMC free article] [PubMed] [Google Scholar]
- 23.Trager W, Jensen JB. Human malaria parasites in continuous culture. Science. 1976;193:673–675. doi: 10.1126/science.781840. [DOI] [PubMed] [Google Scholar]
- 24.Lambros C, Vanderberg JP. Synchronization of Plasmodium falciparum erythrocytic stages in culture. J Parasitol. 1979;65:418–420. [PubMed] [Google Scholar]
- 25.Johnson JD, Dennull RA, Gerena L, Lopez-Sanchez M, Roncal NE, Waters NC. Assessment and continued validation of the malaria SYBR Green I-based fluorescence assay for use in malaria drug screening. Antimicrob Agents Chemother. 2007;51:1926–1933. doi: 10.1128/AAC.01607-06. [DOI] [PMC free article] [PubMed] [Google Scholar]
- 26.Davis RA, Duffy S, Avery VM, Camp D, Hooper JN. Quinn RJ, 2010. (+)-7-Bromotrypargine: an antimalarial β-carboline from the Australian marine sponge Ancorina sp. Tetrahedron Lett. 51:583–585. [Google Scholar]
- 27.Yang X, Davis RA, Buchanan MS, Duffy S, Avery VM, Camp D, Quinn RJ. Antimalarial bromotyrosine derivatives from the Australian marine sponge Hyattella sp. J. Nat. Prod. 2010;73:985–987. doi: 10.1021/np900834g. [DOI] [PubMed] [Google Scholar]
- 28.Guiguemde WA, Anang A, Shelat AA, Bouck D, Duffy S, Crowther GJ, Davis PH, Smithson D, Connelly M, Clark J, Zhu F, Jiménez-Díaz MB, Martinez MS, Wilson E, Tripathi AK, Gut J, Sharlow ER, Bathurst I, El Mazouni F, Fowble JW, Forquer I, McGinley PL, Castro S, Angulo-Barturen I, Ferrer S, Rosenthal PL, DeRisi JL, Sullivan DJ, Jr, Lazo JS, Roos DS, Riscoe MK, Phillips MA, Rathod PK, Van Voorhis WC, Avery VM, Guy RK. Chemical genetics of Plasmodium falciparum. Nature. 2010;465:311–315. doi: 10.1038/nature09099. [DOI] [PMC free article] [PubMed] [Google Scholar]
- 29.Contreras CE, Rivas MA, Dominguez J, Charris J, Palacios M, Bianco NE, Blanca I. Stage-specific activity of potential antimalarial compounds measured in vitro by flow cytometry in comparison to optical microscopy and hypoxanthine uptake. Mem Inst Oswaldo Cruz. 2004;99:179–184. doi: 10.1590/s0074-02762004000200011. [DOI] [PubMed] [Google Scholar]