

Abstract
Background
We hypothesize that unresponsiveness of superior sinoatrial node (SAN) to sympathetic stimulation is strongly associated with the development of symptomatic bradycardia in patients with atrial fibrillation (AF).
Methods and Results
We performed 3-dimensional endocardial mapping in healthy control (Group 1, n=10) and in patients with AF without (Group 2, n=57) or with (Group 3, n=15) symptomatic bradycardia at baseline and during isoproterenol infusion. Corrected SAN recovery time was abnormal in 0%, 11% and 36% of groups 1, 2 and 3, respectively (p=0.02). At baseline, 90%, 26% and 7% (p<0.001) of the patients had multicentric SAN activation patterns. For groups 1, 2 and 3, respectively, the median distance from the superior vena cava-right atrial junction to the most cranial earliest activation site (EAS) was 5.0 (25–75 percentile range, 3.5–21.3) mm, 10.0 (4–20) mm and 17.5 (12–34) mm at baseline (p=0.01), and was 4.0 (0–5) mm, 5.0 (1–10) mm and 15.0 (5.4–33.3) mm during isoproterenol infusion (p=0.01), suggesting upward shift of EAS during isoproterenol infusion. However, while the EAS during isoproterenol infusion was at the upper 1/3 of crista terminalis in 100% of Group 1 and 78% of Group 2 patients, only 20% of the groups 3 patients moved EAS to that region (p < 0.001).
Conclusions
Superior SAN serves as the EAS during sympathetic stimulation in normal patients and in most patients with AF without symptomatic bradycardia. In contrast, unresponsiveness of superior SAN to sympathetic stimulation is a characteristic finding in patients with AF and symptomatic bradycardia.
Keywords: sinoatrial node, nervous system, sympathetic, atrial fibrillation, sick sinus syndrome, pacemakers
The sinoatrial node (SAN) automaticity is maintained by synergistic actions of a “voltage clock” mediated by voltage-sensitive membrane ionic currents such as the hyperpolarization-activated pacemaker current (If)1 and a “Ca2+ clock” mediated by rhythmic spontaneous sarcoplasmic reticulum (SR) Ca2+ release.2 The Ca2+ clock in the superior SAN is primarily responsible for rate acceleration during sympathetic stimulation.3 Unresponsiveness of the Ca2+ clock in the superior SAN to sympathetic stimulation is a characteristic finding in dogs with atrial fibrillation (AF) and heart failure.4–5 AF in humans is also associated with significant SAN dysfunction and tachybrady or sick sinus syndrome (SSS).6–7 If the findings in canine models are applicable to humans, then the superior SAN in patients without SAN dysfunction should respond to sympathetic stimulation by serving as the earliest activation site (EAS). In contrast, failure of the superior SAN to serve as the EAS during isoproterenol infusion would be a characteristic finding in patients with SAN dysfunction. With the development of 3 dimensional (3D) endocardial electroanatomical mapping techniques, it is possible to define the activation patterns within the human atria to accurately locate the EAS.8 The purpose of the present study is to use these mapping techniques to determine the EAS at baseline and during isoproterenol infusion in patients without AF (presumably normal SAN), in patients with AF without symptomatic bradycardia and in patients with both AF and symptomatic bradycardia. The results are used to (1) ascertain that superior (rostral, upward) shift of EAS is a normal response to isoproterenol infusion in patients without AF, (2) to test the hypotheses that unresponsiveness of superior SAN to sympathetic stimulation (superior SAN dysfunction) maybe present in patients with AF and (3) to test the hypothesis that superior SAN dysfunction is a more frequent observation in patients with AF and symptomatic bradycardia than in patients with AF but without symptomatic bradycardia.
Methods
Study Population
This prospective research study was approved by the Clinical Research and Ethics Committee of the Yonsei University Hospital, Seoul, South Korea, where all mapping studies were performed. Written informed consent was obtained from each patient. We excluded patients from the study if they had recent (≤3 months) myocardial infarction, ongoing myocardial ischemia, heart failure, valvular heart diseases or have ever been treated with amiodarone. All antiarrhythmic medications (including beta blockers and calcium blockers) were suspended > 5 half-lives before the study. The Group 1 (N=10, 6 men, age 40 ± 12 years) included patients who underwent ablation for paroxysmal supraventricular tachycardia (atrioventricular reciprocating tachycardia with 4 concealed and 3 manifested bypass tract, and 3 atrioventricular nodal reentrant tachycardia) but no history of AF. Group 2 (n=57, 48 men, age 54 ± 12 years) and Group 3 (n=15, 8 men, age 61 ± 7 years) included patients referred to electrophysiological study for the treatment of symptomatic AF. The Group 2 patients had no evidence of symptomatic bradycardia. The Group 3 patients had cardiac syncope, presyncope or dizziness associated with either sinus bradycardia (<40 bpm; n=7) or prolonged sinus pauses (>3.0 seconds; n=8). While Group 3 patients had indications for pacemaker implantation,9 only one had pacemaker implanted 3 years prior to the electrophysiological study. The remaining patients were referred for AF ablation in part because the patients or the referral physicians wanted to avoid pacemaker implantation through ablation-induced reverse remodeling of the SAN.7
Electrophysiological Study
Electrophysiological studies were performed in the postabsorptive state. The patients were sedated with midazolam and with fentanyl. Multipolar catheters were positioned as follows: (1) 20-pole catheter with 2-5-2–mm interelectrode spacing in the coronary sinus with the proximal 10 electrodes positioned at the lateral right atrium (RA); (2) 10-pole catheter with 2-7-2–mm interelectrode spacing along the lateral RA. Surface ECG and bipolar endocardial electrograms were monitored continuously and stored on a computer-based digital amplifier/recorder system with optical disk storage for offline analysis. Intracardiac electrograms were filtered from 30 to 500 Hz and measured with computer-assisted calipers at a sweep speed of 400 mm/s.
Sinus node function was evaluated as follows: 1) baseline sinus cycle length was determined over 10 consecutive sinus cycles; 2) SAN conduction time was determined after an 8-beat pacing train using the following formula: SAN conduction time = [return − basic cycle length]/2. The SAN conduction time was measured 3 times and averaged value was used for data analyses; and 3) corrected SAN recovery time (CSNRT) was determined after a 30-s drive train at cycle lengths of 600, 500 and 400 ms, correcting for the baseline cycle length. At each cycle length, CSNRT was determined 3 times and the average value was used for analyses. CSNRT ≤ 550 msec was considered normal.10
Atrial effective refractory periods (ERPs) was measured from the distal and proximal coronary sinus and from low and high lateral RA for 3 times. The averaged values were used for analyses. Conduction time was assessed along the coronary sinus and the lateral RA. Methods for measuring ERP and atrial conduction are described in Online Supplement.
Electroanatomic Mapping
The 3D mapping was recorded before ablation in group 1 patients. In Group 2 and Group 3 patients, 3D mapping was performed after circumferential PV isolation and/or linear ablation in the LA. No ablation was performed in the RA or near the SAN.
Electroanatomic maps of the RA were created at baseline and during isoproterenol infusion using either Ensite NavX (N=79 patients) or CARTOmapping system (N=3 patients). These systems record the 12-lead ECG and bipolar electrograms filtered at 30 to 200 Hz from the mapping catheter and the reference electrogram. Fluoroscopy, RA angiography and computerized tomography, and the Ensite NavX or CARTO merging were used to facilitate mapping of anatomic structures, particularly the crista terminalis (CT) and superior vena cava (SVC)-RA junction, and for ensuring endocardial contact when individual points were acquired. High-density mapping was performed along the crista terminalis, septal RA, and areas of low voltage. Points were acquired if the stability criteria in space (≤6 mm) and local activation time (≤5 ms) were met.11–12 Editing of points was performed offline. Local activation was manually annotated to the beginning of the first rapid deflection from the isoelectric line on bipolar electrograms. Points were excluded if they did not conform to the 12-lead ECG P-wave morphology or if they were <75% of the maximum voltage of the preceding electrogram. Low-voltage areas were defined as contiguous areas with a bipolar voltage amplitude ≤0.5 mV.11–12
The CT was equally divided into 3 parts (lower, middle and superior). The EAS was then assigned to one of the three locations based on the 3D maps. The linear distance from the superior vena cava (SVC)-RA junction to the most cranial EAS was used as a quantitative measure of EAS location. To evaluate the SAN activation patterns, the following definitions were assigned: (1) unicentric: a single EAS that spreads centrifugally to activate the atria, and (2) multicentric: ≥2 origins of impulses around the SAN with activation time difference of ≤5 ms separated by a distance of ≥10 mm.13 Atrial activation patterns were qualitatively assessed and described using anatomically correct nomenclature. The mapping was performed both at baseline and during isoproterenol infusion. Isoproterenol infusion was started at the dosage of 7 μg/min. The mapping during isoproterenol infusion was performed at the stable heart rate, approximately 5 minutes after the commencement of isoproterenol infusion.
Statistical Analysis
Continuous variables that are normally distributed are reported as mean ± SD or 95% confidence interval (CI). Analysis of variance (ANOVA) was used to compare the means of continuous variables that are approximately normally distributed among the 3 groups, and standard deviation estimate base on the ANOVA was used to construct the confidence intervals of group means. Continuous variables that are not normally distributed (the distance from the SVC-RA junction to the most cranial EAS, CSNRT and SANCT) are reported as median (25–75 percentile range) and are compared using Kruskal-Wallis test. Normality is determined using the Kolmogorov-Smirnov goodness-of-fit test. Categorical variables are reported as count (percentage) and are compared using Fisher’s exact test. An exact 95% CI was calculated for percentage estimates discussed in the text. The SPSS statistical package (SSPS Inc., Chicago, Illinois) was used to perform all statistical evaluations. A p value of ≤ 0.05 was considered statistically significant.
The authors had full access to and take full responsibility for the integrity of the data. All authors have read and agreed to the manuscript as written.
Results
Patient Characteristics
The comparisons of basic characteristics between three groups were presented in table 1. There are more male patients in Group 2 than in Group 3. There was no significant difference in age, indications of electrophysiological study, left atrial dimension and left ventricular ejection fraction between groups 2 and 3.
Table 1.
Clinical characteristics
| Group 1 (n=10) | Group 2 (n=57) | Group 3 (n=15) | P-value | |
|---|---|---|---|---|
| Male (% of total)* | 6 (60) | 48 (84) | 8 (53) | 0.02 |
| Age, years | 40 [32–48] | 54 [51–57] | 61 [57–65] | <0.001 |
| Type of AF, n (%) | ||||
| PAF | 0 | 44 (77) | 9 (60) | <0.001 |
| PeAF | 0 | 13 (23) | 6 (40) | <0.001 |
| LA dimension, mm | 38.5 [36.8–40.0] | 40.4 [38.9–41.9] | 43.0 [39.9–46.1] | 0.14 |
| EF, % | 64.4 [60.0–68.4] | 64.4 [62.7–66.1] | 64.1 [61.3–66.6] | 0.98 |
| Underlying diseases, n (%) | ||||
| Heart failure | 0 | 0 | 0 | - |
| Hypertension | 0 | 30 (53) | 5 (33) | 0.006 |
| Age > 75 years | 0 | 2 (4) | 0 | 0.64 |
| Diabetes | 0 | 2 (4) | 0 | 0.74 |
| Stroke | 0 | 3 (6) | 2 (13) | 0.35 |
| CHADS2 score | 0 | 0.6 [0.4–0.8] | 0.3 [0.1–0.5] | 0.01 |
| ERP, ms | ||||
| High RA | 223 [204–244] | 217 [209–225] | 235 [226–245] | 0.11 |
| Low RA* | 232 [216–248] | 220 [214–227] | 252 [238–266] | <0.001 |
| Proximal CS* | 234 [214–257] | 236 [227–245] | 262 [248–277] | 0.03 |
| Distal CS | 257 [245–268] | 246 [232–262] | 258 [246–269] | 0.66 |
| RA CV, m/s* | 1.29 [1.17–1.39] | 0.88 [0.80–0.94] | 0.64 [0.44–0.89] | <0.001 |
| LA CV, m/s* | 1.26 [1.17–1.33] | 0.08 [1.02–1.13] | 0.89 [0.82–0.97] | <0.001 |
CS, coronary sinus; CV, conduction velocity; EF, left ventricular ejection fraction; EPS, electrophysiologic study; ERP, effective refractory period; LA, left atrium; PAF, paroxysmal atrial fibrillation; PeAF, persistent atrial fibrillation; RA, right atrium. The numbers in parentheses represent percentages. Numbers in the square brackets indicate the 95% confidence interval.
P-value was significant between groups 2 and 3 (p<0.05).
SAN Response to Sympathetic Stimulation
We analyzed a mean of 175 ± 60 points per patient during sinus rhythm. There were no significant differences in the number of points analyzed among groups (p=0.71). At baseline, the EAS was multicentric in 9 of 10 (90%) Group 1 patients and located at superior to middle parts of CT with the median distances from the SVC-RA junction to the most cranial EAS of 5.0 (3.5–21.3) mm. During 7 to 10 μg/min of isoproterenol infusion, the EAS was at the superior part of CT in 10 (100%) Group 1 patients. Figure 1A show a multicentric EAS at baseline (Figure 1A(a)) within the SVC but not at the CT. The EAS moved to the superior CT during isoproterenol infusion (Figure 1A(b)). The EAS was in the middle CT at baseline (Figure 1B(a)) and moved to superior CT during isoproterenol infusion (Figure 1B(b)) in a Group 2 patient. Figure 1C shows a typical example of unresponsiveness of the superior SAN to isoproterenol infusion in a patient from Group 3. The EAS at baseline (Figure 1C(a)) was ectopic, located in the anterior free wall of the RA. During isoproterenol infusion of 7 μg/min, the EAS moved to the middle CT (Figure 1C(b)). The superior SAN in this patient was always activated passively without and with isoproterenol infusion.
Figure 1.

Effects of isoproterenol infusion on EAS. A is from a Group 1 patient. The most cranial EAS at baseline (a) was in the SVC. The EAS during isoproterenol infusion (b) was at the superior one third of CT. B, Cranial shift of the EAS in a Group 2 patient. The EAS at baseline (a) and during isoproterenol infusion (b) were at the mid and superior part of CT, respectively. C, Impaired cranial shift of the EAS in a Group 3 patient. The EAS at baseline (a) was ectopic (at the RA free wall). The EAS during isoproterenol infusion (b) was located at the mid one third of CT. The superior SAN in this patient was inactive with or without isoproterenol. The dashed line in each panel marks the CT.
The EAS during isoproterenol infusion were at the upper 1/3 of crista terminalis in 10/10 (100%) Group 1 patients with the median distances from the SVC-RA junction to the most cranial EAS of 4.0 (0–5) mm (Table 2). Figure 2 summarizes the unicentric EAS in Group 2 (unfilled circles) and Group 3 (filled circles) patients at baseline (Figure 2A) and during isoproterenol infusion (Figure 2B). Among them, 43 (78%) patient of Group 2 showed EAS at the superior margin of the CT or SVC during isoproterenol infusion (Table 2). In contrast, only 3 (20%) of Group 3 patients had EAS in the superior part of the CT during isoproterenol infusion. The EAS was located significantly more superior (cranial) in Group 2 than in Group 3 (p<0001). The median distance from the SVC-RA junction to the most cranial EAS was 10.0 (4–20) mm for Group 2 and 17.5 (12–34) mm for Group 3 (p=0.03, Figure 2C) at baseline. The distance shortened significantly to 5.0 (1–10) mm in Group 2 (p=0.006) and to 15.0 (5.4–33.3) mm in Group 3 (p=0.004), respectively (Figure 2B), during isoproterenol infusion. The distance from the SVC to the most cranial EAS was longer in group 3 than group 2 during isoproterenol infusion (p=0.01).
Table 2.
The heart rate and EAS at baseline and during isoproterenol infusion
| Group 1 (n=10) | Group 2* (n=57) | Group 3 (n=15) | p-value | |
|---|---|---|---|---|
| Baseline | ||||
| Heart rate, bpm | 78 [68–86] | 80 [76–83] | 62 [53–71] | 0.001 |
| EAS, n (%) | ||||
| Unicentric | 1 (10) | 42 (74) | 13 (86) | <0.001 |
| Superior | 0 | 28 (49) | 2 (13) | |
| Mid | 1 (10) | 14 (25) | 8 (53) | |
| Inferior† | 0 | 0 | 3 (20) | |
| Multicentric | 9 (90) | 15 (26) | 1 (7) | <0.001 |
| Sinus pause | 0 | 0 | 1 (7) | 0.10 |
| EAS location, mm†‡ | 5.0 (3.5–21.3) | 10.0 (4–20) | 17.5 (12–34) | 0.01 |
|
| ||||
| Isoproterenol | ||||
| Heart rate, bpm | 129 [121–137] | 127 [123–131] | 106 [95–117] | 0.001 |
| EAS, n (%) | ||||
| Unicentric | 8 (80) | 52 (94) | 12 (80) | 0.13 |
| Superior† | 8 (80) | 43 (78) | 3 (20) | |
| Middle | 0 | 9 (16) | 6 (40) | |
| Inferior | 0 | 0 | 3 (20) | |
| Multicentric | 2 (20) § | 3 (6) | 2 (13) | 0.26 |
| Sinus pause | 0 | 0 | 1 (7) | 0.11 |
| EAS location, mm‡† | 4.0 (0–5) | 5.0 (1–10) | 15.0 (5.4–33.3) | 0.01 |
EAS: earliest activation site. The numbers in the square brackets represent 95% confidence interval.
EAS was not evaluated in 2 Group 2 patients during isoproterenol infusion.
P-value was significant between groups 2 and 3 (p<0.05).
EAS location means the median distance (25–75% percentile range) from SVC-RA junction to the most cranial EAS.
All multicentric sites were located at upper 1/3 of the CT.
Figure 2.

The distribution of the unicentric EAS at baseline (A) and during isoproterenol infusion (B). Unfilled and filled circles represent Group 2 and Group 3 patients, respectively. C, The distance from the SVC-RA junction to the most cranial EAS at baseline and during isoproterenol infusion.
Activation Rate in Sinus Rhythm
Baseline heart rate was 78 (95% CI, 68–86) bpm in Group 1, 80 (95% CI, 76–83) bpm in Group 2 and 62 (95% CI, 53–71) bpm in Group 3 (p=0.001). Group 3 had significantly lower baseline heart rate than group 1 (p=0.02) and 2 (p<0.001). The mean maximum heart rate during isoproterenol infusion was 129 (95% CI, 121–137) bpm in Group 1, 127 (95% CI, 123–131) bpm in Group 2 and 106 (95% CI, 95–117) bpm in Group 3 (p=0.001, Table 2). Group 3 had significantly lower heart rate than Group 1 (p=0.02) and Group 2 (p<0.001) during isoproterenol infusion. At baseline, a unicentric activation pattern (as shown in Figure 1A) was identified in 1 (10%, 95% CI, 0.3–45%), 42 (74%, 95% CI, 60–84%) and 13 (86%, 95% CI, 60–98%) patients in groups 1, 2 and 3, respectively (P<0.001). After isoproterenol infusion, the unicentric activation patterns were observed in 8 (80%, 95% CI, 44–97%), 52 (94%, 95% CI, 85–99%) and 12 (80%, 95% CI, 52–96%) patients in groups 1, 2 and 3 respectively (P=0.13).
The Multicentric Activation Pattern and Alternating EAS
The multicentric activation pattern was found in all groups of patients (Table 2). Figure 3A shows an example of multicentric activation in a patient from Group 2 at the heart rate of 60 bpm before isoproterenol infusion. This patient had 4 origins of activation. The EASs were located in the anterior and posterior portion of CT, anterior RA and lower RA (arrows). Figure 3B(a) shows the EAS (arrows) alternated between superior and inferior part of CT in a patient from Group 2, at the baseline heart rate of 90 bpm. The distance between two EASs was 56 mm. During 10 μg/min isoproterenol infusion, two EASs were also consistently observed at the heart rate of 180 bpm, and the distance between the two EAS was reduced to 38 mm (Figure 3B(b)) because of the upward shift of the lower EAS. Alternating EASs was observed in a group 2 patient.
Figure 3.

Examples of multicentric and alternating EAS. A, Multiple EASs were found in the anterior and posterior portion of CT, anterior RA and lower RA (arrows). B, Alternating EAS at superior (left panel) to inferior (right panel) CT at baseline (a) and during isoproterenol infusion (b). The upper and lower panels show the activation maps and electrograms, respectively. The asterisk at each lower panel is marked at the EAS of CT. The dashed line in each panel marks the CT.
At baseline, multicentric activation patterns were observed in 9 (90%, 95% CI, 55–99%), 15 (26%, 95% CI, 16–40%) and 1 (7%, 95% CI, 0.2–32%) patients in groups 1, 2 and 3, respectively (P<0.001). Group 2 (p=0.008) and 3 (p=0.005) had lower number of multicentric activation patterns than Group 1. The number of early sites was 2.4 ± 0.7 sites separated by 20.4 ± 13.2 mm in Group 3 compared with 3.5 ± 0.6 sites (p=0.02) separated by 27.5 ± 6.5 mm (p=0.33) in Group 2. Because of frequent sinus arrests, we tried but failed to determine the exact EAS in a patient in Group 3 (Table 2).
The SAN-RA Propagation
The propagation pattern during sinus rhythm was closely associated with the isoproterenol infusion and EAS location. When the EAS was located at mid (n=38) and inferior (n=6) parts of the CT, the propagation pattern was slow across the CT (Figure 4A) or septum (Figure 4B). However, after the EAS located at the superior CT at baseline (n=30) and during isoproterenol infusion (n=54), the anterior and posterior conduction delay was not observed (Figure 4C), and the propagation across the CT showed no significant delays as compared with propagation along the CT.
Figure 4.

The EAS and propagation pattern. A, The EAS was located at the posterior side of mid part of CT. The anterior conduction was delayed at the CT. B, The posterior conduction was delayed at the septum. C, The EAS was located at the SVC-RA junction. In the latter Panel, there was no delay in anterior conduction pathways. The upper and lower panels show the activation maps and electrograms, respectively. The asterisk at each lower panel is marked at the EAS of CT. The dashed line indicates the location of CT.
Normal Superior SAN Activity During Sympathetic Stimulation in a Patient with RA Scars
While most of the Group 3 patients have an unresponsive superior SAN, 3 (20%) patients had responsive superior SAN. Figure 5 shows an example from a patient with long-standing persistent AF and symptomatic SAN dysfunction after cardioversion. In this patient, termination of AF during catheter ablation was followed by junctional rhythm at 40 bpm (Figure 5A(a)). There was no SAN activity to compete with the junctional rhythm. The slow junctional rhythm could have explained her symptoms. However, the heart rate increased to 110 bpm during 10 μg/min isoproterenol infusion and the superior part of CT came alive to serve as the EAS (arrow of Figure 5B(a)). Figure 5B(b) shows that low voltage area (gray color, <0.5 mV) ranges from the middle to the lower part of RA and CT, consistent with the presence of extensive scar formation.
Figure 5.

Responsive superior SAN during isoproterenol infusion in a 50 year old woman with long-standing persistent AF and SAN dysfunction. A, (a) junctional rhythm of 40 bpm after termination of AF. (b) Sinus P wave appeared and sinus rate increased to 110 bpm during isoproterenol infusion of 10 μg/min. B, (a) RA activation map during isoproterenol infusion. The superior part of CT is the EAS (arrow). (b) RA voltage map. The middle and lower part of RA and CT shows low voltage, as indicated by gray color (<0.5 mV). The dashed line indicates the location of CT.
CSNRT
CSNRT were not different among 3 groups at all pacing cycle lengths (supplementary table). Abnormal CSNRT (> 550 ms) was found in 0 (0%, 95% CI, 0–31%) Group 1, 6 (11%, 95% CI, 4–22%) Group 2 patients and 5 (33%, 95% CI, 12–62%) Group 3 patients at the pacing cycle length of 400 ms (p=0.02).
Figure 6A and 6B show SAN response to rapid atrial pacing from Group 2 and Group 3 patients, respectively. Figure 6C shows the dot plots of the CSNRT from two groups, showing that there is a large overlap of CSNRT between these two groups of patients.
Figure 6.
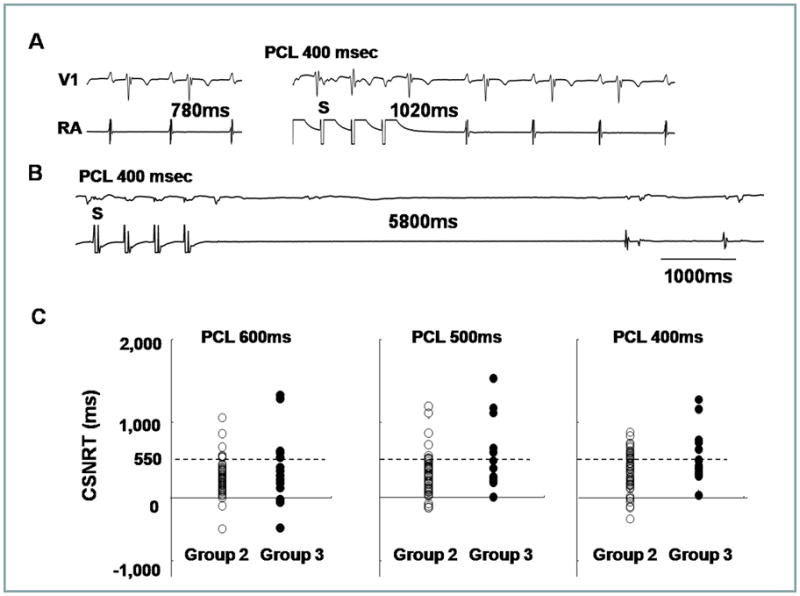
CNSRT. A, Normal CSNRT. The basic sinus cycle length and SNRT are 780 msec (left panel) and 1,020 msec (right panel), respectively, resulting in a CSNRT of 240 ms. B, Abnormal CSNRT in a patient with tachybradycardia syndrome. The basic sinus cycle length and SNRT are 1,000 ms (left panel) and 5,800 ms (right panel), respectively, resulting in a CSNRT of 4,800 ms. Upper and lower tracings are V1 lead and RA electrogram, respectively. C, The dot plots of the CSNRT from Group 2 and 3 at each pacing cycle length (PCL) showing large overlaps between the two groups. The dashed line shows the CSNRT of 550 ms.
Other Electrophysiological Differences Between Groups 2 and 3
The ERP and conduction velocity of 3 groups are described in Table 1. ERPs were longer in Group 3 compared with Group 2 at both high RA sites and low RA sites. While the ERP of proximal coronary sinus was longer in Group 3 than in Group 2, the distal coronary sinus showed no difference between Group 3 and Group 2. There was significant prolongation in the RA conduction velocity in group 3 compared with group 2. LA conduction velocity along the coronary sinus catheter was also significantly longer in group 3 compared with group 2 at the pacing cycle length of 600 ms. RA low voltage area was significantly larger in group 3 (58 ± 29%) than group 2 (38 ± 30 %, p=0.01).
Normalization of SAN Function After AF Ablation
After radiofrequency catheter ablation of AF, sinus rhythm was maintained in 13 of the 15 Group 3 patients (87%, 95% CI, 60–68%), including 4 (27%, 95% CI, 8–55%) patients with antiarrhythmic drugs during 10 months (25–75 percentile range, 6–14 months) of follow up. Excluding 1 patient with a previous pacemaker implantation and 2 patients with AF, we compared the Holter monitoring before and after ablation of AF in 12 Group 3 patients. Compared to those before baseline, maximum sinus pause shortened from 5.0 ± 3.1 sec to 2.0 ± 1.1 sec (p=0.03), and minimum heart rate increased from 30.6 ± 8.4 bpm to 47.4 ± 16.6 bpm (p=0.03). Baseline symptom of bradycardia (sinus pause > 3 sec) persisted in 2 patients with paroxysmal attacks of AF. There were no documented symptomatic bradycardia episodes in the other patients.
Comparative Efficacy of Testing for Symptomatic Bradycardia
We analyzed the comparative efficacy of CSNRT and 3D mapping in differentiating Group 2 and Group 3 patients. CSNRT > 550 ms at 400 ms pacing cycle length is considered a positive CSNRT test. The failure of superior SAN to serve as EAS during isoproterenol infusion is considered a positive 3D mapping test. The sensitivity, specificity, positive predicative efficacy and negative predicative efficacy of CSNRT test are 35%, 89%, 45% and 84%, respectively, and of the 3D mapping test are 78%, 78%, 47% and 93%, respectively. The 3D mapping test is twice as sensitive but slightly less specific than CSNRT test in detecting Group 3 patients. However, the predictive efficacies of these two tests are comparable.
Discussion
We found that the vast majority of EAS during sinus rhythm is located along the CT, but the exact location of EAS is highly variable. The EAS at baseline can be found at sites as high as within the SVC and as low as 56 mm from the SVC-RA junction. In a majority of patients without AF and in approximately half of the patients with AF but without symptomatic bradycardia, the EAS is located in the superior one third of the SAN at baseline. During isoproterenol infusion, the superior SAN invariably served as EAS in all patients without AF and in of patients with AF but without symptomatic bradycardia. On the other hand, in patients with both AF and symptomatic bradycardia, the EAS is usually located in the mid-SAN at baseline and rarely moved to superior SAN during isoproterenol infusion. If superior shift of the EAS during isoproterenol infusion is used as a test to identify patients with symptomatic bradycardia, then the test has a sensitivity of 78%. In comparison, sensitivity of CSNRT is only 35%. We conclude that superior shift of EAS is a normal response to isoproterenol infusion in patients without AF and in a majority of patients with AF but no symptomatic bradycardia. In comparison, the unresponsiveness of superior SAN to serve as EAS during sympathetic stimulation (superior SAN dysfunction) is a common finding among patients with both AF and symptomatic bradycardia.
EAS and Sympathetic Tone
Schuessler et al14 reported in a canine model that sympathetic stimulation in general tend to induce a cranial shift in the location of the pacemaker within the pacemaker complex. While upward shift of EAS has not been confirmed in humans by 3D mapping, the downward shift of EAS has been reported in human patients after esmolol infusion.8 Taken together, the canine and human studies show that superior SAN is primarily responsible for heart rate acceleration during sympathetic stimulation in patients with normal SAN function.
SAN Function in Patients With AF and Symptomatic Bradycardia
Sick sinus syndrome is an abnormality involving the generation of the action potential by the SAN and is characterized by an atrial rate inappropriate for the physiological requirements. AF is associated with significant electrophysiological and structural remodeling, and is often associated with sick sinus syndrome.6–7 In dogs, persistent (> 2 weeks) rapid atrial pacing and chronic AF resulted in SAN dysfunction, as evidenced by prolongation of the SNRT and decreases in the intrinsic heart rates.15 SAN malfunction have been reported in humans with AF,6, 16 and that the SAN dysfunction may be reversible after successful AF ablation.7 Consistent with that found in a canine model,4 patient with AF had impaired heart rate acceleration and absence of upward shift of the EAS during isoproterenol stimulation. These findings suggest that Ca2+ clock malfunction underlies these abnormal physiological responses to isoproterenol infusion.
The Cranial Shift of the EAS and SAN-RA Propagation
An alternative mechanism for upward shift of the EAS is the change of the exit pathway between SAN and RA. Previous studies have shown that the impulse from the SAN propagates into RA through an upper and a lower exit site.17 It is possible that isoproterenol preferentially shifts the exit site to the upper portion of the SAN. Because the extracellular electrograms cannot be used to differentiate SAN activation and RA activation, the shifting of SAN exit sites and the shifting of the actual pacemaking sites may look the same on the 3D map. The data from this study cannot be used to differentiate these two mechanisms. However, we showed that in a patient with extensive RA fibrosis and junctional rhythm at baseline, isoproterenol infusion reactivated the pacemaker in the superior SAN. In this patient, changing the SAN-RA exit pathway is clearly not a mechanism of upward shift of the EAS. In other patients with upward shifting of EAS during isoproterenol infusion, the conduction between SAN to RA occurred at multiple directions, without evidence of conduction delay along the CT or the septum. Based on these findings and the mapping of the Ca2+ clock activity in the canine models, we propose that the pacemaker hierarchy is likely created by differential responses of Ca2+ clock to sympathetic tone at different portions of the SAN.
Unicentric Versus Multicentric Activation
Sanders et al11 previously reported that multicentric activation is found both in normal control and in heart failure. However, the EASs are more numerous in normal control (average 4 sites) than in heart failure (average 2.5 sites). They also reported that the SAN complex in patients with SAN dysfunction is more often unicentric, localized to the lower CT at the site of the largest residual voltage amplitude.11 Consistent with that study, we also found that most Group 1 patients had multicentric SAN activation pattern, and that the number of EAS in Group 2 and Group 3 patients is smaller than that of Group 1. A reduction of the EAS suggests that there are fewer backup pacemaking sites to respond to sympathetic stimulation, which could be a sign of SAN dysfunction.
Conclusion
Superior SAN serves as the EAS during sympathetic stimulation in normal patients and in most patients with AF without symptomatic bradycardia. In contrast, unresponsiveness of superior SAN to sympathetic stimulation is a characteristic finding in patients with AF and symptomatic bradycardia. 3D mapping is a more sensitive than CSNRT in identifying patients with symptomatic bradycardia.
Supplementary Material
Acknowledgments
We thank Bum-Seung Kim and Chung-Ki Lee for their technical support.
Funding Sources: This study was supported in part by a faculty research grant from Yonsei University College of Medicine (6-2009-0176, 6-2010-0059, 7-2009-0583) and by the Basic Science Research Program through the National Research Foundation of Korea funded by the Ministry of Education, Science and Technology (2010-0021993), and by United States NIH grants P01 HL78931, R01 HL78932, R01 HL71140 and the Krannert Endowment and the Medtronic-Zipes Endowment of Indiana University.
Footnotes
Conflict of Interest Disclosures: None
References
- 1.Difrancesco D. The role of the funny current in pacemaker activity. Circ Res. 2010;106:434–446. doi: 10.1161/CIRCRESAHA.109.208041. [DOI] [PubMed] [Google Scholar]
- 2.Lakatta EG, Maltsev VA, Vinogradova TM. A coupled system of intracellular ca2+ clocks and surface membrane voltage clocks controls the timekeeping mechanism of the heart’s pacemaker. Circ Res. 2010;106:659–673. doi: 10.1161/CIRCRESAHA.109.206078. [DOI] [PMC free article] [PubMed] [Google Scholar]
- 3.Joung B, Tang L, Maruyama M, Han S, Chen Z, Stucky M, Jones LR, Fishbein MC, Weiss JN, Chen PS, Lin SF. Intracellular calcium dynamics and acceleration of sinus rhythm by beta-adrenergic stimulation. Circulation. 2009;119:788–796. doi: 10.1161/CIRCULATIONAHA.108.817379. [DOI] [PMC free article] [PubMed] [Google Scholar]
- 4.Joung B, Lin SF, Chen Z, Antoun PS, Maruyama M, Han S, Piccirillo G, Stucky M, Zipes DP, Chen PS, Das KM. Mechanisms of sinoatrial node dysfunction in a canine model of pacing-induced atrial fibrillation. Heart Rhythm. 2010;7:88–95. doi: 10.1016/j.hrthm.2009.09.018. [DOI] [PMC free article] [PubMed] [Google Scholar]
- 5.Shinohara T, Park HW, Han S, Shen MJ, Maruyama M, Kim D, Chen PS, Lin SF. Ca2+ clock malfunction in a canine model of pacing-induced heart failure. Am J Physiol Heart Circ Physiol. 2010;299:H1805–1811. doi: 10.1152/ajpheart.00723.2010. [DOI] [PMC free article] [PubMed] [Google Scholar]
- 6.Gomes JA, Kang PS, Matheson M, Gough WB, Jr, El Sherif N. Coexistence of sick sinus rhythm and atrial flutter-fibrillation. Circulation. 1981;63:80–86. doi: 10.1161/01.cir.63.1.80. [DOI] [PubMed] [Google Scholar]
- 7.Hocini M, Sanders P, Deisenhofer I, Jais P, Hsu LF, Scavee C, Weerasoriya R, Raybaud F, Macle L, Shah DC, Garrigue S, Le MP, Clementy J, Haissaguerre M. Reverse remodeling of sinus node function after catheter ablation of atrial fibrillation in patients with prolonged sinus pauses. Circulation. 2003;108:1172–1175. doi: 10.1161/01.CIR.0000090685.13169.07. [DOI] [PubMed] [Google Scholar]
- 8.Marrouche NF, Beheiry S, Tomassoni G, Cole C, Bash D, Dresing T, Saliba W, Abdul-Karim A, Tchou P, Schweikert R, Leonelli F, Natale A. Three-dimensional nonfluoroscopic mapping and ablation of inappropriate sinus tachycardia. Procedural strategies and long-term outcome. J Am Coll Cardiol. 2002;39:1046–1054. doi: 10.1016/s0735-1097(02)01703-5. [DOI] [PubMed] [Google Scholar]
- 9.Epstein AE, Dimarco JP, Ellenbogen KA, Estes NA, 3rd, Freedman RA, Gettes LS, Gillinov AM, Gregoratos G, Hammill SC, Hayes DL, Hlatky MA, Newby LK, Page RL, Schoenfeld MH, Silka MJ, Stevenson LW, Sweeney MO. ACC/AHA/HRS 2008 guidelines for device-based therapy of cardiac rhythm abnormalities: Executive summary. Heart Rhythm. 2008;5:934–955. doi: 10.1016/j.hrthm.2008.04.015. [DOI] [PubMed] [Google Scholar]
- 10.Josephson ME. Clinical cardiac electrophysiology: Techniques and interpretations. 4. Lippincott Williams & Wilkins; 2008. [Google Scholar]
- 11.Sanders P, Kistler PM, Morton JB, Spence SJ, Kalman JM. Remodeling of sinus node function in patients with congestive heart failure: Reduction in sinus node reserve. Circulation. 2004;110:897–903. doi: 10.1161/01.CIR.0000139336.69955.AB. [DOI] [PubMed] [Google Scholar]
- 12.Sanders P, Morton JB, Kistler PM, Spence SJ, Davidson NC, Hussin A, Vohra JK, Sparks PB, Kalman JM. Electrophysiological and electroanatomic characterization of the atria in sinus node disease: Evidence of diffuse atrial remodeling. Circulation. 2004;109:1514–1522. doi: 10.1161/01.CIR.0000121734.47409.AA. [DOI] [PubMed] [Google Scholar]
- 13.Boineau JP, Canavan TE, Schuessler RB, Cain ME, Corr PB, Cox JL. Demonstration of a widely distributed atrial pacemaker complex in the human heart. Circulation. 1988;77:1221–1237. doi: 10.1161/01.cir.77.6.1221. [DOI] [PubMed] [Google Scholar]
- 14.Schuessler RB, Boineau JP, Wylds AC, Hill DA, Miller CB, Roeske WR. Effect of canine cardiac nerves on heart rate, rhythm, and pacemaker location. Am J Physiol. 1986;250:H630–H644. doi: 10.1152/ajpheart.1986.250.4.H630. [DOI] [PubMed] [Google Scholar]
- 15.Elvan A, Wylie K, Zipes DP. Pacing-induced chronic atrial fibrillation impairs sinus node function in dogs--electrophysiological remodeling. Circulation. 1996;94:2953–2960. doi: 10.1161/01.cir.94.11.2953. [DOI] [PubMed] [Google Scholar]
- 16.Van Den Berg MP, Van GI. Atrial fibrillation and sinus node dysfunction. J Am Coll Cardiol. 2001;38:1585–1586. doi: 10.1016/s0735-1097(01)01546-7. [DOI] [PubMed] [Google Scholar]
- 17.Fedorov VV, Schuessler RB, Hemphill M, Ambrosi CM, Chang R, Voloshina AS, Brown K, Hucker WJ, Efimov IR. Structural and functional evidence for discrete exit pathways that connect the canine sinoatrial node and atria. Circ Res. 2009;104:915–923. doi: 10.1161/CIRCRESAHA.108.193193. [DOI] [PMC free article] [PubMed] [Google Scholar]
Associated Data
This section collects any data citations, data availability statements, or supplementary materials included in this article.