

Abstract
Background
Apolipoprotein E (apoE) is a key component of the lipid metabolism. Polymorphisms at the apoE gene (APOE) have been associated with cardiovascular disease, lipid levels and lipid-lowering response to statins. We evaluated the effects on APOE expression of hypercholesterolemia, APOE ε2/ε3/ε4 genotypes and atorvastatin treatment in Brazilian individuals. The relationship of APOE genotypes and plasma lipids and atorvastatin response was also tested in this population.
Methods
APOE ε2/ε3/ε4 and plasma lipids were evaluated in 181 normolipidemic (NL) and 181 hypercholesterolemic (HC) subjects. HC individuals with indication for lowering-cholesterol treatment (n = 141) were treated with atorvastatin (10 mg/day/4-weeks). APOE genotypes and APOE mRNA in peripheral blood mononuclear cells (PBMC) were analyzed by TaqMan real time PCR.
Results
HC had lower APOE expression than NL group (p < 0.05) and individuals with low APOE expression showed higher plasma total and LDL cholesterol and apoB, as well as higher apoAI (p < 0.05). Individuals carrying ε2 allele have reduced risk for hypercholesterolemia (OR: 0.27, 95% I.C.: 0.08-0.85, p < 0.05) and NL ε2 carriers had lower total and LDL cholesterol and apoB levels, and higher HDL cholesterol than non-carriers (p < 0.05). APOE genotypes did not affect APOE expression and atorvastatin response. Atorvastatin treatment do not modify APOE expression, however those individuals without LDL cholesterol goal achievement after atorvastatin treatment according to the IV Brazilian Guidelines for Dyslipidemia and Atherosclerosis Prevention had lower APOE expression than patients with desirable response after the treatment (p < 0.05).
Conclusions
APOE expression in PBMC is modulated by hypercholesterolemia and the APOE mRNA level regulates the plasma lipid profile. Moreover the expression profile is not modulated neither by atorvastatin nor APOE genotypes. In our population, APOE ε2 allele confers protection against hypercholesterolemia and a less atherogenic lipid profile. Moreover, low APOE expression after treatment of patients with poor response suggests a possible role of APOE level in atorvastatin response.
Keywords: apolipoproteina E, hypercholesterolemia, single nucleotide polymorphism (SNP), APOE gene expression, atorvastatin
Background
Dyslipidemia is an important risk factor in the development of atherosclerosis and cardiovascular events. Research on cardiovascular diseases has leaded to a better knowledge of the molecular basis of atherosclerosis and the identification of a key role of apolipoprotein (apo) E in this process [1]. ApoE is a major constituent of triglyceride-rich chylomicrons, very low density lipoprotein (VLDL) and some subclasses of high density lipoprotein (HDL) particles, participating in the clearance of these particles from circulation by serving as a ligand for their catabolism via low density lipoprotein (LDL) and apoE receptors [2].
The gene encoding the apoE protein (APOE) is polymorphic resulting in three major isoforms (ε2, ε3 and ε4) caused by two single nucleotide polymorphisms (SNPs) in the exon 4 of the APOE, resulting in cysteine-arginine interchanges at residuals 112 and 158 of the protein, which has been associated with a number of pathophysiological conditions, including cardiovascular and neurological diseases [3].
The inhibitors of the 3-hydroxy-3-methylglutaryl coenzyme A reductase (HMGCR), or statins, are among the most prescribed drugs worldwide and provide extensive benefits in the prevention of primary and secondary cardiovascular diseases [4]. However, there is considerable interindividual variation in the lipid-lowering response to statins, which is attributed to the interaction between multiple environmental factors and genetic determinants involved in the pharmacokinetic and pharmacodynamic pathways of these drugs [5].
The APOE gene is among the most extensively studied genes involved in the statins pharmacodynamic. The studies investigating the potential modifying role of APOE genotypes on lipid response to statin therapy have produced data frequently contradictory and so far inconclusive [6]. Evidence suggests that allele ε4 carriers appear to have attenuated lipid-lowering response and ε2 carriers have enhanced response [5], however differential interpretation of these results among investigators difficult the consensus [6]. Moreover genome-wide association studies (GWAS) have also shown an association of the APOE locus with hypercholesterolemia but they were unsuccessful in establishing its relationship with statin response when whole-genome platforms were used [7].
The regulation of APOE expression is very complex with participation of several factors controlling its transcription, including some factors that also regulate the expression of other proteins that control the lipid traffic [1]. Nevertheless, possible regulation of APOE transcription by polymorphisms and statins has been poorly studied.
The purpose of this study is to investigate the effects on APOE mRNA expression profile of hypercholesterolemia and APOE genotypes using PBMC from normolipidemics and hypercholesterolemic individuals. Moreover, we also analyzed the influence of atorvastatin treatment on APOE expression in hypercholesterolemic individuals, as well as the relationship of APOE genotypes with plasma lipid and atorvastatin response in our population.
Results
Characteristics of study population
Main characteristics of normolipidemic and hypercholesterolemic individuals are shown in Table 1. Frequencies of ethnics, gender, family history of coronary artery disease (CAD), cigarette smoking and physical activity were similar between NL and HC groups. However, mean values of age and body mass index (BMI), as well as frequencies of menopause, hypertension and obesity were higher in HC than NL group (p < 0.05). As expected, HC individuals had a more atherogenic lipid profile showing higher total, LDL and VLDL cholesterol, triglycerides and ApoB compared with NL subjects (p < 0.05).
Table 1.
Demographic and laboratory characteristics of study groups
| Parameter | Hypercholesterolemic (n = 181) |
Normolipidemic (n = 181) |
p-value |
|---|---|---|---|
| Age, years | 56.1 ± 10.8 | 46.9 ± 6.8 | < 0.001 |
| Ethnics [European/African], % | 62/38 | 65/35 | 0.581 |
| Gender, % of women | 67 | 73 | 0.205 |
| Menopause, % | 52 | 19 | < 0.001 |
| Family history of CAD, % | 55 | 45 | 0.062 |
| Hypertension, % | 57 | 36 | < 0.001 |
| Obesity, % | 29 | 15 | 0.002 |
| Cigarette smoking, % | 16 | 18 | 0.673 |
| Physical activity, % | 49 | 45 | 0.553 |
| BMI, kg/m2 | 27.8 ± 4.1 | 26.2 ± 4.2 | < 0.001 |
| Total cholesterol, mg/dL | 270 ± 41 | 173 ± 18 | < 0.001 |
| LDL cholesterol, mg/dL | 183 ± 36 | 98 ± 18 | < 0.001 |
| HDL cholesterol, mg/dL | 57 ± 14 | 58 ± 12 | 0.386 |
| Triglycerides, mg/dL | 150 ± 65 | 82 ± 28 | < 0.001 |
| VLDL cholesterol, mg/dL | 30 ± 13 | 16 ± 6 | < 0.001 |
| ApoAI, mg/dL | 136 ± 26 | 141 ± 26 | 0.101 |
| ApoB, mg/dL | 143 ± 27 | 85 ± 23 | < 0.001 |
Non-continuous variables are compared by chi-square test. Continuous variables are presented as media ± SD and compared by t test. CAD, coronary artery disease; LDL, low density lipoprotein; HDL, high density lipoprotein; VLDL, very low density lipoprotein; ApoAI, apolipoprotein AI; ApoB, apolipoprotein B. Conversion factors to convert to Systeme Internacional (SI) units are 0.02586 for cholesterol (mmol/l), 0.01129 for triglycerides (mmol/l) and 0.01 for apolipoproteins (g/l).
Association of hypercholesterolemia and plasma lipids with APOE gene expression
As represented in the Figure 1A, NL individuals showed higher levels of APOE mRNA expression in PBMC than HC individuals at baseline (NL: median 11.7 × 10⁻⁵ and inter-quartile (IQ) range: 7.6 × 10⁻⁵ - 20 × 10-5; ATORVA baseline: median: 8.1 × 10⁻⁵ and IQ range: 3.7 × 10⁻⁵ - 17 × 10-5; p = 0.004).
Figure 1.

PBMC APOE mRNA expression in normolipidemic (NL) and hipercolesterolemic individuals before (HC - BASAL) and after treatment with 10 mg/day of atorvastatin (HC- ATORVA) [A] and according to LDL cholesterol goal achievement in response to atorvastatin [B]. Values are presented as dispersion graph with bars indicating median and interquartile range and compared by Mann-Whitney U test or Wilcoxon signed test.
Spearman's correlation test demonstrated that APOE mRNA expression in PBMC is negatively correlated with total cholesterol (r = -0.195, p = 0.008) and LDL cholesterol (r = -0.214, p = 0.004), and positively correlated with apoAI concentration (r = 0.202, p = 0.007) (data not shown).
Due to the wake lineal correlation and in order to corroborate the association of APOE mRNA expression levels with plasma lipid concentration and hypercholesterolemia, comparison analyses by grouping patients according to tercile of APOE mRNA values were performed (first tercile: 2-ΔCt < 7.7x10⁻⁵; second tercile: 2-ΔCt: 7.7x10⁻⁵ - 17.1x10⁻⁵; third tercile: 2-ΔCt > 17.1x10⁻⁵). First, second and third tercile were considered as low, intermediate and high expression, respectively. As observed in Figure 2, individuals with low APOE mRNA expression had higher plasma concentration of total and LDL cholesterol and apoB and lower levels of apoAI (p < 0.05). Further univariate logistic regression analysis demonstrated that individuals with mRNA values into the low expression group had increased risk to hypercholesterolemia than individuals with higher (intermediate and high expression) values of APOE expression (OR: 2.06, 95% C.I.: 1.10-3.87, p = 0.025). Moreover, when compared with the individuals with the highest APOE mRNA levels, to belong to the low expression group represent an increased risk of 2.25 (OR: 2.25, 95% CI:1.08-4.67, p=0.030).
Figure 2.
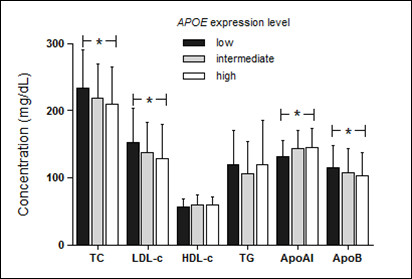
Plasma lipid profile according to APOE mRNA expression levels. Patients were grouped in levels of APOE mRNA expression according to tercile values (first tercile [low]: 2-ΔCt < 7.7x10⁻⁵; second tercile [intermediate]: 2-ΔCt: 7.7 x10⁻⁵ - 17.1 x10⁻⁵; third tercile [high]: 2-ΔCt > 17.1 x10⁻⁵) and plasma lipids were compared among the groups by one way ANOVA and Tukey test. TC, total cholesterol; LDL-c, low density lipoprotein cholesterol; HDL-c, high density lipoprotein cholesterol; TG, triglycerides; apoAI, apolipoprotein AI; apoB, apolipoprotein B; (*), p < 0.05. Conversion factors to convert to Systeme Internacional (SI) units are 0.02586 for cholesterol (mmol/l), 0.01129 for triglycerides (mmol/l) and 0.01 for apolipoproteins (g/l).
Relationship of APOE genotypes with basal lipids, atorvastatin response and APOE expression
Genotype and allele frequencies are presented in Table 2. Frequencies of SNP genotypes were as expected from a HWE (p > 0.05, data not shown) in both, NL and HC groups. The genotype distribution was different between NL and HC groups (p = 0.003) showing higher frequencies of ε2ε3 and ε2ε4 genotypes in NL individuals. ε2 allele was more frequent in NL group (7.7%) than in HC (1.7%, p < 0.001) and logistic regression analysis showed that ε2 carriers had decreased risk of hypercholesterolemia (OR: 0.27; C.I.: 0.08 - 0.85; p < 0.025), after adjustment for covariates gender, ethnics, history of CAD, age, hypertension, obesity, cigarette smoking, physical activity and alcohol consumption.
Table 2.
Genotype and allele frequencies of APOE polymorphisms in hypercholesterolemic and normolipidemic individuals.
| Genotypes | ε2ε2 | ε2ε3 | ε2ε4 | ε3ε3 | ε3ε4 | ε4ε4 |
|---|---|---|---|---|---|---|
| HC (n = 181) | 0.0% (0) | 2.8% (5) | 0.6% (1) | 66.3% (120) | 26.5%(48) | 3.8% (7) |
| NL (n = 181) | 0.6% (1) | 9.4% (17) | 5.0% (9) | 61.3% (111) | 22.7%(41) | 1.1% (2) |
| χ2 = 17.624; 5 df; p = 0.003 | ||||||
| Alleles | ε2 | ε3 | ε4 | |||
| HC | 1.7% | 80.9% | 17.3% | |||
| NL | 7.7% | 77.4% | 14.9% | |||
| χ2 = 15.223; 2 df; p < 0.001 | ||||||
| Allele | O.R. | 95%C.I. | p-value | |||
| ε3 | 1.00 | -- | -- | |||
| ε2 | 0.27 | 0.08-0.85 | 0.025 | |||
| ε4 | 1.31 | 0.76-2.26 | 0.331 | |||
Number of individuals is in parenthesis. HC, hypercholesterolemic; NL, normolipidemic; df, degrees of freedom; O.R., odds ratio; C.I. confidence interval. O.R. values and 95% C.I. were obtained from logistic regression analysis using hypercholesterolemia as dependent variable with gender, ethnics, history of coronary artery disease, age, hypertension, obesity, cigarette smoking, physical activity and alcohol consumption as covariates for the model. Influence of ε2 and ε4 alleles on risk for hypercholesterolemia was accessed comparing with the reference allele ε3.
Individuals carrying the ε2 allele showed lower total and LDL cholesterol and apoB, as well as higher HDL cholesterol (p < 0.05) compared with the ε3 and ε4 carriers in NL group (Table 3). No differences were observed on basal plasma lipids in HC group according to APOE genotypes.
Table 3.
Influence of APOE polymorphisms on basal serum lipids in normolipidemic and hipercholesterolemic individuals
| Parameter | ε2 | ε3 | ε4 | p-value |
|---|---|---|---|---|
| Normolipidemics | (18) | (111) | (43) | -- |
| Total cholesterol, mg/dL | 160 ± 23a | 173 ± 18b | 177 ± 15b | 0.003 |
| LDL cholesterol, mg/dL | 81 ± 18a | 99 ± 18b | 105 ± 16b | < 0.001 |
| HDL cholesterol, mg/dL | 65 ± 11a | 57 ± 12b | 56 ± 12b | 0.023 |
| VLDL cholesterol, mg/dL | 14 ± 5 | 17 ± 6 | 16 ± 5 | 0.179 |
| Triglycerides, mg/dL | 72 ± 25 | 84 ± 28 | 80 ± 26 | 0.179 |
| ApoAI, mg/dL | 150 ± 20 | 140 ± 25 | 137 ± 31 | 0.205 |
| ApoB, mg/dL | 71 ± 19a | 86 ± 23b | 90 ± 22b | 0.011 |
| Hypercholesterolemics | (5) | (120) | (55) | -- |
| Total cholesterol, mg/dL | 253 ± 25 | 271 ± 43 | 267 ± 31 | 0.668 |
| LDL cholesterol, mg/dL | 166 ± 22 | 183 ± 39 | 181 ± 25 | 0.622 |
| HDL cholesterol, mg/dL | 62 ± 18 | 57 ± 14 | 56 ± 13 | 0.679 |
| Triglycerides, mg/dL | 133 ± 42 | 151 ± 71 | 148 ± 52 | 0.713 |
| VLDL cholesterol, mg/dL | 27 ± 8 | 30 ± 14 | 30 ± 10 | 0.713 |
| ApoAI, mg/dL | 140 ± 34 | 138 ± 29 | 132 ± 19 | 0.418 |
| ApoB, mg/dL | 128 ± 29 | 143 ± 28 | 143 ± 25 | 0.450 |
Number of individuals is in parenthesis. Values are expressed as media ± SD and compared by one way ANOVA. HC, hypercholesterolemic; NL, normolipidemic; LDL, low density lipoprotein; HDL, high density lipoprotein; VLDL, very low density lipoprotein; ApoAI, apolipoprotein AI; ApoB, apolipoprotein B. ε2 represent ε2ε2 and ε2ε3 carriers; ε3 symbolize ε3ε3 genotype and ε4 represent ε3ε4 and ε4ε4 individuals. a, b, different letters at the same line represent statistical significance. Conversion factors to convert to Systeme Internacional (SI) units are 0.02586 for cholesterol (mmol/l), 0.01129 for triglycerides (mmol/l) and 0.01 for apolipoproteins (g/l).
Association between APOE genotypes and basal plasma lipids in NL and HC individual was further explored in a multiple linear regression analysis adjusted for covariates gender, age, ethnics, hypertension, obesity, family history of CAD, physical activity, cigarette smoking and alcohol consumption. In women group, menopause status did not modified APOE genotypes effects, therefore this variable was not included in the regression analysis. In NL group, the presence of ε2 allele was associated with a significant decrease of 11.6, 18.1 and 13.8 mg/dL in values of total cholesterol, LDL cholesterol and apoB, respectively (Table 4). Moreover, ε2 allele was also associated with an increment of 9 mg/dL of HDL cholesterol. On the other hand, presence of ε4 allele was related to an increment of 6.7, 8.8 and 9.0 of total cholesterol, LDL cholesterol and apoB, respectively (Table 4). Confirming the previous results, we did not found any association between APOE genotypes and basal plasma lipids in HC individuals in the multiple linear regression model (data not shown).
Table 4.
Influence of APOE genotypes on basal serum lipids in normolipidemic individuals by multiple linear regression analysis
| Variable | ε2 | p-value | ε3 | p-value | ε4 | p-value |
|---|---|---|---|---|---|---|
| B (SE) | B (SE) | B (SE) | ||||
| Total cholesterol | -11.6 (5.3) | 0.030 | -1.0 (3.3) | 0.753 | 6.7 (3.3) | 0.047 |
| LDL cholesterol | -18.1 (5.2) | 0.001 | -0.7 (3.4) | 0.847 | 8.8 (3.4) | 0.010 |
| HDL cholesterol | 9.0 (3.4) | 0.009 | -1.2 (2.2) | 0.568 | -1.8 (2.2) | 0.399 |
| VLDL cholestrol | -1.8 (1.5) | 0.236 | 0.8 (0.9) | 0.352 | -0.3 (0.9) | 0.799 |
| ApoB | -13.8 (6.9) | 0.046 | -2.6 (4.2) | 0.534 | 9.0 (4.5) | 0.047 |
| ApoAI | 11.3 (7.6) | 0.138 | 0.7 (4.5) | 0.879 | -5.4 (4.9) | 0.269 |
B and (SE) represent regression coefficient and standard error and are expressed in mg/dL. B values were obtained from multiple linear regression analysis introducing gender, ethnics, family history of coronary artery disease, age, hypertension, obesity, cigarette smoking, physical activity and alcohol consumption as covariates. HDL, high density lipoprotein; LDL, low density lipoprotein; VLDL, very low density lipoprotein; apoB, apolipoprotein B; apoAI, apolipotrotein AI. Conversion factors to convert to Systeme Internacional (SI) units are 0.02586 for cholesterol (mmol/l), 0.01129 for triglycerides (mmol/l) and 0.01 for apolipoproteins (g/l).
No differences were observed on APOE mRNA expression according to APOE ε2/ε3/ε4 genotypes (p > 0.05, data not shown). Moreover the genotype distribution among APOE mRNA expression level groups was similar (χ2 = 0.695, 4 df, p = 0.952; data not shown).
Atorvastatin treatment reduced the plasma lipids with exception of apoAI in ATORVA group (Additional file 1). Results of CK and ALT demonstrated that there were no muscle or liver adverse reaction cases during the four-week atorvastin treatment (data not shown).
APOE genotypes did not influence basal and post-treatment plasma lipids in individuals treated with atorvastatin (Table 5). Further multiple linear regression analysis confirmed these results (data not shown). Moreover, 10 mg/day atorvastatin treatment did not modify the APOE mRNA expression (p > 0.05; Figure 1A). Despite the absence of atorvastatin effects on APOE mRNA expression, those individuals without LDL cholesterol goal achievement according to the IV Brazilian Guidelines for Dyslipidemia and Atherosclerosis Prevention [8] had lower expression (p = 0.009; Figure 1B) than patients with desirable response after the treatment.
Table 5.
Influence of APOE genotypes on serum lipids in hypercholesterolemic individuals treated with atorvastatin (10 mg/day/4-weeks)
| Parameter | ε2 (5) | ε3 (92) | ε4 (44) | p-value | |
|---|---|---|---|---|---|
| Total cholesterol, | Basal | 253 ± 25 | 284 ± 39 | 275 ± 27 | 0.100 |
| mg/dL | Treatment | 174 ± 28 | 198 ± 31 | 198 ± 27 | 0.285 |
| Change, % | -32 ± 6 | -30 ± 10 | -28 ± 8 | 0.332 | |
| LDL cholesterol, | Basal | 166 ± 22 | 194 ± 37 | 188 ± 21 | 0.166 |
| mg/dL | Treatment | 96 ± 20 | 116 ± 28 | 119 ± 22 | 0.262 |
| Change, % | -42 ± 9 | -40 ± 13 | -37 ± 10 | 0.408 | |
| HDL cholesterol, | Basal | 62 ± 18 | 57 ± 15 | 55 ± 11 | 0.534 |
| mg/dL | Treatment | 55 ± 14 | 55 ± 14 | 53 ± 10 | 0.745 |
| Change, % | -11 ± 11 | -3 ± 11 | -3 ± 9 | 0.270 | |
| VLDL cholesterol, | Basal | 27 ± 8 | 32 ± 14 | 31 ± 11 | 0.672 |
| mg/dL | Treatment | 24 ± 12 | 26 ± 12 | 26 ± 9 | 0.880 |
| Change, % | -10 ± 38 | -14 ± 30 | -12 ± 25 | 0.902 | |
| Triglycerides, | Basal | 133 ± 42 | 159 ± 72 | 155 ± 53 | 0.672 |
| mg/dL | Treatment | 118 ± 58 | 130 ± 58 | 131 ± 43 | 0.880 |
| Change, % | -10 ± 38 | -14 ± 30 | -12 ± 25 | 0.902 | |
| ApoAI, | Basal | 140 ± 34 | 138 ± 29 | 132 ± 19 | 0.418 |
| mg/dL | Treatment | 151 ± 54 | 140 ± 28 | 133 ± 24 | 0.259 |
| Change, % | +6 ± 16 | +2 ± 11 | +1 ± 13 | 0.650 | |
| ApoB, | Basal | 128 ± 29 | 143 ± 28 | 143 ± 25 | 0.532 |
| mg/dL | Treatment | 97 ± 23 | 99 ± 21 | 97 ± 19 | 0.984 |
| Change, % | -24 ± 7 | -30 ± 13 | -31 ± 11 | 0.494 |
Number of individuals is in parenthesis. -/+ symbols in change indicate reduction or increment of each parameter. Values are presented as media ± SD and compared by one way ANOVA. LDL, low density lipoprotein; HDL, high density lipoprotein; VLDL, very low density lipoprotein. ε2 : ε2ε2 and ε2ε3 genotypes; ε3: ε3ε3 genotype; ε4: ε3ε4 and ε4ε4 genotypes. Conversion factors to convert to Systeme Internacional (SI) units are 0.02586 for cholesterol (mmol/l), 0.01129 for triglycerides (mmol/l) and 0.01 for apolipoproteins (g/l).
Discussion
Diverse studies have proposed an important role of the APOE in hypercholesterolemia and statin response based in this association with APOE ε2/ε3/ε4 genotypes, but little information is known about the relationship of these variables with the expression status of APOE. Here, we describe the mRNA expression profile in PBMC from NL individuals and HC patients treated with atorvastatin.
Absence or structural mutations of APOE cause significant disorders in lipid metabolism and cardiovascular diseases. Deficiency of apoE results in massive accumulation of remnant lipoproteins, leading to severe hypercholesterolemia and atherosclerosis in human and apoE knockout mice [1]. Here, we reported that HC individuals have lower APOE mRNA expression than NL individuals, which is concordant with the previous information related to apoE deficiency.
The APOE mRNA expression is extremely complex with regulation in a tissue-specific manner and in response to cellular changes and extra and intra-cellular factors [1]. The expression of cholesterol acceptors in the efflux process such as apoAI, as well as transporter proteins involved in this process have been described to activate APOE transcription in human adipocytes and macrophages [9,10]. Accordingly, we observed that individuals with low expression of APOE present a decreased apoAI plasma concentration. Moreover, we also reported that these individuals have increased concentrations of total and LDL cholesterol and apoB. The relation of plasma levels of LDL cholesterol with APOE expression in PBMC was previously reported in children with obesity [11]. The increased concentrations of particles which depend on the LDL receptor (LDLR) for their clearance from plasma is consistent with the key role of apoE as a high affinity ligand for the LDLR in the cholesterol homeostasis [12].
APOE allele frequencies have demonstrated to be heterogeneous among different populations, but the ε3 allele is almost invariably the most common and ε2 the rarest allele [13]. In this study, the frequencies of APOE alleles observed in the overall population (ε2: 5%, ε3: 79% and ε4:16%) were similar to earlier studies in European descendant population [13,14], African American [15] and Brazilian populations [16].
Several genetic factors have been related to hypercholesterolemia, however in most of the cases the contribution of these genetic factors to the risk for hypercholesterolemia depends on environmental factors. Our results showed differences in genotype and allele frequencies between normolipidemic and hypercholesterolemic groups, suggesting that APOE ε2 allele confers protection against hypercholesterolemia. This characteristic persists even after adjustment for covariates that have been largely associated with hypercholestolemia, such as gender, ethnics, history of CAD, age, hypertension, obesity, cigarette smoking and physical activity, suggesting that APOE ε2 could be considered an independent factor that protect against hypercholesterolemia in our sample population.
Ferreira and co-workers [16] did not found differences in APOE ε2/ε3/ε4 genotypes between normolipidemic and dyslipidemic Brazilian individuals. On the other hand, and in line with our results, it has been reported higher frequency of ε2 allele in normolipidemic than hypercholesterolemic individuals from South America [17]. Moreover, a previous study in the Brazilian population reported that, compared with the ε2 allele, the presence of ε3 allele increases more than two times the risk for dyslipidemia (OR: 2.31, CI:1.06-5.06) [18], which is in agreement with our results.
The effects of APOE polymorphisms on plasma lipids have been described by several studies and the evidence suggests that APOE ε2 is associated with lower, whereas ε4 with higher, concentrations of plasma total cholesterol, LDL cholesterol and apoB in comparison with the ε3 allele [19]. We reported a less atherogenic lipid profile of ε2 allele, as well as a contribution of ε4 allele for higher total and LDL cholesterol and apoB in normolipidemic individuals. However, the association between APOE polymorphisms and plasma lipids were detected exclusively in the normolipidemic group. In agreement with this characteristic, an association of APOE genotypes with basal plasma lipids in normolipidemic individuals, but not in dyslipidemic patients, was previously reported in our population [16]. The authors described that ε2 allele carriers had significantly lower total, LDL and non-HDL cholesterol compared to ε3 and ε4 allele carriers only in normolipidemic individuals. Moreover, other studies were not able to demonstrate any association between APOE ε2/ε3/ε4 genotypes and total and LDL cholesterol in patients with familial hypercholestolemia [20] and polygenic dyslipidemia [21,22]. Nerveless, the lack of association of APOE polymorphisms with plasma lipids in hypercholesterolemic patients in our sample seems to be attributable to the small number of individuals carrying the ε2 allele that could be considered an important limitation of our study.
The variation on plasma lipids according to APOE ε2/ε3/ε4 genotypes are believed to stem mainly from structural and biophysical properties of apoE isoforms [3]. ApoE4-containing lipoproteins exhibit a high binding ability to their receptors that cause a more efficient catabolism and an accelerated clearance of chylomicrons and VLDL-remnants, leading to down regulation of LDLR and HMGCR and to increased LDL cholesterol levels in plasma. On the contrary, lipoproteins containing the apoE2 isoform present lower affinity compared to apoE4 and apoE3 isoforms that result in decreased cholesterol levels.
In the present study, no differences were observed in the change of lipid levels in response to atorvastatin treatment according to APOE genotypes. Although many studies have evaluated the influence of APOE polymorphism on statin response, some of these studies had controversial results. Whereas there is a strong line of evidence linking APOE ε2/ε3/ε4 genotypes with the efficacy of statin treatment [23-26], other studies did not reveal any association between APOE genotypes and response to treatments with various statins [27-29]. Commonly, evidence supports that APOE ε3 allele is associated with better response than ε4 allele in term of LDL cholesterol decrease and, in addition, individuals carrying the ε2 allele have greater reduction of LDL cholesterol than ε3 homozygotes [30]. These differences result from the improved activity of HMGCR in ε2 compared to ε3 allele carriers due to the modulation of intracellular cholesterol by the upregulation of hepatic LDLR, which has lower affinity for the apoE2 isoform that results in an improved response of ε2 allele carriers to the inhibition of HMGCR by statins. On the other hand, the LDLR presents higher affinity for apoE4 isoform and the effect of statin therapy is diminished in ε4 allele carriers when compared to ε2 or ε3 [3].
In the last years, GWAS have provided new perspectives and a more comprehensive approach for identifying genetic loci associated to statin response. Thompson et al. (2009), using a platform of 291, 988 SNPs did not observe any association between genotypes and atorvastatin response at beginning, when 1, 984 individuals were analyzed, however further analysis in 5745 individuals from the Treating to New Target (TNT) trial using a candidate gene approach reported a strong association between APOE ε2/ε3/ε4 genotypes and LDL cholesterol statin response [31]. Furthermore, a recent study has evaluated the response to diverse statins using a GWAS approach involving nearly 4, 000 individuals from three different trials of statin efficacy [Cholesterol and Pharmacogenetics (simvastatin), Pravastatin/Inflammation CRP evaluation (pravastatin) and TNT (atorvastatin)] [32]. The authors did not found any association between APOE SNPs and statin response, however the SNP rs4429638, located in the APOC1 gene and near APOE, was associated with change LDL cholesterol suggesting a possible involvement of APOE locus in statin efficacy.
Despite the number of studies investigating the response to statins according to APOE genotypes, the effect of HMGCR inhibitors on apoE protein and mRNA expression has been poorly studied, particularly using in vivo models. Atorvastatin and cerivastatin demonstrated to reduce apoE protein secretion and APOE mRNA expression in THP-1 derived macrophages after 24h of treatment in a dose dependent manner [33]. Conversely, in cultured human monocyte-derived macrophages, lovastatin increased APOE mRNA levels but decreased apoE secretion [34], phenomena that the authors attributed to the increase of apoE not destined for secretion. On the other hand, regarding in vivo studies, Guan et al. reported that APOE mRNA levels in mononuclear cells of hyperlipidemic diabetic patients taking simvastatin (5-10 mg/day) did not differ from those without statin treatment [35]. These contradictory results from in vitro experiments and the data reported for Guan and co-workers and our observations in PBMC from hypercholesterolemic individuals (not change after 10 mg/day atorvastatin treatment) could be explained by the differences in the cellular models used by the authors. Moreover, we observed that patients without LDL cholesterol goal achievement had lower APOE mRNA expression that could suggest a possible involvement of the modulation of this gene in the statin response.
Conclusions
Hypercholesterolemic patients had lower APOE mRNA levels than normolipidemic individuals and the APOE expression levels were associated with differences in the plasma lipid profile, corroborating the key role of the APOE in the cholesterol metabolism and suggesting that APOE mRNA expression may be a good marker for hypercholesterolemia in our sample population. Moreover, although there was no effect of ε2/ε3/ε4 polymorphisms on APOE gene expression, the presence of ε2 allele confers protection against hypercholesterolemia in Brazilian subjects. Moreover, there was no evidence of an involvement of APOE genotypes with atorvastatin lipid-lowering response and the atorvastatin treatment does not modify the mRNA expression in hypercholesterolemic subjects, however the low APOE mRNA expression after treatment showed by individuals with poor cholesterol lowering-response suggests a possible involvement of APOE level in atorvastatin response.
Methods
Study population and therapeutic protocol
Characteristic of study population and therapeutic protocol were previously described [36]. Three-hundred-sixty-two (255 women and 107 men, aged 29 to 81 y) individuals were randomly selected at the University Hospital of University of Sao Paulo and the Institute Dante Pazzanese of Cardiology, Sao Paulo city, Brazil. One-hundred-eighty-one subjects were classified as hypercholesterolemic (HC) according to the IV Brazilian Guidelines for Dyslipidemia and Atherosclerosis Prevention [8] and 181 were considered normolipidemics (NL) LDL cholesterol < 3.36 mmol/L (130 mg/dL)]. Individuals with diabetes mellitus; hypertriglyceridemia [triglycerides > 4.42 mmol/L (350 mg/dL)]; liver, renal or thyroid disease; pregnant women or under treatment of oral contraceptives; and other causes of secondary dyslipidemia were not included in the study.
HC individuals went through a four-week washout having a low fat diet according to the American Heart Association recommendation [37]. One-hundred-forty-one individuals from HC group had indication of lowering-cholesterol drug therapy in order to reach the LDL cholesterol goal according to the IV Brazilian Guidelines for Dyslipidemia and Atherosclerosis Prevention [8]. Afterwards, these individuals were treated with 10 mg/day of atorvastatin during 4 weeks (ATORVA group). Serum lipids were measured to evaluate atorvastatin cholesterol-lowering response. The study protocol was approved by the ethics committees of the Institute Dante Pazzanese of Cardiology, University Hospital and the School of Pharmaceutical Sciences of the University of the Sao Paulo. Each individual agreed to participate in the study by signing an informed consent.
Biochemical measurements
Blood samples were collected after an overnight (12 h) fast. ATORVA patients had blood drown previous and after the 4-week atorvastatin treatment. Plasma total cholesterol, HDL cholesterol and triglycerides were measured by routine enzymatic colorimetric methods. Plasma apo AI and apo B were measured by nephelometry. LDL and VLDL cholesterol were estimated by Friedewald formula [38]. Serum ALT and CK concentrations were determined by kinetic methods to evaluate atorvastatin effects on liver and muscle tissues.
APOE genotyping
Genomic DNA was extracted from EDTA-treated blood samples using salting out procedure [39]. SNPs rs7412 and rs429358, that determinate the APOE ε2, ε3 and ε4 alleles were analyzed by allelic discrimination using TaqMan real time PCR system. Validated SNP genotyping assays (ID number C_904973_1 for rs429358 and C_904973_1 for rs7412) were purchased from Applied Biosystems (Applied Biosystems, CA, USA). Both SNP genotyping reactions were optimized in a total volume of 8 μl using 20 ng of DNA and fluorescence was detected in a 7500 Fast Real-Time PCR system (Applied Biosystems, CA, USA). Control samples with known APOE genotypes were included in each PCR run, which were analyzed by the alternative PCR-RFLP method [40].
APOE mRNA quantification in PBMC
APOE mRNA expression was measured in individuals from NL (n = 88) and ATORVA (n = 94) groups. EDTA-anticoagulated blood samples were used to obtain peripheral blood mononuclear cells (PBMC) as previously described [41] and immediately used for RNA extraction. Total RNA was extracted from PMBC using TRIzol® Reagent (Invitrogen-Life Technologies, CA, USA) following the manufacturer's suggested protocol. RNA was dissolved in DEPC-treated water and the concentration was measured by spectrophotometry using the NanoDrop® (NanoDrop Technologies INC., DE, USA). RNA integrity was evaluated using the bioanalyzer®2100 (Agilent technologies, CA, USA). Samples with RNA integrity number (RIN) lower than 5 were not used for mRNA experiments. cDNA was produced from 1 μg of total RNA by Superscript™ II Reverse Transcriptase (Invitrogen-Life Technologies, CA, USA).
APOE mRNA expression was measured by quantitative TaqMan real-time PCR (qPCR). The assay ID Hs00171168_m1 was used to access the APOE mRNA detection. Genorm software http://medgen.ugent.be/genorm was used to select the most stable among six endogenous reference genes [ubiquitin C (UBC), glyceraldehyde-3-phosphate dehydrogenase (GAPD), beta-2-microglobulin (B2M), Hypoxanthine phosphoribosyl-transferase I (HPRTI), succinate dehydrogenase complex, subunit A (SDHA) and hydroxymethyl-bilane synthase (HMBS)], and the most stable in the experimental conditions was UBC. The sequence of primers and probes used for UBC are described allows: Forward, 5'-ATTTGGGTCGCGGTTCTTG-3'; reverse, 5'-TGCCTTGACATTCTCGAT GGT-3'; and probe, VIC -TCGTCACTTGACAATGC- MGB/NFQ. The qPCR assays were carried out in 96 well plates using a 7500 Fast Real-Time PCR system (Applied Biosystems, CA, USA). The relative quantification of APOE mRNA was calculated by the comparative Ct method using the formula 2-ΔCt [42].
Statistical Analysis
Statistical analyses were performed using SPSS v.15 for windows (SPSS Inc., Madrid, Spain) and Minitab v.15 statistical software (Minitab Inc. State College, PA). The allele frequencies and genotype distribution were estimated by gene counting. SNPanalyzer software v. 1.0 [43] was used to verify whether the genotypes distribution were in Hardy-Weinberg equilibrium (HWE) using the expectation-maximization algorithm. Differences in non-continuous variables, genotype and allelic distributions were compared by chi-square test. Normality distribution for all continuous variables was tested by Kolmogorov-Smirnov test and skewed variables were log transformed to improve normality for statistical analysis. Differences in mean values were evaluated by t-test or one-way ANOVA using Tukey post-hoc test. Paired t-test was used to analyze the effects of treatment in ATORVA group. In order to evaluate effects of APOE genotypes on the different variables, individuals were classified into three phenotypes: 1) E2 group, carrying the ε2ε2 and ε2ε3 genotypes; 2) E3 group, carrying the ε3ε3 genotypes; and 3) E4 group carrying either ε3ε4 or ε4ε4 genotypes. Individuals with the ε2ε4 were not assigned to any group and they were therefore excluded for the analysis. Mann Whitney U test or Kruskal-Wallis (two or three independent samples) or Wilcoxon signed rank test (pared samples) were used to evaluate differences in APOE mRNA gene expression. Correlations of APOE expression with other continuous variables were accessed by Spearman correlation test. Individuals were grouped in three groups (terciles) according to APOE expression values and plasma lipid concentrations were then compared among the groups using one-way ANOVA and Tukey post-hoc test. Multiple logistic regression analysis was used to examine the association of APOE genotypes with hypercholesterolemia including adjustment for relevant covariates. Multiple linear regression analysis was performed introducing variables of interest as dependent variables and APOE genotypes together to relevant covariates as independent variables, which regression coefficient were obtained for each independent variable. Statistical significance was set for p < 0.05.
List of abbreviations
ApoE: apolipoprotein E; APOE: apolipoprotein E gene; HDL: high density lipoprotein; LDL: low density lipoprotein; VLDL: very low density lipoprotein; LDLR, low density lipoprotein receptor; HMGCR: 3-hydroxy-3-methylglutaryl coenzyme A reductase; HC: hypercholesterolemic; NL: normolipidemic; ATORVA: group of patients treated with atorvastatin; PBMC; peripheral blood mononuclear cells; CAD: coronary artery disease; GWAS: genome-wide association studies; SNP: single nucleotide polymorphism.
Competing interests
The authors declare that they have no competing interests.
Authors' contributions
AC carried out the experimental procedures, patients' selection, analysis of data and drafted the manuscript. FDVG, MAVW and SSA contribute to patients' selection and experimental procedures. MMSB, ELD, MCB and AAF contribute to patients' selection and monitoring patients under study protocol. MHH and RDCH participated in the design of the study, interpretation of data and elaboration of the manuscript. All authors have read and approved the final manuscript.
Supplementary Material
Supplementary table. Influence of 10 mg/day/4-weeks atorvastatin treatment on plasma lipids in ATORVA group (n = 141). Lipid plasma concentrations in individuals of the ATORVA group at baseline and after 10 mg/day/4-weeks atorvastatin treatment.
Contributor Information
Alvaro Cerda, Email: alvarocerda@usp.br.
Fabiana DV Genvigir, Email: fdallavecchia@yahoo.com.br.
Maria AV Willrich, Email: malicewi@usp.br.
Simone S Arazi, Email: simone.sorkin@gmail.com.
Marcia MS Bernik, Email: marcia.bernik@uol.com.br.
Egidio L Dorea, Email: egidiodr@gmail.com.
Marcelo C Bertolami, Email: bertolami@uol.com.br.
Andre A Faludi, Email: afaludi@uol.com.br.
Mario H Hirata, Email: mhhirata@usp.br.
Rosario DC Hirata, Email: rosariohirata@usp.br.
Acknowledgements
The present study was supported by a grant from FAPESP (Protocol # 2009/15125-8). We thank the volunteers for their participation and physicians and nurses from the Medical Clinics Division of the University Hospital of the University of Sao Paulo for technical support during patient selection. Alvaro Cerda is a recipient of a fellowship from CONICYT-Chile, Mario H. Hirata and Rosario D.C. Hirata were recipients from CNPq-Brazil, and Fabiana D.V. Genvigir, Maria A.V. Willrich and Simone S. Arazi were recipients from FAPESP-Brazil.
References
- Greenow K, Pearce NJ, Ramji DP. The key role of apolipoprotein E in atherosclerosis. J Mol Med. 2005;83:329–342. doi: 10.1007/s00109-004-0631-3. [DOI] [PubMed] [Google Scholar]
- Strittmatter WJ, Bova Hill C. Molecular biology of apolipoprotein E. Curr Opin Lipidol. 2002;13:119–123. doi: 10.1097/00041433-200204000-00002. [DOI] [PubMed] [Google Scholar]
- Huang Y. Mechanisms linking apolipoprotein E isoforms with cardiovascular and neurological diseases. Curr Opin Lipidol. 2010;21:337–345. doi: 10.1097/MOL.0b013e32833af368. [DOI] [PubMed] [Google Scholar]
- Baigent C, Keech A, Kearney PM, Blackwell L, Buck G, Pollicino C, Kirby A, Sourjina T, Peto R, Collins R, Simes R. Efficacy and safety of cholesterol-lowering treatment: prospective meta-analysis of data from 90, 056 participants in 14 randomised trials of statins. Lancet. 2005;366:1267–1278. doi: 10.1016/S0140-6736(05)67394-1. [DOI] [PubMed] [Google Scholar]
- Mangravite LM, Thorn CF, Krauss RM. Clinical implications of pharmacogenomics of statin treatment. Pharmacogenomics J. 2006;6:360–374. doi: 10.1038/sj.tpj.6500384. [DOI] [PubMed] [Google Scholar]
- Zintzaras E, Kitsios GD, Triposkiadis F, Lau J, Raman G. APOE gene polymorphisms and response to statin therapy. Pharmacogenomics J. 2009;9:248–257. doi: 10.1038/tpj.2009.25. [DOI] [PubMed] [Google Scholar]
- Hirata RDC, Hirata MH. Genome-wide and candidate genes approach for pharmacogenomics of atorvastatin. Clinical Lipidology. 2009;4:419–423. doi: 10.2217/clp.09.32. [DOI] [Google Scholar]
- Sposito AC, Caramelli B, Fonseca FA, Bertolami MC, Afiune Neto A, Souza AD, Lottenberg AM, Chacra AP, Faludi AA, Loures-Vale AA. et al. IV Brazilian Guideline for Dyslipidemia and Atherosclerosis prevention: Department of Atherosclerosis of Brazilian Society of Cardiology. Arq Bras Cardiol. 2007;88(Suppl 1):2–19. doi: 10.1590/s0066-782x2007000700002. [DOI] [PubMed] [Google Scholar]
- Bencharif K, Hoareau L, Murumalla RK, Tarnus E, Tallet F, Clerc RG, Gardes C, Cesari M, Roche R. Effect of apoA-I on cholesterol release and apoE secretion in human mature adipocytes. Lipids Health Dis. 2010;9:75. doi: 10.1186/1476-511X-9-75. [DOI] [PMC free article] [PubMed] [Google Scholar]
- Von Eckardstein A, Langer C, Engel T, Schaukal I, Cignarella A, Reinhardt J, Lorkowski S, Li Z, Zhou X, Cullen P, Assmann G. ATP binding cassette transporter ABCA1 modulates the secretion of apolipoprotein E from human monocyte-derived macrophages. FASEB J. 2001;15:1555–1561. doi: 10.1096/fj.00-0798com. [DOI] [PubMed] [Google Scholar]
- Xiang W, Ma YL, Chen C, Fu SM, Yang JF, Zhao SP, Guo DX, Zhao DC, Nie S, Wang FL. Apolipoprotein E gene expression in peripheral blood monocyte in children with obesity. Zhonghua Er Ke Za Zhi. 2003;41:755–760. [PubMed] [Google Scholar]
- Pendse AA, Arbones-Mainar JM, Johnson LA, Altenburg MK, Maeda N. Apolipoprotein E knock-out and knock-in mice: atherosclerosis, metabolic syndrome, and beyond. J Lipid Res. 2009;50(Suppl):S178–182. doi: 10.1194/jlr.R800070-JLR200. [DOI] [PMC free article] [PubMed] [Google Scholar]
- Schiele F, De Bacquer D, Vincent-Viry M, Beisiegel U, Ehnholm C, Evans A, Kafatos A, Martins MC, Sans S, Sass C. et al. Apolipoprotein E serum concentration and polymorphism in six European countries: the ApoEurope Project. Atherosclerosis. 2000;152:475–488. doi: 10.1016/S0021-9150(99)00501-8. [DOI] [PubMed] [Google Scholar]
- Sima A, Iordan A, Stancu C. Apolipoprotein E polymorphism--a risk factor for metabolic syndrome. Clin Chem Lab Med. 2007;45:1149–1153. doi: 10.1515/CCLM.2007.258. [DOI] [PubMed] [Google Scholar]
- Cavallari LH, Langaee TY, Momary KM, Shapiro NL, Nutescu EA, Coty WA, Viana MA, Patel SR, Johnson JA. Genetic and clinical predictors of warfarin dose requirements in African Americans. Clin Pharmacol Ther. 2010;87:459–464. doi: 10.1038/clpt.2009.223. [DOI] [PubMed] [Google Scholar]
- Ferreira CN, Carvalho MG, Fernandes AP, Lima LM, Loures-Valle AA, Dantas J, Janka Z, Palotas A, Sousa MO. Comparative study of apolipoprotein-E polymorphism and plasma lipid levels in dyslipidemic and asymptomatic subjects, and their implication in cardio/cerebro-vascular disorders. Neurochem Int. 2010;56:177–182. doi: 10.1016/j.neuint.2009.09.016. [DOI] [PubMed] [Google Scholar]
- Arraiz N, Bermudez V, Prieto C, Sanchez MP, Escalona C, Sanz E, Rondon N, Reyes F, Velasco M. Association between apoliprotein E gene polymorphism and hypercholesterolemic phenotype in Maracaibo, Zulia state, Venezuela. Am J Ther. 2010;17:330–336. doi: 10.1097/MJT.0b013e3181c1235d. [DOI] [PubMed] [Google Scholar]
- Mendes-Lana A, Pena GG, Freitas SN, Lima AA, Nicolato RL, Nascimento-Neto RM, Machado-Coelho GL, Freitas RN. Apolipoprotein E polymorphism in Brazilian dyslipidemic individuals: Ouro Preto study. Braz J Med Biol Res. 2007;40:49–56. doi: 10.1590/S0100-879X2007000100007. [DOI] [PubMed] [Google Scholar]
- Gronroos P, Raitakari OT, Kahonen M, Hutri-Kahonen N, Marniemi J, Viikari J, Lehtimaki T. Influence of apolipoprotein E polymorphism on serum lipid and lipoprotein changes: a 21-year follow-up study from childhood to adulthood. The Cardiovascular Risk in Young Finns Study. Clin Chem Lab Med. 2007;45:592–598. doi: 10.1515/CCLM.2007.116. [DOI] [PubMed] [Google Scholar]
- Christidis DS, Liberopoulos EN, Kakafika AI, Miltiadous GA, Cariolou M, Ganotakis ES, Mikhailidis DP, Elisaf MS. The effect of apolipoprotein E polymorphism on the response to lipid-lowering treatment with atorvastatin or fenofibrate. J Cardiovasc Pharmacol Ther. 2006;11:211–221. doi: 10.1177/1074248406293732. [DOI] [PubMed] [Google Scholar]
- Kathiresan S, Willer CJ, Peloso GM, Demissie S, Musunuru K, Schadt EE, Kaplan L, Bennett D, Li Y, Tanaka T. et al. Common variants at 30 loci contribute to polygenic dyslipidemia. Nat Genet. 2009;41:56–65. doi: 10.1038/ng.291. [DOI] [PMC free article] [PubMed] [Google Scholar]
- Willer CJ, Sanna S, Jackson AU, Scuteri A, Bonnycastle LL, Clarke R, Heath SC, Timpson NJ, Najjar SS, Stringham HM. et al. Newly identified loci that influence lipid concentrations and risk of coronary artery disease. Nature Genetics. 2008;40:161–169. doi: 10.1038/ng.76. [DOI] [PMC free article] [PubMed] [Google Scholar]
- Takane H, Miyata M, Burioka N, Shigemasa C, Shimizu E, Otsubo K, Ieiri I. Pharmacogenetic determinants of variability in lipid-lowering response to pravastatin therapy. J Hum Genet. 2006;51:822–826. doi: 10.1007/s10038-006-0025-1. [DOI] [PubMed] [Google Scholar]
- Marques-Vidal P, Bongard V, Ruidavets JB, Fauvel J, Perret B, Ferrieres J. Effect of apolipoprotein E alleles and angiotensin-converting enzyme insertion/deletion polymorphisms on lipid and lipoprotein markers in middle-aged men and in patients with stable angina pectoris or healed myocardial infarction. Am J Cardiol. 2003;92:1102–1105. doi: 10.1016/j.amjcard.2003.06.008. [DOI] [PubMed] [Google Scholar]
- Thompson JF, Man M, Johnson KJ, Wood LS, Lira ME, Lloyd DB, Banerjee P, Milos PM, Myrand SP, Paulauskis J. et al. An association study of 43 SNPs in 16 candidate genes with atorvastatin response. Pharmacogenomics J. 2005;5:352–358. doi: 10.1038/sj.tpj.6500328. [DOI] [PubMed] [Google Scholar]
- Donnelly LA, Palmer CN, Whitley AL, Lang CC, Doney AS, Morris AD, Donnan PT. Apolipoprotein E genotypes are associated with lipid-lowering responses to statin treatment in diabetes: a Go-DARTS study. Pharmacogenet Genomics. 2008;18:279–287. doi: 10.1097/FPC.0b013e3282f60aad. [DOI] [PubMed] [Google Scholar]
- Vega GL, Weiner M, Kolsch H, von Bergmann K, Heun R, Lutjohan D, Nguyen A, Moore C. The effects of gender and CYP46 and apo E polymorphism on 24S-hydroxycholesterol levels in Alzheimer's patients treated with statins. Curr Alzheimer Res. 2004;1:71–77. doi: 10.2174/1567205043480546. [DOI] [PubMed] [Google Scholar]
- Pena R, Lahoz C, Mostaza JM, Jimenez J, Subirats E, Pinto X, Taboada M, Lopez-Pastor A. Effect of apoE genotype on the hypolipidaemic response to pravastatin in an outpatient setting. J Intern Med. 2002;251:518–525. doi: 10.1046/j.1365-2796.2002.00991.x. [DOI] [PubMed] [Google Scholar]
- Fiegenbaum M, da Silveira FR, Van der Sand CR, Van der Sand LC, Ferreira ME, Pires RC, Hutz MH. Pharmacogenetic study of apolipoprotein E, cholesteryl ester transfer protein and hepatic lipase genes and simvastatin therapy in Brazilian subjects. Clin Chim Acta. 2005;362:182–188. doi: 10.1016/j.cccn.2005.06.005. [DOI] [PubMed] [Google Scholar]
- Nieminen T, Kahonen M, Viiri LE, Gronroos P, Lehtimaki T. Pharmacogenetics of apolipoprotein E gene during lipid-lowering therapy: lipid levels and prevention of coronary heart disease. Pharmacogenomics. 2008;9:1475–1486. doi: 10.2217/14622416.9.10.1475. [DOI] [PubMed] [Google Scholar]
- Thompson JF, Hyde CL, Wood LS, Paciga SA, Hinds DA, Cox DR, Hovingh GK, Kastelein JJ. Comprehensive whole-genome and candidate gene analysis for response to statin therapy in the Treating to New Targets (TNT) cohort. Circ Cardiovasc Genet. 2009;2:173–181. doi: 10.1161/CIRCGENETICS.108.818062. [DOI] [PubMed] [Google Scholar]
- Barber MJ, Mangravite LM, Hyde CL, Chasman DI, Smith JD, McCarty CA, Li X, Wilke RA, Rieder MJ, Williams PT. et al. Genome-wide association of lipid-lowering response to statins in combined study populations. PLoS One. 2010;5:e9763. doi: 10.1371/journal.pone.0009763. [DOI] [PMC free article] [PubMed] [Google Scholar]
- Castilho LN, Chamberland A, Boulet L, Davignon J, Cohn JS, Bernier L. Effect of atorvastatin on ApoE and ApoC-I synthesis and secretion by THP-1 macrophages. J Cardiovasc Pharmacol. 2003;42:251–257. doi: 10.1097/00005344-200308000-00015. [DOI] [PubMed] [Google Scholar]
- Cignarella A, Brennhausen B, von Eckardstein A, Assmann G, Cullen P. Differential effects of lovastatin on the trafficking of endogenous and lipoprotein-derived cholesterol in human monocyte-derived macrophages. Arterioscler Thromb Vasc Biol. 1998;18:1322–1329. doi: 10.1161/01.ATV.18.8.1322. [DOI] [PubMed] [Google Scholar]
- Guan JZ, Tamasawa N, Murakami H, Matsui J, Tanabe J, Matsuki K, Yamashita M, Suda T. HMG-CoA reductase inhibitor, simvastatin improves reverse cholesterol transport in type 2 diabetic patients with hyperlipidemia. J Atheroscler Thromb. 2008;15:20–25. doi: 10.5551/jat.E512. [DOI] [PubMed] [Google Scholar]
- Genvigir FD, Soares SA, Hirata MH, Willrich MA, Arazi SS, Rebecchi IM, Oliveira R, Bernik MM, Dorea EL, Bertolami MC, Hirata RD. Effects of ABCA1 SNPs, including the C-105T novel variant, on serum lipids of Brazilian individuals. Clin Chim Acta. 2008;389:79–86. doi: 10.1016/j.cca.2007.11.029. [DOI] [PubMed] [Google Scholar]
- Chahoud G, Aude YW, Mehta JL. Dietary recommendations in the prevention and treatment of coronary heart disease: do we have the ideal diet yet? Am J Cardiol. 2004;94:1260–1267. doi: 10.1016/j.amjcard.2004.07.109. [DOI] [PubMed] [Google Scholar]
- Friedewald WT, Levy RI, Fredrickson DS. Estimation of the concentration of low-density lipoprotein cholesterol in plasma, without use of the preparative ultracentrifuge. Clin Chem. 1972;18:499–502. [PubMed] [Google Scholar]
- Cerda A, Genvigir FD, Arazi SS, Hirata MH, Dorea EL, Bernik MM, Bertolami MC, Faludi AA, Hirata RD. Influence of SCARB1 polymorphisms on serum lipids of hypercholesterolemic individuals treated with atorvastatin. Clin Chim Acta. 2010;411:631–637. doi: 10.1016/j.cca.2010.01.002. [DOI] [PubMed] [Google Scholar]
- Salazar LA, Hirata MH, Giannini SD, Forti N, Diament J, Lima TM, Hirata RD. Seven DNA polymorphisms at the candidate genes of atherosclerosis in Brazilian women with angiographically documented coronary artery disease. Clin Chim Acta. 2000;300:139–149. doi: 10.1016/S0009-8981(00)00308-9. [DOI] [PubMed] [Google Scholar]
- Cerda A, Genvigir FD, Rodrigues AC, Willrich MA, Dorea EL, Bernik MM, Arazi SS, Oliveira R, Hirata MH, Hirata RD. Influence of Polymorphisms and Cholesterol-Lowering Treatment on SCARB1 mRNA Expression. J Atheroscler Thromb. 2011;18:640–651. doi: 10.5551/jat.6544. [DOI] [PubMed] [Google Scholar]
- Livak KJ, Schmittgen TD. Analysis of relative gene expression data using real-time quantitative PCR and the 2(-Delta Delta C(T)) Method. Methods. 2001;25:402–408. doi: 10.1006/meth.2001.1262. [DOI] [PubMed] [Google Scholar]
- Yoo J, Seo B, Kim Y. SNPAnalyzer: a web-based integrated workbench for single-nucleotide polymorphism analysis. Nucleic Acids Res. 2005;33:W483–488. doi: 10.1093/nar/gki428. [DOI] [PMC free article] [PubMed] [Google Scholar]
Associated Data
This section collects any data citations, data availability statements, or supplementary materials included in this article.
Supplementary Materials
Supplementary table. Influence of 10 mg/day/4-weeks atorvastatin treatment on plasma lipids in ATORVA group (n = 141). Lipid plasma concentrations in individuals of the ATORVA group at baseline and after 10 mg/day/4-weeks atorvastatin treatment.