Abstract
Purpose: To commission a small-field biological irradiator, the XRad225Cx from Precision x-Ray, Inc., for research use. The system produces a 225 kVp x-ray beam and is equipped with collimating cones that produce both square and circular radiation fields ranging in size from 1 to 40 mm. This work incorporates point, 2D, and 3D measurements to determine output factors (OF), percent-depth-dose (PDD) and dose profiles at multiple depths.
Methods: Three independent dosimetry systems were used: ion-chambers (a farmer chamber and a micro-ionisation chamber), 2D EBT2 radiochromic film, and a novel 3D dosimetry system (DLOS/PRESAGE®). Reference point dose rates and output factors were determined from in-air ionization chamber measurements for fields down to ∼13 mm using the formalism of TG61. PDD, profiles, and output factors at three separate depths (0, 0.5, and 2 cm), were determined for all field sizes from EBT2 film measurements in solid water. Several film PDD curves required a scaling correction, reflecting the challenge of accurate film alignment in very small fields. PDDs, profiles, and output factors were also determined with the 3D DLOS/PRESAGE® system which generated isotropic 0.2 mm data, in scan times of 20 min.
Results: Surface output factors determined by ion-chamber were observed to gradually drop by ∼9% when the field size was reduced from 40 to 13 mm. More dramatic drops were observed for the smallest fields as determined by EBT∼18% and ∼42% for the 2.5 mm and 1 mm fields, respectively. PRESAGE® and film output factors agreed well for fields <20 mm (where 3D data were available) with mean deviation of 2.2% (range 1%–4%). PDD values at 2 cm depth varied from ∼72% for the 40 mm field, down to ∼55% for the 1 mm field. EBT and PRESAGE® PDDs agreed within ∼3% in the typical therapy region (1–4 cm). At deeper depths the EBT curves were slightly steeper (2.5% at 5 cm). These results indicate good overall consistency between ion-chamber, EBT2 and PRESAGE® measured OFs, PDDs, and profiles.
Conclusions: The combination of independent 2D and 3D measurements was found to be valuable to ensure accurate and comprehensive commissioning. Film measurements were time consuming and challenging due to the difficulty of film alignment in small fields. PRESAGE® 3D measurements were comprehensive and efficient, because alignment errors are negligible, and all parameters for multiple fields could be obtained from a single dosimeter and scan. However, achieving accurate superficial data (within 4 mm) is not yet feasible due to optical surface artifacts.
Keywords: X-ray irradiator, small field, dosimetry, 3D dosimetry
INTRODUCTION
The ability to genetically engineer mice to make specific gene mutations within specific cell types opens new opportunities to dissect mechanisms of normal tissue injury from radiation1 and to understand mechanisms of tumor control following radiation therapy.2 To take full advantage of these and other small animal models, there is currently significant interest in small-field irradiators, which will allow radiation to be delivered to a primary tumor or a single organ. Current generation small animal irradiators have the capacity to irradiate volumes as small as 1 mm3. When combined with imaged-guided delivery, parts of a mouse organ can be irradiated to study the relation between dose, volume, and normal tissue complications. The small animal irradiator investigated here (Model XRad225Cx, Precision X-Ray Inc., North Branford CT) is capable of producing small fields, ranging in size from 40 to 1 mm and x-ray energies from 20 to 225 kVp. Accurate field placement is achieved through image-guidance procedures using cone beam CT. The task of commissioning the XRad225Cx for research work involves measuring, for all fields, absolute dose rates, relative output factors, central axis percent depth dose (PDD) curves, and profiles at multiple depths. These measurements are challenging, due to the small field sizes.
In this work, we apply three independent dosimetry tools to attempt to determine accurate and robust commissioning data for these very small fields. Ion-chambers were used to determine absolute reference dose rates for all fields >10 mm. Below this size, ion-chamber readings were not accurate due to partial volume averaging. Radiochromic EBT2 film (Model Gafchromic® EBT2, International Specialty Products, Wayne NJ) was used to determine output factors, 2D axial profiles, and PDDs for all fields, including those <10 mm. EBT2 PDD measurements were challenging because of the difficulty of precise alignment to the central axis. Independent measurements were therefore also performed on the smaller fields with a new 3D dosimetry technique DLOS/PRESAGE® (Duke Large field-of-view Optical-CT-Scanner).3, 4 A key advantage of 3D techniques is that alignment and set-up-errors are negligible because the entire dose distribution is captured in the dosimeter. PDD measurements, in particular, should be more robust. 3D techniques have the potential to be much more efficient because all parameters of interest (OFs, multidepth profiles, and PDDs) can be obtained from a single dosimeter and a single scan.
The challenges posed by megavoltage small-field dosimetry5, 6, 7, 8, 9, 10, 11, 12 and irradiators,13 have received much recent interest. EBT2 film has found wide application because of convenience, availability, lack of need for processing, high resolution, and tissue equivalence. Achieving accurate data with EBT2 can be challenging, however, and requires following a strict read-out protocol (see Sec. 2C).14, 15, 16 3D dosimetry techniques, which have unique potential and suitability for small-field dosimetry, have also been used with success.8, 9, 10, 12, 17 The combination of these two techniques has also been attempted.10, 18, 19 The present work represents the first application of 3D radiochromic dosimetry and DLOS/PRESAGE® to commissioning a micro-irradiator.
METHODS
Section 2A introduces the small-field irradiator including basic capabilities and specifications. Sections 2B, 2C discuss the ion-chamber and film measurements, respectively, that comprise the one and two dimensional data collection. Section 2D describes the three-dimensional dosimetry data collected with the DLOS/PRESAGE® system.
The small-field irradiator
The XRAD225Cx small–field irradiator incorporates a high-dose rate x-ray source with energy in the range 20–225 kVp, and dose rates ranging from 10 to 400 cGy/min at isocenter. This source is used both for small animal irradiation, and cone beam CT imaging. The latter acquired with an electronic flat panel detector. An in depth description of functionality and image quality can be found in Clarkson et al.20 The XRAD225Cx is equipped with 11 removable cones which can be individually attached to the gantry. There are six rectangular cones which deliver field sizes from 40 × 40 to 10 × 10 mm2, and five circular cones delivering fields from 20 to 1 mm in diameter. Each cone has a length of 23 cm, and the isocenter is located ∼7 cm from end of the cones. This yields ∼14 cm of clearance under gantry rotation, restricting access for dosimetry tools (e.g., scanning water phantom). All dosimetry irradiations in this work were performed with a 225 kVp, 13 mA beam. The half-value layer for this energy was measured to be 1.00 mm of Cu (see Sec. 3A).
Absolute dosimetry measurements with ion-chamber
Absolute dose rates were determined for the largest field (40 × 40 mm2) following the TG61 protocol,21 using a 0.6 cc calibrated ion-chamber (Model NEL 2571, Nuclear Enterprises, Ltd., Fairfield, NJ). Measurements were acquired in air, at the source-to-axis distance, without a buildup cap. Conversion to dose at the water surface was achieved using the formalism and backscatter factors given in TG61. The NEL 2571 chamber was also used to determine timer error and source-to-axis distance. Timer error (i.e., the uncertainty in delivered dose caused by beam ramp-up time) was computed from chamber measurements acquired with increasing beam-on times, and graphically extrapolating the result to zero. Source-to-axis distance was computed from chamber measurements acquired at increasing distances (30–35 cm) from the end of the cone, and then fitting the measurements to an inverse distance-squared function. The half-value layer was obtained from measurements with a 0.14 cc ion-chamber (Model Pr-05P, Capintec Inc., Ramsey, NJ) on a 15 mm circular cone using copper sheets of varying thicknesses inserted in the path of the beam. The output factors of the five largest fields (i.e., fields >13 mm equivalent square) were also measured with the smaller Pr-05P chamber at the source-to-axis distance, in air and corrected using the backscatter factors from TG61.
2D EBT2 film measurements
Output factors were measured for all fields, at several depths (0, 0.5, and 2 cm), from films in solid water stacks (Soule Medical, Lutz, FL). Films were orientated perpendicular to the radiation field at the corresponding depth with the top of the stack positioned at the isocenter. The films were irradiated individually. PDD curves were also measured, for each field, from films aligned vertically along the central beam axis. Films were aligned to vertical and horizontal side lasers, which were in turn aligned to the radiation isocenter using Winston Lutz test. Alignment to lasers in this fashion is not perfect with an estimated accuracy of (±)1 mm. Accurate vertical alignment of the films was challenging. Each film was calibrated and scanned following the procedure described below.
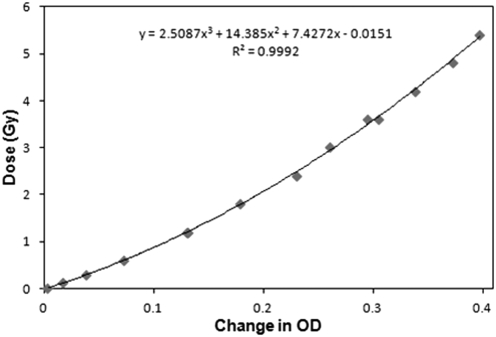
A calibration curve was obtained from 12 films placed at isocenter on the surface of a solid water stack, and irradiated with the largest 40 × 40 mm2 field to doses in the range 0–6 Gy (Fig. 1). The absolute doses delivered to the films were obtained from the NEL2571 TG61 measurement. A good fit was observed with a third order polynomial (R2 = 0.9992).
Figure 1.
EBT2 calibration curve measured with the 40 × 40 mm2 field. Optical densities (OD) are converted to dose using the fit equation.
All films were prescanned prior to irradiation with an Epson Expression 10000XL (Epson America Inc., Long Beach, CA) flatbed transmission scanner. Each film was scanned 3 times at 200 dpi resolution, and averaged to reduce noise. The scanner was allowed to warm up for 20 min prior to each scanning session. After irradiation, the films were stored in the dark overnight and were then rescanned approximately 24 h later. Consistent pre- and postscan film orientation was preserved to minimize polarization effects. The data were median filtered with a 5 × 5 kernel for all but the smallest two fields, the 2.5 and 1 mm circular fields, for which a 3 × 3 median filter was used. The median filter places an n × n filter patch over each pixel and extracts the n2 values covered by the patch. The value at each pixel is then replaced by the median of these n2 values. Tests confirmed the application of this filter did not appreciably reduce the output factors for the smallest fields. The 2D change in OD was computed for each film by subtracting the prescan from the postscan. Further information on reducing uncertainty in EBT2 dosimetry is available in the literature.22, 23
An x-ray-CT scan of the solid water stack revealed a CT# = 123 HU. This corresponds to a water-equivalent radiological path-length correction of 1.07, and this factor was used to scale the depth axis of all PDD curves. Due to the slope of the PDD curve, this depth scaling results in a change in dose at 5 cm of about 2.5% (Sec. 3B2).
Optical-CT/PRESAGE® 3D measurements
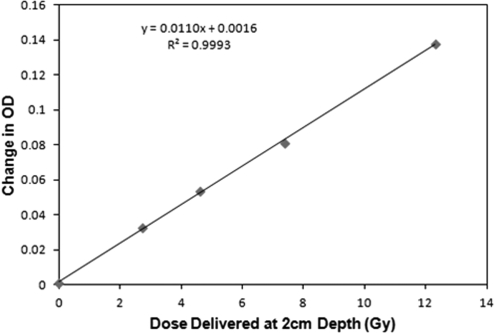
Independent verification of the PDDs, output factors and profiles for the smallest circular fields was made with the PRESAGE®/DLOS system.3, 4, 24, 25, 26 Measurements were performed on three separate cylindrical dosimeters. The first “calibration” dosimeter, was used to establish a response curve. The cylindrical calibration dosimeter was 9.5 cm diameter, and 8 cm tall, and was irradiated end-on with four vertical, equispaced, 15 mm diameter circular fields. All beams were 225 kVp and run at 13 mA. The surface doses were 4.4, 7.5, 12, and 20 Gy corresponding to beam times of 88, 149, 239, and 398 s, respectively. The doses at 2 cm depth (2.7, 4.6, 7.4, and 12.3 Gy) were estimated from the film data and corrected for density in PRESAGE®. PRESAGE® is well known to have a linear OD dose response, which was confirmed in this dosimeter as shown in Fig. 2. The data represent OD responses at a typical therapeutic depth of 2 cm in the PRESAGE® dosimeter.
Figure 2.
PRESAGE® calibration curve determined from four irradiations of the calibration dosimeter, with the 15 mm diameter field.
A second cylindrical “measurement” dosimeter, had a diameter of 11.5 cm and height of 9 cm, and was used to measure the PDD, OF’s, and profiles for the four smallest fields. The dosimeter was irradiated end-on with six equispaced vertical circular fields, each oriented parallel to the axis of the cylinder. This measurement was efficient, because all parameters for all fields were collected in a single dosimeter, in a single optical-CT scan. Cross-field leakage contamination, while likely very small at this energy, was nevertheless minimized by shielding the remainder of the dosimeter with a 3 mm thick lead sheet. The field-size/dose combinations were 20 mm/5.0 Gy, 20 mm/7.6 Gy, 15 mm/7.5 Gy, 10 mm/10.0 Gy, 2.5 mm/29.3 Gy, and 1 mm/56.4 Gy. These doses were calculated to optimally match the maximum optical attenuation though all projections to the dynamic range of the DLOS scanner.
A third and fourth dosimeter, the “PDD Vertical” and “PDD Side” dosimeters, (9.5 cm diameter and 8 cm height) were used to study the 15 mm field in more detail, and in particular, to attempt to get accurate dose readings close to the surface. Extra care was taken with the PDD Vertical dosimeter to ensure the top of this dosimeter (the incident surface for radiation) was smooth and flat. The meniscus lip on the outer edge of the top surface of the dosimeter was removed by sanding. This meniscus was observed on the measurement dosimeter, and caused loss of superficial data in the region 0–8 mm depth (Sec. 3C). The PDD Vertical/PDD Side dosimeters were irradiated to 7.6 Gy at the surface with a 15 mm circular vertical/side field through the center of the dosimeter, respectively.
Optical-CT readout
Optical-CT readout for 3D dosimetry is a well established technique.9, 27, 28, 29, 30 Here, the 3D dose distribution recorded in PRESAGE® was read out with the DLOS system which was recently commissioned for clinical use.3, 4 This in-house system is a modified version of an earlier prototype.31 The DLOS is a telecentric system which forms transmission images through the dosimeter from rays parallel to the optic axis to within 0.1° tolerance. The capability for strong stray-light rejection enhances the accuracy of DLOS optical-CT imaging. Prescans of each dosimeter were acquired with the DLOS before irradiation, and postscans were acquired within an hour after irradiation. All projections were flood and dark corrected. The 3D OD distribution was reconstructed by feeding projection data into an inverse radon transform (iradon MATLAB function, The MathWorks, Inc., Natick MA). The calibration and PDD dosimeters (Sec. 2D), which were irradiated with relatively large 15 mm diameter fields, were scanned with a protocol to yield isotropic 1 mm3 voxels. In accordance with Nyquist, 360 projections were acquired over 360°. The measurement dosimeter (irradiated with six small fields) was scanned with a protocol to yield isotropic 0.2 mm3 voxel sizes. 1000 projections were acquired over 180°. All projection images were averaged 20 times to reduce noise. The acquisition times for the 1 and 0.2 mm resolution scans were 8 and 22 min, respectively. All projection images were stray-light corrected using the algorithm described in Thomas et al.32 This represents a modest correction (1%–6%) for all but the smallest 1 mm field, where stray-light effects are most pronounced and the output needed to be corrected by ∼30%.
Low-Z PRESAGE® formulation
A new low-Z formulation of PRESAGE® (Zeff = 7.4) was used in this work, which is more tissue equivalent and has higher sensitivity than the regular MV photon formulation.24, 33 An x-ray-CT scan revealed a CT# = 90HU for the low-Z formulation, corresponding to a relative electron density to water of 1.05. This compares to 1.07 for the regular MV formulation. The CT# of low-Z PRESAGE® was thus closer to water than that of the commercial solid water used in the film measurements (Sec. 2C). The 1.05 factor was used to scale the depth axis of PRESAGE® PDD curves. Due to the slope of the PDD curve, this depth scaling results in a change in dose at 5 cm of about 2.5% (Sec. 3B2).
RESULTS AND DISCUSSION
Ion-chamber and absolute dosimetry measurements
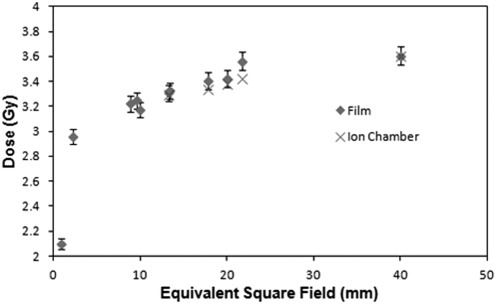
The output at isocenter for the 40 × 40 mm2 field at water surface was found to be 3.61 Gy/min for the 13 mA, 225 KVp beam. The source-to-axis distance was determined to be 30.76 cm. The timer error was determined to be ∼0.035s, which is negligible when compared to the typical irradiation time of 60 s. The half-value layer for 225 kVp was 1.00 mm of Cu. Output factors at isocenter, on the surface of solid water, for the five largest fields, as determined with the PR-05P chamber, are shown in Fig. 3.
Figure 3.
Absolute output factors (60 s irradiation with a 225 kVp 13 mA beam) determined at isocenter at the water surface (SSD = 30.76 cm).
EBT2 film data
Profiles
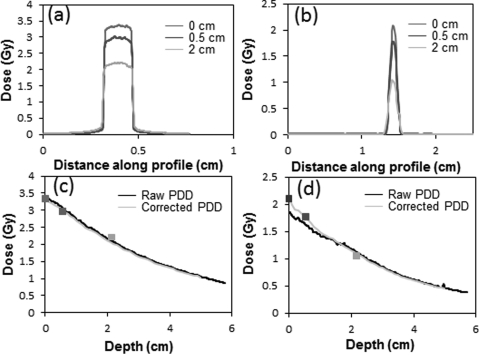
Representative and illustrative data are shown in Fig. 4 for the 15 and 1 mm fields. Beam profiles were measured for all 11 fields at three separate depths, using films orientated perpendicular to the beam. A relatively flat high-dose region is observed for the 15 mm circular field in Fig. 4a. The penumbra of the beam is seen to be very sharp, as expected at this energy. The 80%–20% penumbra values for the 40 × 40 mm2 field were ∼3mm. This reduced to <1 mm for all fields below 20× 20 mm2. The full-width-half-maximum of the profiles hardly changes over these depths. The noise level on the 15 mm field line profile was ∼1% (3 cGy for a 3 Gy delivery) after a five point median smoothing filter was applied. The 1 mm field produces a much sharper peak because of the small aperture size. For fields <5 mm, a three point median filter was used. Tests were performed to ensure that no peak suppression resulted.
Figure 4.
Beam profiles for the 15 mm circular field (a) and 1 mm circular field (b) at depths of 0 cm, 0.5 cm and 2 cm in solid water. (c) The PDD curve for the 15 mm circular field, and (d) for the 1 mm field. The three data markers in c and d indicate data from axial films where alignment errors were negligible.
PDD curves
Figures 4c, 4d illustrate the method for determining accurate PDDs. The black curve is the raw PDD measured by EBT2 films nominally aligned to the central axis. The yellow curves indicate the corrected PDD after scaling to match the relative outputs determined from the three axial films at depths of 0, 1, and 2 cm. These latter films had no alignment error and were thus taken as the gold standard. The raw PDDs were smoothed, and an adjustment factor applied to ensure the corrected PDD agreed with the accurate axial film data points. The adjustment factor was a combination of a shift and/or uniform/differential scaling with depth (differential scaling was only used when a single uniform scale factor could not be used to match the axial data points). The approximate and nonideal nature of this process highlights the need for independent verification with the 3D dosimetry system, which avoids the alignment error issue. The 1 mm circular field [Fig. 4d] is an example of a field where the raw PDD did not match the axial measurements very well. It is clear that this data needed to be scaled significantly above 1.5 cm depth. Only minor scaling was needed for the 15 mm field as can be seen by the agreement of the black and orange curves in [Fig. 4c]. While we can be confident of the accuracy of the corrected film PDD curves in the region where axial measurements exist (at depths <2 cm), the uncertainty in accuracy increases at deeper depths, and is not well known.
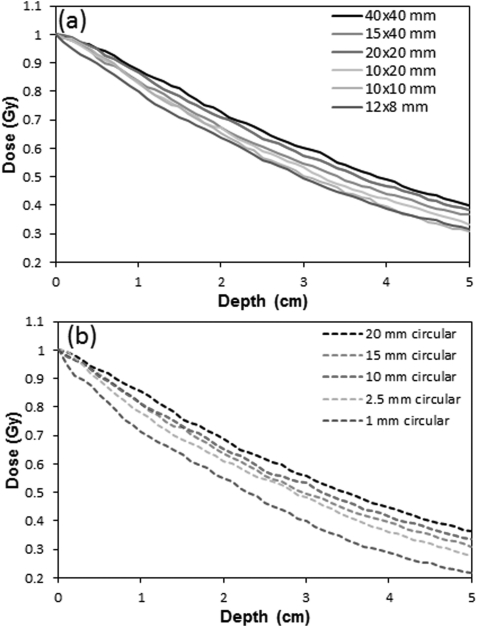
Figure 5 displays the percent depth dose curves for all 11 fields. Each of the six square/rectangular fields [Fig. 5a] exhibit a similar PDD shape, with increasing steepness for smaller fields. A greater variability in steepness is observed for the circular fields [Fig. 5b], a result of the smaller field sizes. At 3 cm depth, the PDD rises from ∼0.4 to ∼0.6, when the field size is increased from 1 to 20 mm, indicating the scatter dose contribution is ∼1/3 of the primary.
Figure 5.
Corrected EBT2 PDD curves for the six rectangular fields (a) and five circular fields (b) obtained with film aligned to the central axis and sandwiched between solid water blocks.
Output factors
EBT2 output factors for all fields were included in Fig. 3. A gradual decrease in output factor is observed as the field size decreases from 40 mm down to 10 mm. The film and ion-chamber outputs for the largest five fields, agree within 2% for all fields except the assymetrical 15 × 40 mm2 field (21.8 mm2 equivalent field) which has a 4% difference. Below 10 mm the output drops much more rapidly. An associated error of 2% is included with the film data as described in the literature,22, 23 and consistent with our experience.
PRESAGE®/Optical-CT 3D measurements
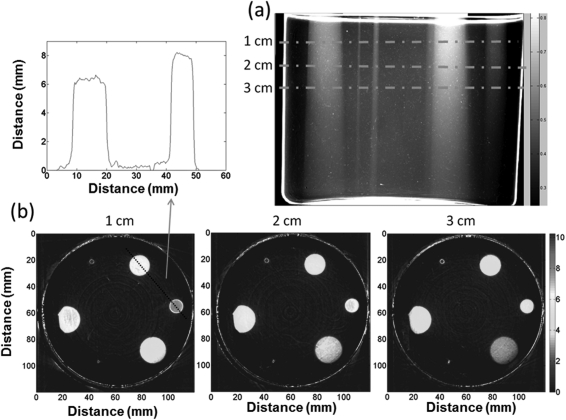
Three-dimensional measurements were made on a subset of fields for independent verification. Figure 6 shows the data acquired from the measurement dosimeter irradiated with six circular fields ranging in size from 1 to 20 mm. Figure 6a shows an arbitrary projection image (converted to OD) of this dosimeter. The six fields can be clearly distinguished extending to the bottom of the dosimeter. The projection set was reconstructed to give isotropic 0.2 mm 3D data throughout the dosimeter. The green dashed lines indicate the locations of three illustrative axial slices (0.2 mm thick), shown in [Fig. 6b]. PDDs and profiles were easily obtained from the reconstructed cubes by drawing line profiles and regions of interest through the appropriate cuts through the 3D data cube. The two smallest fields (2.5 and 1mm fields) are clearly visible in the reconstructed slices. A line profile through the center of the 15 and 10 mm field in the 1 cm depth slice is also shown. The noise on the plateau is ∼2.5%.
Figure 6.
(a) An illustrative projection image of the PRESAGE® dosimeter irradiated with five circular fields (diameter 20, 15, 10, 2.5, and 1mm) incident on the top surface. The full reconstructed dose cube was 0.2 mm3 voxel size throughout the whole dosimeter. Three representative axial planes are shown in (b) along with a line profile through the center of the 15 and 10 mm fields.
Two artifacts are observed in this dosimeter. The upper surface exhibited a circular raised meniscus ridge around the edge of the dosimeter. The surface inside the ridge was flat, ensuring a level entrance surface for the beam. This meniscus was caused by surface tension during curing of the dosimeter, and resulted in an unfortunate loss of accurate optical-CT readout data near the surface (0–8 mm) of the dosimeter. This artifact was reduced in the PDD-vertical dosimeter, where the meniscus was removed by sanding (Fig. 8). Achieving accurate dosimetry close to any surface is a well known and well described challenge for optical-CT techniques.19, 34 This problem has yet to be fully solved, although we show it can be reduced with careful dosimeter preparation (Sec. 3C2). The artifact is caused by refraction that occurs at the surface. Even when the matching fluid is optimally matched, refraction occurs because of subtle refractive differences between solid and liquid states. The second artifact occurred on the 20 mm field irradiation on the left side of the dosimeter in Fig. 6. The lead-shielding was not positioned accurately and is observed to partially block the field. The lack of a light field made the placement of the shield challenging. Data from this field were not used in any further analysis in this report.
Figure 8.
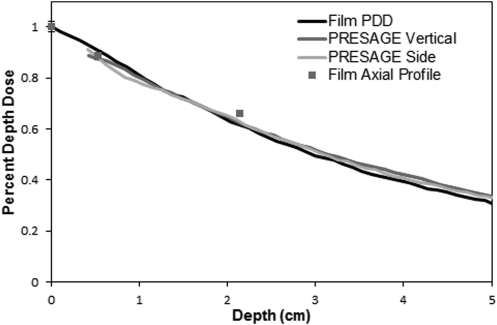
PDD curves for the 15 mm circular field at 225 kVp measured in film, and PRESAGE (vertical end-on irradiation, and side irradiation). Each curve is corrected for effective depth in water. The values obtained from axial film measurements are shown as points.
Contour plots of PRESAGE® compared with film
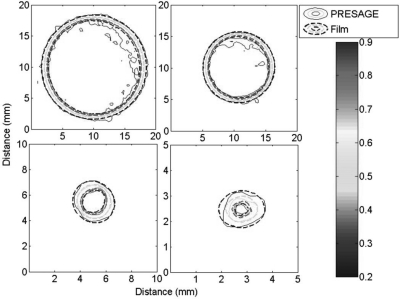
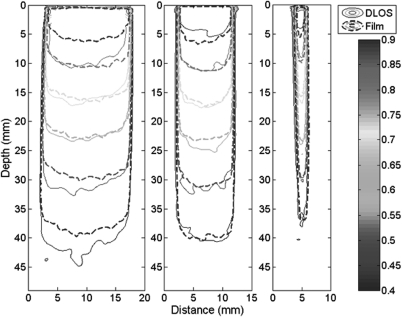
Figure 7 compares axial contour plots for both EBT and PRESAGE® at a typical therapy depth of 2 cm. Corresponding isodose lines agree within 0.5 mm in all places except for the 90% line in the larger cones, where agreement is within ∼1 mm. These isodose lines show excellent agreement overall, especially considering the small dimension of the fields and the high resolution of the imaging modalities. The high spatial resolution requirement yields higher noise than in prior work. Noise in the PRESAGE® data in the flat region of the largest field was ∼2.5%, compared to ∼1% for film (after both were smoothed with five point median filter).
Figure 7.
Isodose contour plots of the 15 mm (upper left), 10 mm (upper right), 2.5 mm (lower left), and 1 mm (lower right) circular fields at a water-equivalent depth of 2 cm. Isodose lines are 90, 80, 50, and 20%.
PRESAGE® PDD curves
Figure 8 compares the curves acquired from the PDD Vertical and PDD Side dosimeters (Sec. 2D) irradiated with a 15 mm field, with that from film. All curves agree within ∼3% of the maximum in the typical therapy region (1–4 cm). At deeper depths the EBT curves were slightly steeper (2.5% at 5 cm). The precise cause of this divergence is not known, but could arise from several causes. First, the accuracy of film data is reduced at depths deeper than 2 cm, where there were no axial film data points (see Fig. 4). Any film misalignment would cause the curve to fall off more steeply, as observed here. Second, the EBT2 film has higher relative electron density than the solid water (1.15 compared to 1.07, respectively). As the primary radiation component travels through the film, which is oriented along the radiation beam, this would also cause the PDD curve to drop more steeply. The vertical and side PDD PRESAGE® curves agree within 1.5% at all depths below 1 cm. Accurate superficial data (<4 mm) was not achieved in either irradiation, however, due to surface optical artifacts. Sanding off the surface meniscus, and ensuring the dosimeter had strictly flat upper and lower surfaces, did reduce the region of data loss compared to the measurement dosimeter. All PRESAGE® PDDs in this work were normalized to film at a depth of 1.5 cm, well beyond the influence of surface artifacts. Overall we consider the agreement between film and PRESAGE® in Fig. 8 to be very close.
The PRESAGE® and film PDD curves are compared in a more comprehensive representation in Fig. 9. Data from three circular fields are shown, representing relatively large, medium and small-field sizes. The data are representative of all fields. At typical therapeutic depths (1–4 cm) PRESAGE® agrees with film within 2.5% for all three fields. The slightly steeper dose fall-off seen in Fig. 8, for the 15 mm field, is reflected here as the separation of isodose lines at deeper depths.
Figure 9.
Isodose contour plots (90, 80, 70, 60, 50, and 40%) of the PDD planes for the 15, 10, and 2.5 mm circular fields. The depths are density corrected for difference from water equivalency of both PRESAGE® and solid water.
PRESAGE® output factors
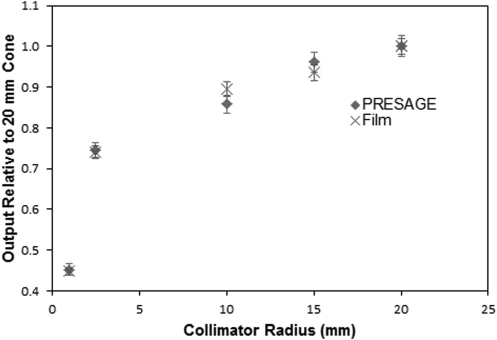
PRESAGE® output factors were determined at a typical therapy depth of 2 cm, where there was also film data for comparison. Surface output factor could not be determined from PRESAGE® due to the meniscus artifact. A small central region of interest was selected from each field (except the two smallest) and the median of the region was selected as the output for that field. The output factor values for the two smallest fields (2.5 and 1 mm) were determined without median filtering to prevent depression bias. The relative outputs for all five circular fields are shown, and compared with film, in Fig. 10.
Figure 10.
PRESAGE® and film output factors relative to the 20 mm field film measurement measured at a depth of 2 cm.
The PRESAGE® outputs agree with film within 2.8%, for all fields except the 10 mm field, where a 4.2% discrepancy is observed. The error bars associated with the film data are 2% as described in Sec. 3B3. The error bars associated with PRESAGE® data are 2.5% for all fields except the 1 mm, which represents the standard deviation through a flat region of dose. The 1 mm field has an additional 2% added in quadrature which reflects the uncertainty in dose when varying the slice depth by 0.6 mm in either direction. This variation was only significant with this smallest field.
CONCLUSIONS
This work presents a commissioning approach and data for a commercial small-field biological irradiator. The extremely small dimensions of the fields, as small as 1 mm, pose significant challenges to acquiring commissioning dosimetry data. Conventional dosimeters like ion-chambers and diodes are not useable due to partial volume averaging effects. Another challenge with these dosimeters is the difficulty of precise positioning and alignment of the detector in small fields. Even EBT2 film measurements, which have found wide application to small fields, are prone to uncertainties arising from the alignment challenge, as illustrated here (Fig. 4). Film measurements are also very labor intensive when comprehensive multiplane data are required. A key aspect of our approach was therefore to augment EBT2 data with an independent 3D dosimetry system, DLOS/PRESAGE®.
This work is the first application of DLOS/PRESAGE® system to small kV beams, and several advantages emerged. First, the alignment challenge and associated uncertainty was eliminated because the entire distribution is collected in the dosimeter. This improves accuracy. Second, the 3D measurements were more efficient because all parameters (PDDs, OFs, profiles) for multiple beams were acquired in a single dosimeter, with a single irradiation per beam, and a single optical-CT scan (duration 10–20 min). A limitation of the DLOS/PRESAGE® system is the difficulty in obtaining accurate data close to the surface. We show here that careful preparation of the dosimeter (ensuring precisely flat upper and lower surfaces) can partially mitigate this problem, reducing the data loss region from ∼8 to ∼4 mm.
Overall, good agreement was observed (mean difference 1.3%) between ion-chamber and film output factors for all fields >10 mm. For smaller fields, PRESAGE® and film outputs agreed to within 3% for all except the 10 mm field, where agreement was within 4%. PDD curves for EBT and PRESAGE® agreed well (within 3%) over typical therapeutic depths. At deeper depths, the film curves dropped off slightly more steeply to give difference of about 2.5% at 5 cm depth (Fig. 8). It is likely that the PRESAGE® PDD curves are more accurate at these deeper depths as discussed in Sec. 3C2. PRESAGE® data were more noisy (∼2.5%) than the film, and prior PRESAGE® work,3, 4 because of the high resolution used in this work (isotropic 0.2 mm 3D data).
ACKNOWLEDGMENTS
This work was supported by NIH R01CA100835, S103034539, NCI S10RR027610, NIAID K02AI093866, and NASA NSCOR NNX11AC60G.
References
- Kirsch D. G. et al. , “p53 controls radiation-induced gastrointestinal syndrome in mice independent of apoptosis,” Science 327, 593–596 (2010). 10.1126/science.1166202 [DOI] [PMC free article] [PubMed] [Google Scholar]
- Kirsch D. G. et al. , “Imaging primary lung cancers in mice to study radiation biology,” Int. J. Radiat. Oncol. Biol. Phys. 76, 973–977 (2010). 10.1016/j.ijrobp.2009.11.038 [DOI] [PMC free article] [PubMed] [Google Scholar]
- Thomas A. and Oldham M., “Fast, large field-of-view, telecentric optical-CT scanning system for 3D radiochromic dosimetry,” J. Phys. 250, 1–5 (2010). 10.1088/1742-6596/250/1/0120 [DOI] [PMC free article] [PubMed] [Google Scholar]
- Thomas A., Newton J. R., Oldham M., and Adamovics J., “Commissioning and benchmarking a 3D dosimetry system for clinical use,” Med. Phys. 38, 4846–4857 (2011). 10.1118/1.3611042 [DOI] [PMC free article] [PubMed] [Google Scholar]
- Das I. J. et al. , “Accelerator beam data commissioning equipment and procedures: Report of the TG-106 of the Therapy Physics Committee of the AAPM,” Med. Phys. 35, 4186–4215 (2008). 10.1118/1.2969070 [DOI] [PubMed] [Google Scholar]
- Das I. J., Ding G. X., and Ahnesjo A., “Small fields: Nonequilibrium radiation dosimetry,” Med. Phys. 35, 206–215 (2008). 10.1118/1.2815356 [DOI] [PubMed] [Google Scholar]
- Heydarian M., Hoban P. W., and Beddoe A. H., “A comparison of dosimetry techniques in stereotactic radiosurgery,” Phys. Med. Biol. 41, 93–110 (1996). 10.1088/0031-9155/41/1/008 [DOI] [PubMed] [Google Scholar]
- Olding T. et al. , “Small field dose delivery evaluations using cone beam optical computed tomography-based polymer gel dosimetry,” J. Med. Phys. 36, 3–14 (2011). 10.4103/0971-6203.75466 [DOI] [PMC free article] [PubMed] [Google Scholar]
- Babic S., McNiven A., Battista J., and Jordan K., “Three-dimensional dosimetry of small megavoltage radiation fields using radiochromic gels and optical CT scanning,” Phys. Med. Biol. 54, 2463–2481 (2009). 10.1088/0031-9155/54/8/014 [DOI] [PubMed] [Google Scholar]
- Wong C. J. et al. , “Small field size dose-profile measurements using gel dosimeters, gafchromic films and micro-thermoluminescent dosimeters,” Radiat. Meas. 44, 249–256 (2009). 10.1016/j.radmeas.2009.03.012 [DOI] [Google Scholar]
- Pappas E. et al. , “Small SRS photon field profile dosimetry performed using a PinPoint air ion chamber, a diamond detector, a novel silicon-diode array (DOSI), and polymer gel dosimetry. Analysis and intercomparison,” Med. Phys. 35, 4640–4648 (2008). 10.1118/1.2977829 [DOI] [PubMed] [Google Scholar]
- Clift C. et al. , “Toward acquiring comprehensive radiosurgery field commissioning data using the PRESAGE/optical-CT 3D dosimetry system,” Phys. Med. Biol. 55, 1279–1293 (2010). 10.1088/0031-9155/55/5/002 [DOI] [PMC free article] [PubMed] [Google Scholar]
- Pidikiti R. et al. , “Dosimetric characterization of an image-guided stereotactic small animal irradiator,” Phys. Med. Biol. 56, 2585–2599 (2011). 10.1088/0031-9155/56/8/016 [DOI] [PubMed] [Google Scholar]
- Lynch B. D. et al. , “Important considerations for radiochromic film dosimetry with flatbed CCD scanners and EBT GAFCHROMIC film,” Med. Phys. 33, 4551–4556 (2006). 10.1118/1.2370505 [DOI] [PubMed] [Google Scholar]
- Andres C., del Castillo A., Tortosa R., Alonso D., and Barquero R., “A comprehensive study of the Gafchromic EBT2 radiochromic film. A comparison with EBT,” Med. Phys. 37, 6271–6278 (2010). 10.1118/1.3512792 [DOI] [PubMed] [Google Scholar]
- Arjomandy B. et al. , “Energy dependence and dose response of Gafchromic EBT2 film over a wide range of photon, electron, and proton beam energies,” Med. Phys. 37, 1942–1947 (2010). 10.1118/1.3373523 [DOI] [PubMed] [Google Scholar]
- Wang Z. et al. , “Dose verification of stereotactic radiosurgery treatment for trigeminal neuralgia with Presage 3D dosimetry system,” J. Phys. 250(1), 012058 10.1088/1742-6596/250/1/0120(2010). [DOI] [PMC free article] [PubMed] [Google Scholar]
- Moutsatsos A. et al. , “Gamma Knife relative dosimetry using VIP polymer gel and EBT radiochromic films,” J. Phys.: Conf. Ser. 164, 012053 (2009). 10.1088/1742-6596/164/1/012053 [DOI] [Google Scholar]
- Oldham M., Sakhalkar H., Guo P., and Adamovics J., “An investigation of the accuracy of an IMRT dose distribution using two- and three-dimensional dosimetry techniques,” Med. Phys. 35, 2072–2080 (2008). 10.1118/1.2899995 [DOI] [PMC free article] [PubMed] [Google Scholar]
- Clarkson R. et al. , “Characterization of image quality and image-guidance performance of a preclinical microirradiator,” Med. Phys. 38, 845–856 (2011). 10.1118/1.3533947 [DOI] [PMC free article] [PubMed] [Google Scholar]
- Ma C. M. et al. , “AAPM protocol for 40-300 kV x-ray beam dosimetry in radiotherapy and radiobiology,” Med. Phys. 28, 868–893 (2001). 10.1118/1.1374247 [DOI] [PubMed] [Google Scholar]
- Devic S., Wang Y. Z., Tomic N., and Podgorsak E. B., “Sensitivity of linear CCD array based film scanners used for film dosimetry,” Med. Phys. 33, 3993–3996 (2006). 10.1118/1.2357836 [DOI] [PubMed] [Google Scholar]
- Saur S. and Frengen J., “GafChromic EBT film dosimetry with flatbed CCD scanner: A novel background correction method and full dose uncertainty analysis,” Med. Phys. 35, 3094–3101 (2008). 10.1118/1.2938522 [DOI] [PubMed] [Google Scholar]
- Adamovics J. and Maryanski M. J., “Characterisation of PRESAGE: A new 3-D radiochromic solid polymer dosemeter for ionising radiation,” Radiat. Prot. Dosim. 120, 107–112 (2006). 10.1093/rpd/nci555 [DOI] [PubMed] [Google Scholar]
- Guo P. Y., Adamovics J. A., and Oldham M., “Characterization of a new radiochromic three-dimensional dosimeter,” Med. Phys. 33, 1338–1345 (2006). 10.1118/1.2192888 [DOI] [PMC free article] [PubMed] [Google Scholar]
- Sakhalkar H. S., Adamovics J., Ibbott G., and Oldham M., “A comprehensive evaluation of the PRESAGE/optical-CT 3D dosimetry system,” Med. Phys. 36, 71–82 (2009). 10.1118/1.3005609 [DOI] [PMC free article] [PubMed] [Google Scholar]
- Wolodzko J. G., Marsden C., and Appleby A., “CCD imaging for optical tomography of gel radiation dosimeters,” Med. Phys. 26, 2508–2513 (1999). 10.1118/1.598772 [DOI] [PubMed] [Google Scholar]
- Gore J. C., Ranade M., Maryanski M. J., and Schulz R. J., “Radiation dose distributions in three dimensions from tomographic optical density scanning of polymer gels: I. Development of an optical scanner,” Phys. Med. Biol. 41, 2695–2704 (1996). 10.1088/0031-9155/41/12/009 [DOI] [PubMed] [Google Scholar]
- Oldham M., Siewerdsen J. H., Shetty A., and Jaffray D. A., “High resolution gel-dosimetry by optical-CT and MR scanning,” Med. Phys. 28, 1436–1445 (2001). 10.1118/1.1380430 [DOI] [PubMed] [Google Scholar]
- Oldham M., “3D dosimetry by optical-CT scanning,” J. Phys. 56, 58–71 (2006). 10.1088/1742-6596/56/1/006 [DOI] [PMC free article] [PubMed] [Google Scholar]
- Sakhalkar H. S. and Oldham M., “Fast, high-resolution 3D dosimetry utilizing a novel optical-CT scanner incorporating tertiary telecentric collimation,” Med. Phys. 35, 101–111 (2008). 10.1118/1.2804616 [DOI] [PMC free article] [PubMed] [Google Scholar]
- Thomas A., Newton J., and Oldham M., “A method to correct for stray light in telecentric optical-CT imaging of radiochromic dosimeters,” Phys. Med. Biol. 56, 4433–4451 (2011). 10.1088/0031-9155/56/14/013 [DOI] [PMC free article] [PubMed] [Google Scholar]
- Gorjiara T. et al. , “Investigation of radiological properties and water equivalency of PRESAGE[sup [registered sign]] dosimeters,” Med. Phys. 38, 2265–2274 (2011). 10.1118/1.3561509 [DOI] [PubMed] [Google Scholar]
- Doran S. and Krstajić N., “The history and principles of optical computed tomography for scanning 3-D radiation dosimeters,” J. Phys.: Conf. Ser. 56, 45–57 (2006). 10.1088/1742-6596/56/1/005 [DOI] [Google Scholar]


