On-the-fly adaptive edge scanning and shuttle on-the-fly rastering fluorescence techniques have been developed to improve the efficiency of macromolecular crystallography beamlines.
Keywords: macromolecular crystallography, beamline automation, data acquisition, high-throughput crystallography, X-ray fluorescence, multi-wavelength anomalous diffraction
Abstract
This paper reports on several developments of X-ray fluorescence techniques for macromolecular crystallography recently implemented at the National Institute of General Medical Sciences and National Cancer Institute beamlines at the Advanced Photon Source. These include (i) three-band on-the-fly energy scanning around absorption edges with adaptive positioning of the fine-step band calculated from a coarse pass; (ii) on-the-fly X-ray fluorescence rastering over rectangular domains for locating small and invisible crystals with a shuttle-scanning option for increased speed; (iii) fluorescence rastering over user-specified multi-segmented polygons; and (iv) automatic signal optimization for reduced radiation damage of samples.
1. Introduction
X-ray fluorescence measurements constitute an integral part of modern crystallographic experiments. X-ray fluorescence spectra help to determine the presence of chemical elements of interest in the sample crystal. The dependence of fluorescence yield on incident X-ray energy around an absorption edge (Jaklevic et al., 1977 ▶) defines energies for anomalous scattering experiments, typically the energy of peak absorption for single-wavelength anomalous diffraction experiments (SAD) and the inflection point of the edge for multi-wavelength (MAD) experiments (Guss et al., 1988 ▶; Smith, 1991 ▶; Hendrickson & Ogata, 1997 ▶; Walsh et al., 1999 ▶). X-ray fluorescence imaging (Karain et al., 2002 ▶; Aragão et al., 2010 ▶) can help to align and center small crystals where both optical (Lavault et al., 2006 ▶; Pothineni et al., 2006 ▶) and UV (Jacquamet et al., 2004 ▶; Vernede et al., 2006 ▶) centering reach the limit of their resolution. X-ray fluorescence imaging also has the great advantage of requiring one or two orders of magnitude lower intensity of incident X-rays compared to a diffraction experiment on the same sample. This advantage allows users to perform measurements with a reduced risk of radiation damage to their samples. Here we report the development of fast X-ray fluorescence techniques that decrease radiation exposure of samples and provide a high level of automation, allowing users to concentrate on solving structures rather than carrying out the measurements. These developments are implemented at the National Institute of General Medical Sciences and National Cancer Institute Collaborative Access Team (GM/CA CAT) at the Advanced Photon Source (APS) and are available to users of GM/CA CAT beamlines as a part of the JBluIce–EPICS beamline control system (Stepanov et al., 2011 ▶).
2. Automatic signal optimization
Automatic signal optimization is a mandatory step before starting any fluorescence measurements. The incident intensity rate is limited at the upper end by the multichannel analyzer (MCA), a device used for decomposing fluorescence detector data into energy spectra. MCAs have quite limited count rates and produce distorted spectra when saturated. The lower limit on the incident intensity rate is set by the counting statistics required for reliable data. In our implementation of searching for an optimal count rate, the incident beam is attenuated by three orders of magnitude and the fluorescence detector is moved to the shortest possible distance from the sample. Then, the attenuation and detector distance are varied to maximize the detector signal while maintaining an acceptable electronics dead time, which increases with the signal. This process converges to an optimum dead time of 10 (2)% after a maximum of five to ten measurements. The automated process minimizes radiation exposure to the sample and saves users from needing to know the specifics of the detector electronics. In addition, since the beam attenuation is being changed, the optimization routine proportionally adjusts the amplifier gain for the incidence flux signal (I 0) since it is used to normalize the edge-scan data (see §3). Similar optimization protocols are independently implemented at some other facilities, for example at SSRL (Stanford Synchrotron Radiation Laboratory) and at beamline 14-2 of BESSY (Helmholtz-Zentrum Berlin).
3. Three-band on-the-fly edge scanning
In macromolecular crystallography, fluorescence edge scans are commonly used for precise determination of the peak and inflection points of an absorption edge. During the edge scan, the integral intensity of a fluorescence peak of interest, selected as the region of interest (ROI) on the MCA, is recorded as a function of incident X-ray energy selected via the monochromator. At insertion device (ID) beamlines, one might also need to scan the ID energy in sync with the monochromator. However, since the scan range is typically within 200 eV of a center point, it is often sufficient to scan the monochromator only with the ID energy preset to the higher end of the scan range. To reduce scan time and sample exposure, scan ranges are usually divided into three bands, typically with fine stepping of 0.1–0.5 eV in the central band of ±5 eV around the edge, and coarse stepping of 1–5 eV at the side bands, which are 100 eV or more each. The choice of fine step size depends on the monochromator energy resolution.
3.1. On-the-fly fluorescence scan implementation
With the goals of further reducing the scan time and improving the energy accuracy, we implemented an on-the-fly mode of three-band scans. While on-the-fly scanning does not reduce sample exposure to X-rays, in our case an on-the-fly scan is ∼3.5 times faster than a step scan because there is no need to wait for monochromator positioning at each step. Thus, a three-band on-the-fly scan of 200 data points with 1 s exposure per point requires 3.4 min compared to 12 min for the analogous step scan.
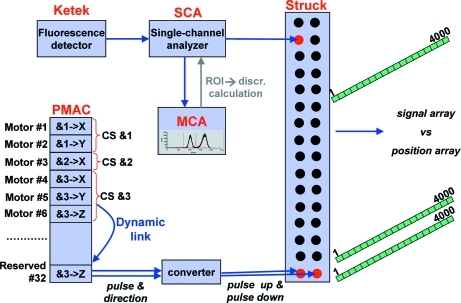
Our implementation of on-the-fly fluorescence scanning is built on the generic on-the-fly scanning procedure previously developed for many other beamline operations (Fischetti et al., 2004 ▶; Stepanov et al., 2011 ▶). Briefly, the advances of position and the intensity are synchronized by a multi-axis Delta Tau PMAC motion controller and a Struck multiscaler (Fig. 1 ▶). With a PMAC controller capable of controlling 32 drives, one drive output (#32 in Fig. 1 ▶) is a dedicated link between the PMAC controller and the Struck scaler via a converter of pulse-and-direction to pulse-up/pulse-down. Prior to starting a scan, software instructs the PMAC controller to clone its pulse and direction signals for the scanned motor (monochromator Bragg angle in the case of energy scans) into #32 and thus any requested drive advances are copied to the Struck scaler. At the end of a scan, the Struck scaler provides the arrays of motor positions and detector intensities synchronized in time.
Figure 1.
Implementation of on-the-fly fluorescence scanning. ‘CS’ denotes coordinate system.
While generic scanning deals with single-bin data (e.g. pulses from an ion chamber) that can be fed into the Struck scaler, fluorescence scanning utilizes an MCA, which produces a spectrum in the form of ∼103 data bins to be summed over the ROI. Our solution to summing the bins on the fly is to bypass the MCA and read the fluorescence detector pulses from a single-channel analyzer (SCA) placed between the fluorescence detector and the MCA. This device is capable of analyzing and discriminating detector pulses over their amplitude. The SCA output is split-routed to both the MCA and the Struck scaler. The output to the MCA is used to calibrate pulse amplitude reported by the SCA to photon energy. The calibration, carried out annually, verifies a linear SCA response, and provides slope and offset. Before starting a fluorescence scan, an energy ROI is selected via the MCA. Then software reads the lower and the upper thresholds of the ROI and recalculates them into the lower and upper thresholds, respectively, of the SCA. The photon pulses permitted by the SCA are presented to the Struck scaler as transistor–transistor logic (TTL) pulses – just as in generic on-the-fly scans. The pulse count is identical to the sum over the MCA ROI, but using the SCA is more efficient than reading and then integrating the MCA spectrum.
The GM/CA implementation of fluorescence scans utilizes a Ketek energy-dispersive silicon-drift detector and Canberra electronics in the NIM standard (556 AIM, 2016 TCA and 9635 ADC) interfaced from the Experimental Physics and Industrial Control System (EPICS) using the commonly available EPICS drivers for Canberra and Struck by Mark Rivers and EPICS drivers for the Delta Tau PMAC by GM/CA CAT and Diamond Light Source. The same concept may be implemented broadly with other hardware and software combinations, although in some cases small variations may be required. For example, the DXP Saturn by XIA, an alternative to Canberra electronics, provides an automatic conversion of pulse integration over the ROI into TTL output and thus allows for a simpler signal routing into the Struck scaler.
3.2. Adaptive edge scanning
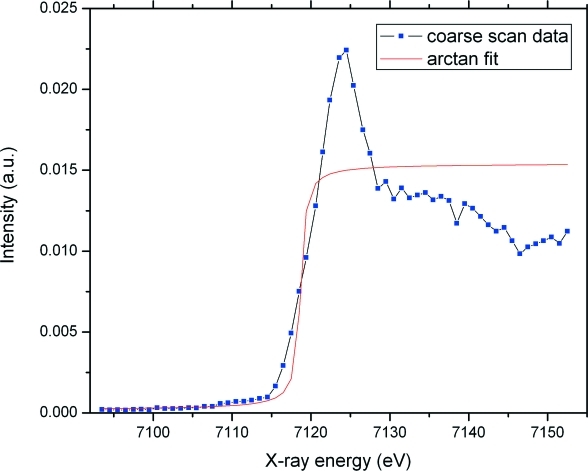
While fine scanning in the vicinity of an absorption edge and coarse scanning in the remote regions is a common practice to reduce scan times and sample exposures, the absorption edges of elements generally exhibit chemical shifts that are dependent on their bonding in the structure. In some cases these shifts may be as large as 20 eV (Singh & Kashyap, 1975 ▶), but for biological macromolecules the shifts typically do not exceed 5–10 eV (Chance et al., 1983 ▶; Hsieh et al., 2004 ▶). As a result, the absorption edge may fall outside a fine-step band that is pre-positioned around the tabulated edge energy. Separately, drifts of the monochromator energy calibration may cause a similar problem (not the case at the GM/CA CAT beamlines). Fine scanning over a wide range is not an acceptable solution for such problems because it considerably increases scan time and sample exposure. A common alternative is to introduce a manual offset of the edge. When the scan reveals a chemical shift beyond the fine-scanning interval, an appropriate offset can be specified and the scan repeated. However, this is contrary to the goal of fully automated operations and also doubles both the scan time and the radiation exposure. We implemented another solution, which we call ‘adaptive scanning’. First, a coarse, low radiation dose scan is run over the entire scan range. To locate the edge position, the coarse-scan data could be fitted by either an arctangent or an error function (Stöhr, 1992 ▶). We chose the arctangent function because it provides a more stable fit to the coarse-scan data:
Here E is the energy of incident X-rays and the four fitting parameters, P, W, A and B, are the position of the inflection point, the FWHM of the absorption edge, the amplitude and the background of the coarse-scan data, respectively. A Levenberg–Marquardt numerical curve-fitting algorithm (Levenberg, 1944 ▶; Marquardt, 1963 ▶) is used. To speed the calculation, B is fixed to the lowest intensity value of the scan data, and W is fixed to the step size of the coarse scan. The result of a typical fit is shown in Fig. 2 ▶.
Figure 2.
Fit of the absorption edge position using coarse energy scan data.
After P is determined based on the fit, an additional fine-step scan is performed in a narrow interval around P. In this way, any shift of the edge position is accommodated automatically without need for a full rescan. The ‘price’ of this procedure is that the central area is scanned twice: once during the coarse scan, and then during the fine scan. At GM/CA CAT, the coarse-scan step size is 1–2 eV, depending on the edge, and the fine-scanning range is 9 eV. This results in five to nine extra measurements. The additional dose to the sample ranges from the equivalent of a small fraction of one diffraction image up to about one diffraction image, because the beam attenuation is generally ten to 100 times greater for fluorescence than for diffraction measurements. The time required for an on-the-fly adaptive scan with a 0.5 s exposure per point is generally less than the time for the respective three-band scan because the adaptive scan consists of two scans instead of three. Thus, although the adaptive scan takes a few more data measurements, it saves on one on-the-fly scan setup, which takes up to 5 s to position the monochromator and reset its speed.
It should be noted that the adaptive edge scanning does not provide any improvement in the accuracy of determining the inflection point compared to the manual positioning of the fine-step band: the accuracy is determined by the scan step in the central band. The adaptive scanning helps to position the band automatically without user intervention and to reduce radiation exposure by eliminating a full rescan.
3.3. GUI controls
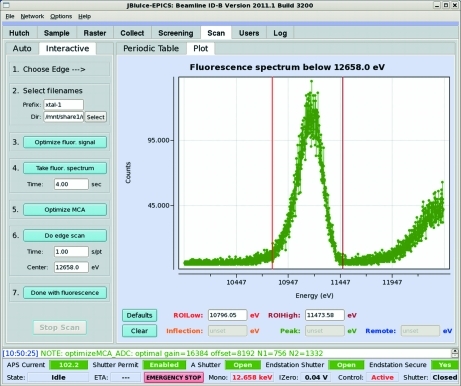
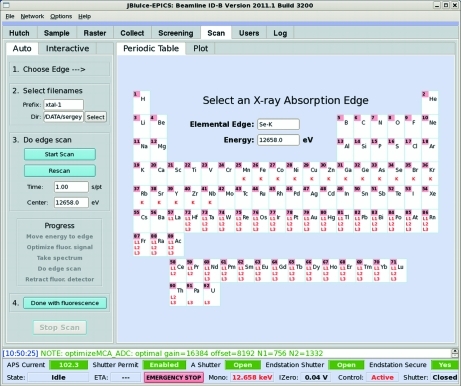
While fluorescence scanning is implemented as a stand-alone program interfacing hardware via EPICS, it has been provided with a convenient graphical user interface (GUI) within JBluIce, a Java-based multi-tabbed frontend for data collection in the field of macromolecular crystallography (Stepanov et al., 2011 ▶), which conforms to the style of the successful SSRL Blu-Ice (McPhillips et al., 2002 ▶). The JBluIce Scan tab (Figs. 3 ▶ and 4 ▶) consists of two panes (left and right), each containing two tabs. Most of the controls are located in the left pane, while the right pane provides the choice of either the Periodic Table tab or the Plot tab. The two tabs in the left pane correspond to two different modes of operation, Interactive (Fig. 3 ▶) and Auto (Fig. 4 ▶).
Figure 3.
Scan tab layout of the JBluIce GUI. The Interactive mode of operation is shown. The right pane displays a fluorescence spectrum with user-adjustable ROI margins marked by the two bars (step 5).
Figure 4.
Automatic scanning controls on the Scan tab of the JBluIce GUI. The right pane displays the periodic table from which an edge of interest is selected.
In Interactive mode, the workflow includes seven steps as indicated by the numbers in the pane (Fig. 3 ▶). In step 1, an absorption edge is selected on the Periodic Table (same as shown in Fig. 4 ▶ for Auto). Per this selection, the software retrieves the edge energy from a mySQL database. In step 2, the users specify a directory and file prefix for storing scan data. In step 3, the signal is optimized as explained in §2. Before the optimization is started, the beamline is tuned to an X-ray energy 150 eV above the edge. In step 4, a fluorescence emission spectrum is taken to ensure that the chemical element of interest is present in the sample. The spectrum is displayed in the Plot tab in the right pane, providing an option to adjust the ROI on the spectrum (Fig. 3 ▶). By default the ROI is set to the tabulated position and FWHM of the emission line. The tabulated values that are retrieved from mySQL suit most cases, but if there are overlapping peaks from several elements, manual ROI adjustment is available by dragging the left-side and the right-side bars on the plot. Step 5 zooms the MCA on the selected ROI by automatically adjusting the amplifier gain and offset. Step 6 performs the edge scan described in §3.1. Before starting the scan, users can specify the time per step and the scan center, which by default is the tabulated absorption edge. When an adaptive scan is chosen in the JBluIce options menu, the scan center input is not used and is disabled in the GUI. The fine- and coarse-scan limits and step sizes are taken from the mySQL database, where they are stored for each absorption edge, and can be modified by beamline staff as needed. As at many other facilities, the scan data are processed by the CHOOCH software (Evans & Pettifer, 2001 ▶) for automatic determination of the anomalous scattering form factors, f′ and f′′. Step 7 retracts the fluorescence detector to its parking position and restores the beam attenuation and the I 0 amplifier gain to their original states (before step 3).
A further advance in automating fluorescence scanning is presented by the Auto tab (Fig. 4 ▶). When the Start Scan button on this tab is pressed, the software automatically progresses through a series of operations that are available as individual steps in the Interactive mode: it retunes the beamline to an energy 150 eV above the edge, optimizes the signal by varying beam attenuation, records the fluorescence spectrum, sets the ROI from the database, displays the result to the experimenter for confirmation and then performs the three-band on-the-fly edge scan. The edge scan may be repeated by pressing the Rescan button. Step 4 resets the hardware, as in step 7 in Interactive mode. Because the Auto mode targets simplicity, it skips the option to adjust the ROI on the MCA spectrum.
4. Fluorescence rastering
As a result of recent active developments of minibeam capabilities (Riekel et al., 2005 ▶; Sanishvili et al., 2008 ▶; Fischetti et al., 2009 ▶), crystallography beamlines are currently accommodating crystals as small as 5 µm, with a 1 µm beam size already achieved (Moukhametzianov et al., 2008 ▶) and further size reductions expected in the near future (Sanishvili et al., 2011 ▶). Such small sizes are at or below the limits of the optical and UV methods traditionally used for crystal centering. To overcome this limitation, in the past few years a considerable effort has been invested in developing diffraction-based crystal search and centering techniques (Song et al., 2007 ▶; Cherezov et al., 2009 ▶; Bowler et al., 2010 ▶; Aishima et al., 2010 ▶; Stepanov et al., 2011 ▶; Hilgart et al., 2011 ▶). Typically, a crystal is sought by rastering the minibeam over a rectangular grid area where the grid size is specified by the experimenter and the grid cells are chosen to be approximately equal to the X-ray beam size. At each cell a diffraction image is recorded and the cell is scored according to the number of diffraction spots present, most commonly determined by DISTL (Zhang et al., 2006 ▶). Hilgart et al. (2011 ▶) extended the search grid from a simple rectangular area to multiple polygons, which may help to reduce the scanning time and radiation exposure.
Diffraction rastering is the ultimate technique for finding and centering crystals, as well as for evaluating the diffraction quality of different parts of the crystal. However, not all samples can survive this procedure because it involves significant radiation exposure. In addition, diffraction rastering is relatively time consuming since it requires step scanning with diffraction images recorded and analyzed at each step. A notable exception is the work by Aishima et al. (2010 ▶) who implemented on-the-fly diffraction rastering by utilizing the 10 frames per second capability of the Pilatus area detector. We suggest that measuring X-ray fluorescence instead of diffraction can be a powerful complement to diffraction rastering for samples that contain X-ray fluorescent elements, such as those with selenomethionine incorporation. Fluorescence contrast can be observed when the concentration of an element differs in the crystal and in the surrounding mother liquor. The advantages of fluorescence rastering compared to its diffraction counterpart are the orders of magnitude lower intensity of incident X-rays (Aragão et al., 2010 ▶) and the easy implementation in a fast on-the-fly mode. A disadvantage is that fluorescence scanning does not provide data on crystal diffraction quality. In this respect, it is similar to traditional imaging techniques, albeit with better spatial resolution and without refraction effects, which can hinder visual imaging. The spatial resolution of diffraction and fluorescence imaging is limited only by the size of the X-ray minibeam. At the GM/CA CAT beamlines, this limit is currently about 5 µm and it is expected to drop to about 1 µm in the next few years. Technically, fluorescence rastering is similar to the micro-X-ray fluorescence technique, which has the potential for three-dimensional elemental imaging with a spatial resolution better than 0.05 µm (De Samber et al., 2008 ▶) and for which on-the-fly scanning has been tested (Falkenberg et al., 2005 ▶).
4.1. Fluorescence rastering implementation
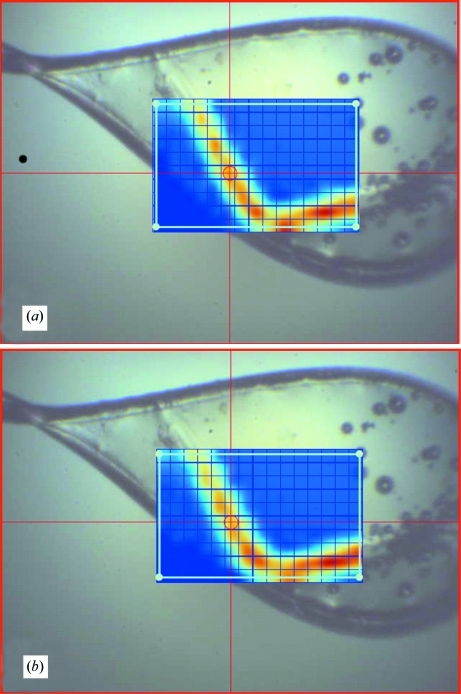
Our implementation of fluorescence rastering is similar to that of fluorescence edge scans described in §3.1, i.e. it deploys the same mechanism of synchronizing drive position and MCA data while performing the on-the-fly scans as shown in Fig. 1 ▶. The scanning is performed by translating the sample goniometer horizontally, followed by stepwise vertical shifts of the sample by one grid row using an XY positioner on the goniometer. In order to study scanning precision and reproducibility, we implemented four scan modes: (i) step scans that integrate reading the MCA ROI, (ii) step scans with the SCA set from the ROI as explained in §3.1, (iii) unidirectional on-the-fly scans with the SCA and (iv) shuttle-type bidirectional on-the-fly scans. Among these, (i) corresponds to the most conservative option, while (iii) is considerably faster and (iv) is the fastest. Because of motor acceleration and deceleration at the beginning and end of on-the-fly scans, some of the reported positions may be offset from the centers of the grid cells. In these cases, the data are interpolated to the centers using an Akima (1970 ▶) spline.
As expected, no difference was found between the results of (i) and (ii). With on-the-fly scans the results were more complicated. Unlike a step scan where a backlash correction ensures that the same position is reached when approached from both directions, the quality of on-the-fly scan data is dependent on such factors as the backlash effect and the drive following error (the difference between the requested drive position and the actual position reported by the encoder). Geared drives with a ball screw did not provide sufficiently small following errors during motion. For example, with an encoder resolution of 0.1 µm, the drive could be positioned after a certain relaxation period within 1 µm of a requested position, but while in motion, the following error could be as large as 30 µm. Likewise, closing the motion control loops with a rotary encoder on the motor would lead to a backlash effect, making shuttle scanning impossible. These problems were overcome by installing a direct-drive positioner (Nippon Pulse Linear Shaft Motor) and a linear encoder (MicroE Systems Mercury II 5000). In addition, another essential step was tuning the motion control loop using Delta Tau software for PMAC to reduce the following error to 1 µm. The results of fluorescence rastering after proper hardware installation and tuning are shown on Fig. 5 ▶. The step and shuttle-type on-the fly scans provide very similar results and match optical observations well.
Figure 5.
Comparison of (a) the step mode and (b) the shuttle on-the-fly mode of fluorescence rastering for a properly tuned horizontal drive. The cell and the beam size are 20 µm.
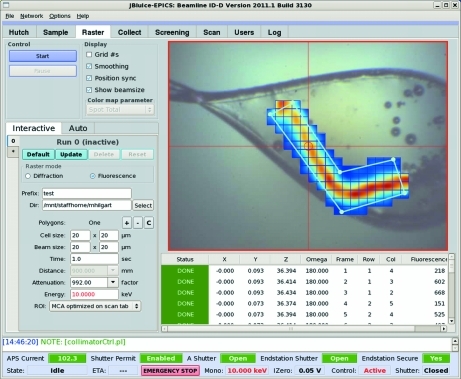
On-the-fly shuttle rastering provides up to twofold time reduction compared to the unidirectional on-the-fly mode and up to eightfold faster operation than the step mode. This is because no time is spent on resetting the horizontal drive speed and rewinding the drive between rows. However, both unidirectional and shuttle on-the-fly modes lose their advantage and are automatically replaced by step mode when the grid contains less than five columns. This is because the overhead associated with preparing for on-the-fly scanning (linking the virtual axis, recalculating and setting the on-the-fly scan speed etc.) outweighs the gain of fast scanning over short intervals. Fluorescence rastering was recently extended to support the multiple polygon-shaped grids (Fig. 6 ▶) introduced by Hilgart et al. (2011 ▶) with the limitation that only step scans have been made available for non-rectangular shapes. While step-scan fluorescence imaging takes nearly as much time as diffraction imaging, it still retains the advantage of considerably lower radiation exposure.
Figure 6.
JBluIce controls for fluorescence rastering. The right pane shows the result of rastering over a polygon shape.
4.2. GUI controls
Similar to edge scanning, fluorescence rastering is implemented as a stand-alone program interfaced from the JBluIce GUI. Conforming to the idea that fluorescence rastering is a complement to diffraction rastering, the GUI controls for both techniques are shared on the JBluIce Raster tab (Fig. 6 ▶).
Experimenters can select between diffraction and fluorescence rastering by clicking on a radio control button. Then they are provided with controls to specify a file prefix and directory for storing data. Clicking on ‘+’ or ‘−’ adds or deletes a search area on the video overlay. The shapes are generally polygons defined by sequentially selecting vertices on the image. The ‘C’ button clears all shapes. The cell size is user adjustable and the beam size is automatically matched to it by bringing in the appropriate minibeam collimators (5, 10 and 20 µm sizes are currently available) or adjusting upstream slits if a larger beam size is needed. The automatic beam size selection can be overridden. The time parameter sets data collection time per grid cell. The beam attenuation factor and energy controls are included for user convenience. The ROI parameter provides the choice of either MCA parameters optimized on the Scan tab (§§2 and 3), the tabulated fluorescence peak for the element chosen on the Scan tab’s periodic table (Fig. 3 ▶), or any fluorescence, i.e. any photons in the range between a low value of 50 eV and a high value of 100 eV below the energy of incident X-rays to exclude elastic scattering. The ability to use different ROI options is supplied for cases in which chemical composition is not well known. It is obvious that the highest contrast can be achieved when the ROI is tuned for a particular element, e.g. selenium, sulfur, phosphorus etc. The Start button initiates the operation. After the scan is complete, users can bring the desired cell to the center by either clicking on the intensity map overlaid on the crystal image or selecting a cell from the results table displayed below the image. The table also lists fluorescence counts for each cell, which may be used in the future for fluorescence-based automatic or semi-automatic centering. Multiple rastering runs can be set up, thereby allowing the results to be retrieved at a later time. The Auto tab is reserved for future automatic sequencing of rastering runs. Since most of the controls for diffraction and fluorescence rastering are shared, please see the paper by Hilgart et al. (2011 ▶) for further details.
5. Conclusions
We have discussed several developments of fast X-ray fluorescence techniques that may be of interest to macromolecular crystallography beamlines. The application of adaptive on-the-fly scanning helps to speed and automate MAD and SAD experiments. Using on-the-fly fluorescence rastering may help in locating and centering micrometre-sized crystals quickly and with minimal radiation exposure. Future development plans include implementation of on-the-fly rastering for non-rectangular shapes and automatic three-dimensional centering of crystals based on X-ray fluorescence.
Acknowledgments
We thank Mark Rivers (University of Chicago) for help interfacing Canberra electronics, and GM/CA CAT users for providing valuable feedback and ideas. GM/CA CAT is supported with Federal funds from the National Cancer Institute (grant No. Y1-CO-1020) and the National Institute of General Medical Sciences (grant No. Y1-GM-1104) of the NIH. Use of the Advanced Photon Source was supported by the US Department of Energy, Basic Energy Sciences, Office of Science, under contract No. DE-AC02-06CH11357. DA is supported by a Marie Curie Intra-European Fellowship (grant No. PIEF-GA-2009-235612).
References
- Aishima, J., Owen, R. L., Axford, D., Shepherd, E., Winter, G., Levik, K., Gibbons, P., Ashton, A. & Evans, G. (2010). Acta Cryst. D66, 1032–1035. [DOI] [PMC free article] [PubMed]
- Akima, H. (1970). J. ACM, 17, 589–602.
- Aragão, D., Becker, M., Li, D., Hilgart, M., Lyons, J., Yoder, D., Stepanov, S., Fischetti, R. & Caffrey, M. (2010). 13th International Conference on Crystallization of Biological Macromolecules (ICCBM13), Dublin, Ireland.
- Bowler, M. W., Guijarro, M., Petitdemange, S., Baker, I., Svensson, O., Burghammer, M., Mueller-Dieckmann, C., Gordon, E. J., Flot, D., McSweeney, S. M. & Leonard, G. A. (2010). Acta Cryst. D66, 855–864. [DOI] [PubMed]
- Chance, B., Fischetti, R. & Powers, L. (1983). Biochemistry, 22, 3820–3829. [DOI] [PubMed]
- Cherezov, V., Hanson, M. A., Griffith, M. T., Hilgart, M. C., Sanishvili, R., Nagarajan, V., Stepanov, S., Fischetti, R. F., Kuhn, P. & Stevens, R. C. (2009). J. R. Soc. Interface, 6, S587–S597. [DOI] [PMC free article] [PubMed]
- De Samber, B., Silversmit, G., Evens, R., De Schamphelaere, K., Janssen, C., Masschaele, B., Van Hoorebeke, L., Balcaen, L., Vanhaecke, F., Falkenberg, G. & Vincze, L. (2008). Anal. Bioanal. Chem. 390, 267–271. [DOI] [PubMed]
- Evans, G. & Pettifer, R. F. (2001). J. Appl. Cryst. 34, 82–86.
- Falkenberg, G., Kracht, T. & Kühbacher, M. (2005). HASYLAB Annual Report, pp. 91–95. HASYLAB at DESY, Hamburg, Germany.
- Fischetti, R., Stepanov, S., Rosenbaum, G., Barrea, R., Black, E., Gore, D., Heurich, R., Kondrashkina, E., Kropf, A. J., Wang, S., Zhang, K., Irving, T. C. & Bunker, G. B. (2004). J. Synchrotron Rad. 11, 399–405. [DOI] [PubMed]
- Fischetti, R. F., Xu, S., Yoder, D. W., Becker, M., Nagarajan, V., Sanishvili, R., Hilgart, M. C., Stepanov, S., Makarov, O. & Smith, J. L. (2009). J. Synchrotron Rad. 16, 217–225. [DOI] [PMC free article] [PubMed]
- Guss, J. M., Merritt, E. A., Phizackerley, R. P., Hedman, B., Murata, M., Hodgson, K. O. & Freeman, H. C. (1988). Science, 241, 806–811. [DOI] [PubMed]
- Hendrickson, W. & Ogata, C. (1997). Methods Enzymol. 276, 494–523. [DOI] [PubMed]
- Hilgart, M. C., Sanishvili, R., Ogata, C., Becker, M., Venugopalan, N., Stepanov, S., Makarov, O., Smith, J. L. & Fischetti, R. F. (2011). J. Synchrotron Rad. 18 Submitted.
- Hsieh, W. Y., Campbell, K. A., Gregor, W., David Britt, R., Yoder, D. W., Penner-Hahn, J. E. & Pecoraro, V. L. (2004). Biochim. Biophys. Acta, 1655, 149–157. [DOI] [PubMed]
- Jacquamet, L., Ohana, J., Joly, J., Legrand, P., Kahn, R., Borel, F., Pirocchi, M., Charrault, P., Carpentier, P. & Ferrer, J.-L. (2004). Acta Cryst. D60, 888–894. [DOI] [PubMed]
- Jaklevic, J., Kirby, J. A., Klein, M. P., Robertson, A. S., Brown, G. S. & Eisenberger, P. (1977). Solid State Commun. 23, 679–682.
- Karain, W. I., Bourenkov, G. P., Blume, H. & Bartunik, H. D. (2002). Acta Cryst. D58, 1519–1522. [DOI] [PubMed]
- Lavault, B., Ravelli, R. B. G. & Cipriani, F. (2006). Acta Cryst. D62, 1348–1357. [DOI] [PubMed]
- Levenberg, K. (1944). Q. Appl. Math. 2, 164–168.
- Marquardt, D. (1963). SIAM J. Appl. Math. 11, 431–441.
- McPhillips, T. M., McPhillips, S. E., Chiu, H.-J., Cohen, A. E., Deacon, A. M., Ellis, P. J., Garman, E., Gonzalez, A., Sauter, N. K., Phizackerley, R. P., Soltis, S. M. & Kuhn, P. (2002). J. Synchrotron Rad. 9, 401–406. [DOI] [PubMed]
- Moukhametzianov, R., Burghammer, M., Edwards, P. C., Petitdemange, S., Popov, D., Fransen, M., McMullan, G., Schertler, G. F. X. & Riekel, C. (2008). Acta Cryst. D64, 158–166. [DOI] [PMC free article] [PubMed]
- Pothineni, S. B., Strutz, T. & Lamzin, V. S. (2006). Acta Cryst. D62, 1358–1368. [DOI] [PubMed]
- Riekel, C., Burghammer, M. & Schertler, G. (2005). Curr. Opin. Struct. Biol. 15, 556–562. [DOI] [PubMed]
- Sanishvili, R., Nagarajan, V., Yoder, D., Becker, M., Xu, S., Corcoran, S., Akey, D. L., Smith, J. L. & Fischetti, R. F. (2008). Acta Cryst. D64, 425–435. [DOI] [PMC free article] [PubMed]
- Sanishvili, R., Yoder, D. W., Pothineni, S. B., Rosenbaum, G., Xu, S., Vogt, S., Stepanov, S., Makarov, O. A., Corcoran, S., Benn, R., Nagarajan, V., Smith, J. L. & Fischetti, R. F. (2011). Proc. Natl Acad. Sci. USA, 108, 6127–6132. [DOI] [PMC free article] [PubMed]
- Singh, A. K. & Kashyap, B. M. S. (1975). J. Phys. F Metal Phys. 5, 822–825.
- Smith, J. L. (1991). Curr. Opin. Struct. Biol. 1, 1002–1011.
- Song, J., Mathew, D., Jacob, S. A., Corbett, L., Moorhead, P. & Soltis, S. M. (2007). J. Synchrotron Rad. 14, 191–195. [DOI] [PubMed]
- Stepanov, S., Makarov, O., Hilgart, M., Pothineni, S. B., Urakhchin, A., Devarapalli, S., Yoder, D., Becker, M., Ogata, C., Sanishvili, R., Venugopalan, N., Smith, J. L. & Fischetti, R. F. (2011). Acta Cryst. D67, 176–188. [DOI] [PMC free article] [PubMed]
- Stöhr, J. (1992). NEXAFS Spectroscopy. Berlin, Heidelberg, New York: Springer-Verlag.
- Vernede, X., Lavault, B., Ohana, J., Nurizzo, D., Joly, J., Jacquamet, L., Felisaz, F., Cipriani, F. & Bourgeois, D. (2006). Acta Cryst. D62, 253–261. [DOI] [PubMed]
- Walsh, M. A., Evans, G., Sanishvili, R., Dementieva, I. & Joachimiak, A. (1999). Acta Cryst. D55, 1726–1732. [DOI] [PubMed]
- Zhang, Z., Sauter, N. K., van den Bedem, H., Snell, G. & Deacon, A. M. (2006). J. Appl. Cryst. 39, 112–119.


