

Background: Zinc is vital to normal prostate function and uniquely concentrates in healthy prostate. A hallmark of prostate cancers is diminished zinc levels.
Results: The miR-183 family is overexpressed in prostate cancer and regulates intracellular zinc via suppression of zinc transporters.
Conclusion: Prostatic zinc homeostasis is regulated by microRNAs.
Significance: The miR-183 family regulates zinc and may contribute to prostate carcinogenesis.
Keywords: Epithelial Cell, Metals, MicroRNA, Tumor Marker, Zinc, Prostate Cancer, Zinc Transporters
Abstract
Decreased zinc levels are a hallmark of prostate cancer tumors as zinc uniquely concentrates in healthy prostate tissue. Increased dietary zinc correlates with decreased risk of advanced prostate cancer and decreased mortality from prostate cancer. The mechanisms of prostatic zinc homeostasis are not known. Lower zinc levels in the tumor are correlated directly with decreased expression of the zinc transporter hZIP1. We report identification of a microRNA cluster that regulates multiple zinc transporters, including hZIP1. Screening in laser capture microdissected prostate cancer tumors identified miR-182 as a potential regulator of hZIP1. Regulation of hZIP1 by miR-182 via two binding sites was confirmed in primary prostate cell cultures. miR-96 and miR-183 are expressed as a cluster with miR-182 and share similar sequences. Array profiling of tissue showed that miR-183, -96, and -182 are higher in prostate cancer tissue compared with normal prostate. Overexpression of the entire miR-183-96-182 cluster suppressed five additional zinc transporters. Overexpression of miR-183, -96, and -182 individually or as a cluster diminished labile zinc pools and reduced zinc uptake, demonstrating this miR cluster as a regulator of zinc homeostasis. We observed regulation of zinc homeostasis by this cluster in prostate cells and HEK-293 cells, suggesting a universal mechanism that is not prostate-specific. To our knowledge, this is the first report of a miR cluster targeting a family of metal transport proteins. Individually or as a cluster, miR-183, -96, and -182 are overexpressed in other cancers too, implicating this miR cluster in carcinogenesis.
Introduction
Zinc is a vital micronutrient that uniquely concentrates in the healthy prostate at levels 10-fold higher than other soft tissues (1, 2). More than 50 years of research has consistently shown that prostate cancer (PC)3 lesions have zinc levels ∼6-fold lower than adjacent normal prostate (2, 3), suggesting that zinc has a protective role against cancer development (4). The zinc concentration lowers with the Gleason score of the tumor and is specific to PC (5). Benign diseases of the prostate, prostatitis and benign prostatic hyperplasia, maintain normal zinc levels (1, 5). In the TRAMP (transgenic adenocarcinoma of the mouse prostate) model of prostate cancer, fluorescent imaging of zinc in live animals correctly detected tumors at an early stage by low zinc compared with surrounding normal prostate (6). Epidemiological studies have implicated zinc in PC risk and outcome showing that high dietary zinc was associated with a decrease risk of advanced disease (7) and lower PC-specific mortality (8). Thus, the zinc disparity in PC is hypothesized to contribute to PC etiology (7) and is a viable selective biomarker for PC (6).
Low zinc levels in PC are associated with lower expression of the zinc transporter hZIP1 (3, 9). Also known as SLC39A1, hZIP1 is named after its yeast homolog, Zrt-Irt-like protein. There are 14 known human hZIP transporters that act to increase intracellular labile zinc pools by transporting the ion into cytoplasm from either the extracellular space or organelle (10). There are also known 11 human hZnT human zinc transporter, SiBOA1 proteins that function to decrease labile zinc pools by exporting zinc out of the cell or sequestering it into intracellular compartments (10). The mechanism of reduced hZIP1 expression in PC has not been determined.
MicroRNAs (miR) have emerged rapidly as an important class of short endogenous RNAs that act as post-transcriptional inhibiters of protein expression by base pairing with the 3′-UTR of their target mRNAs. As miR profiling studies have become widespread, aberrant levels of specific miR have been observed in most cancers. miR profiles in PC have been reported (reviewed in Ref. 11), but the miR deregulated in PC have little overlap between studies, which is likely due to differences in study design, sample collection methods, heterogeneity of contaminating stromal cells, and sensitivity/specificity of the detection platforms (11).
We hypothesized that lower levels of the hZIP1 protein and zinc in PC are due to aberrant expression of one or more miR. miR complementary to hZIP1–3′-UTR were screened in laser capture-microdissected prostate epithelium from PC patients. Putative zinc-regulating miR were further investigated in vitro using human primary prostate cultures and PC cell lines. We report the ability of specific miR to regulate intracellular zinc via regulation of zinc transporters.
EXPERIMENTAL PROCEDURES
hZIP1 and miRNA Expression in Patient Tissues
Radical prostatectomy specimens from 10 male patients (five Caucasians and five African-Americans) were selected for analysis via an Institutional Review Board-approved protocol at the University of Illinois Medical Center at Chicago. Normal and PC epithelium was collected from 8-μm Formalin-Fixed paraffin-embedded prostate sections by laser capture microdissection (LCM) with Lieca LMD-100 as described previously (12). Total RNA was isolated using RecoverAll (Invitrogen). Reverse transcription and quantitative PCR (RT-qPCR) with TaqMan Assays for GAPDH, HPRT1, hZIP1, RNU44, RNU48, miR-100, miR-96, miR-30c, miR-223, miR-346, and miR-182 was performed as detailed below and described previously (12).
Cell Cultures
Primary prostatic epithelial (PrE) and stromal (PrS) cells were established from histologically normal areas of the prostate peripheral zone from patients undergoing radical prostatectomy via an Institutional Review Board-approved protocol (University of Illinois Medical Center at Chicago) and maintained as described previously (13, 14). PrE cells were maintained on collagen-coated plates, grown in serum-free prostate epithelial growth medium (Lonza, Walkersville, MD) and used on secondary passage and at ∼75% cell density. PrS cells were maintained in MCDB-105 (Sigma) supplemented with 10% fetal bovine serum. LNCaP, PC3, and HEK-293 cell lines were obtained from ATCC (Rockville, MD) and maintained as directed. To control for density-dependent fluctuations in miR expression (15), miR were measured in all the cells at 75% confluence 24 h after a medium change.
RT-qPCR
For mRNA analysis, cDNA was generated from total RNA (50 ng for LCM-collected RNA, 500 ng for cell cultures) using Vilo Reverse Transcriptase (Invitrogen). For miRNA assays, stem-loop RT was carried out on 10 ng of total RNA with an assay-specific primer using TaqMan miRNA RT Kit (Invitrogen). qPCR was run on Step One Plus (Applied Biosystems) with miRNA or mRNA-specific TaqMan assays. Results were normalized to housekeeping RNAs by ΔCt method (16).
Immunoblot for hZIP1 Protein
Cells were collected into protein lysis buffer (Cell Sigaling, Danvers, MA), sonicated, and centrifuged to remove insoluble fraction. Protein (25 μg) was run on a 10% Bis-Tris NuPAGE gel and transferred to PVDF membrane. After a 1-h block at room temperature in TBS/0.1% Tween/5% milk, chicken polyclonal anti-hZIP1 (generous gift from Dr. Renty Franklin at the University of Maryland, Baltimore, MD) was probed at 1:10,000 and anti-β-tubulin (Cell Signaling, Danvers, MA) was probed at 1:2000 overnight at 4 °C. Secondary HRP-conjugated anti-chicken or anti-rabbit was used 1:1000 at room temperature for 1 h. hZIP1 protein levels were quantified as a ratio to β-tubulin using ImageJ software (17).
Pre-miR Transfection
Negative control scrambled pre-miR (NEG) or pre-miR to miR-183, miR-96, or miR-182 (Invitrogen) were transfected into cells at specified concentration (5–50 nm) by reverse transfection using siPORT NeoFX (Invitrogen) according to the manufacturer's instructions.
Luciferase Assay
Cells were seeded into 24-well plates and used at 75% confluence. hZIP1–3′-UTR or random 3′-UTR 2 (Switchgear Genomics, Menlo Park, CA), pRL-null (Promega, Madison, WI), and pre-miR (Invitrogen) were co-transfected into cells using Dharmafect Duo (Dharmacon). Dual-Luciferase assay (Promega) was run 24 h after transfection. Data shown as ratio of luc/Renilla-luc to normalize for transfection efficiency. Mutations were introduced to the two predicted miR-182/96 binding sites of the hZIP1 3′-UTR reporter construct (mutagenesis primers, 5′-ccagtcctgcttactcctctatttttaaagggacgagcaaatccccttcctctttctc-3′ and 5′-catgcccagatgataaacactgagcggacgagacatttttttaaatacacccgagga-3′) following the recommended protocol for the QuikChange Lightning site-directed mutagenesis kit (Stratagene, La Jolla, CA). The mutagenized construct was confirmed by sequencing.
miR-183-96-182 Expression in Outside Patient Data Set
The expression of the miR-183-96-182 cluster was assessed in an outside patient data set from the tissue bank of the Erasmus University Medical Center (Rotterdam, the Netherlands). 50 fresh-frozen primary prostate cancer and 11 normal adjacent prostate samples were obtained by radical prostatectomy. Histological evaluation and Gleason grading were performed by two pathologists on hematoxylin/eosin-stained frozen sections for all analyzed samples. Tumor samples in which at least 60% of the cells were cancerous and contained at least 60% ducts were selected for analysis. The non-tumor samples contained 0% tumor cells and at least 60% ducts. Collection of patient samples has been performed according to the Dutch national legislation concerning ethical requirements. Use of these samples has been approved by the Erasmus MC Medical Ethics Committee according to the Medical Research Involving Human Subjects Act (MEC-2004-261).
Total RNA was isolated from frozen tissue samples using RNABee reagent (Campro Scientific, GmbH) according to the manufacturer's protocol. Microarray analysis of miRNA expression was performed using human miR V2 microarrays (Agilent) that contain probe sets for 723 human microRNAs from the Sanger MiRBase (version 10.1). Microarray pre-processing and hybridization were performed according to the manufacturer's protocols. Prior to analysis, raw hybridization signals were background-subtracted, quantile-normalized, and scaled to the median of all samples. miR that were assigned a present call in at least 50% in any one of the tested conditions were examined for differential expression by a Welch t test (unpaired, two tails, α-level, 0.05), followed by multiple testing correction by the method of Benjamini and Hochberg (corrected p value cut-off of 0.05) (18) miR that passed the t test and had significant corrected p values were further filtered on difference in fold change between both conditions (cut-off > 1.5). The array data were submitted using Tab2MAGE to the ArrayExpress database (accession no. E-TABM-794).
Intracellular Zinc Concentration
Cells were reverse-transfected with pre-miR (50 nm) via NeoFX siPORT into 30-mm collagen-coated dishes per the manufacturer's instuctions. Following transfection (48 h) cells were scraped into EDTA-free cell lysis buffer and lysed by freeze-thaw and sonication. Protein was quantified by Bio-Rad protein reagent (Bio-Rad), and 50 μl were loaded onto a QuantiChromTM zinc assay kit (BioAssay Systems, Hayward, CA) and visualized according to manufacturer's protocol. Results are shown as pmol of zinc per μg of protein.
Zinc Import
HEK-293 cells (7500 cells/well) were reverse-transfected with pre-miR as described above in collagen-coated 96-well clear-bottomed black-walled plates. 48 h after transfection, cells were loaded with 2 μm FluoZin-3 (Invitrogen) for 30 min. Cells were washed twice with medium and allowed to equilibrate for 15 min. Medium was changed to phenol red-free HBS (HEPES-buffered saline) for fluorescence. ZnSO4 (final concentration, 150 μm) was added, and fluorescence data (excitation, 494 nm; emission, 516 nm) were collected in every 30 s for 10 min (Synergy HT, BioTek, Winooski, VT). Following subtraction of background fluorescence (without zinc addition), fluorescence at 516 nm was analyzed as percentage of time zero fluorescence. Representative image of FluoZin-3 fluorescence counterstained with Hoechst 33342 with and without zinc was collected with the Zeiss LSM 510 confocal microscope.
RESULTS
miR-182 Expression Inversely Correlated with hZIP1 in PC Patient Tissue
We rationally selected six miR (miR-30c, miR-96, miR-100, miR-182, miR-223, and miR-346) for screening as putative regulators of hZIP1. Because hZIP1 levels are lower in PC, miR selection was based on computationally predicted binding to hZIP1–3′-UTR (TargetScan,version 5.1 (19), miRanda-mirSVR (20), Human MicroRNA Targets by Memorial Sloan-Kettering Cancer Center Computational Biology (21)), and/or reported overexpression in PC (22). Expression of these miR and hZIP1 was measured in LCM-collected PC and adjacent histologically normal epithelium from 10 radical prostatectomy specimens. Because hZIP1 levels were shown previously to be lower in African-American men (9), we performed analysis on the specimens as a whole and by race. In our small specimen set, we did not observe a statistically significant difference in the expression levels for hZIP1 mRNA for any of the miRNAs between the African-American (n = 5) and Caucasian men (n = 5) (data not shown). Both miR-182 and miR-346 expression inversely correlated with hZIP1 mRNA (Spearman ρ = −0.77, p = 0.03; and ρ = −0.69, p = 0.03, respectively) (Table 1 and Fig. 1A) in Caucasians only. miR-182 tended to be higher in PC tissue (t test p = 0.18, n = 10) but was not statistically significant in our small data set. Interestingly, miR-30c, miR-346, miR-223, and miR-100 were present at lower levels in PC tissue (Table 1), consistent with previous reports of global miR down-regulation in PC (23). miR-96 was not detectable in the patient samples.
TABLE 1.
miRNAs and hZIP1 expression in patient prostate tissue
p < 0.05, indicated in bold.
| mRNA | Correlation with hZIP1a | Fold change in PCb |
|---|---|---|
| miR-30c | ||
| All patients | r = −0.04 (p = 0.86) | −2.39 (p= 0.01) |
| Cauc patients | r = −0.38 (p = 0.27) | −3.03 (p = 0.10) |
| AA patients | r = 0.34 (p = 0.33) | −2.21 (p= 0.03) |
| miR-100 | ||
| All patients | r = −0.12 (p = 0.62) | −2.01 (p = 0.06) |
| Cauc patients | r = −0.26 (p = 0.46) | −1.59 (p = 0.27) |
| AA patients | r = 0.16 (p = 0.64) | −2.40 (p = 0.07) |
| miR-182 | ||
| All patients | r = −0.33 (p = 0.10) | 1.43 (p = 0.24) |
| Cauc patients | r= −0.77 (p= 0.01) | 2.37 (p = 0.14) |
| AA patients | r = 0.29 (p = 0.39) | 1.34 (p = 0.34) |
| miR-223 | ||
| All patients | r = −0.14 (p = 0.54) | −2.23 (p= 0.04) |
| Cauc patients | r = −0.53 (p = 0.12) | −3.32 (p = 0.16) |
| AA patients | r = 0.38 (p = 0.27) | −1.77 (0.07) |
| miR-346 | ||
| All patients | r = −0.16 (p = 0.48) | −2.26 (p = 0.06) |
| Cauc patients | r= −0.69 (p= 0.03) | −3.01 (p = 0.07) |
| AA patients | r = 0.34 (p = 0.32) | −1.15 (p = 0.31) |
| hZIP1 | ||
| All patients | NAc | −1.29 (p= 0.05) |
| Cauc patients | NA | −1.52 (p = 0.11) |
| AA patients | NA | −1.20 (p = 0.19) |
a Spearman's correlation coefficient between hZIP1 mRNA and miRNA, p value based on n = 20 observations; normal and PC samples from 10 patients (five Caucasians (Cauc) and five African-Americans (AA)).
b Average fold change in PC compared to normal tissue with p value from paired student's t-test from n = 26 observations; normal and PC samples from 10 patients (five Caucasians and five African-Americans).
c NA, not applicable.
FIGURE 1.
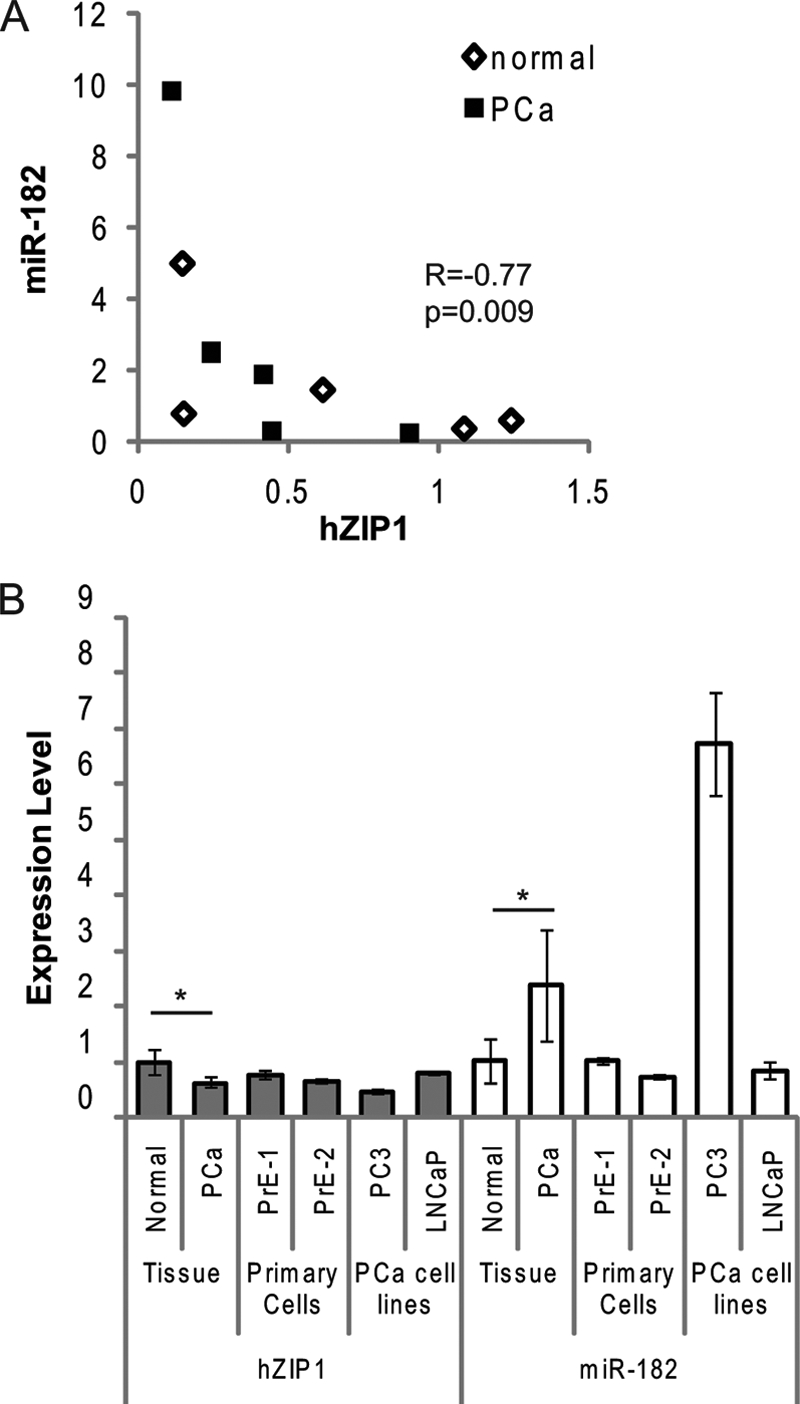
hZIP1 and miR-182 levels in patient tissues and in primary human prostate epithelial cells. A, Spearman correlation between miR-182 and hZIP1 mRNA in LCM-collected patient prostate epithelial tissue samples measured by RT-qPCR. Relative levels of expression are on the axes, and the Spearman ρ and p value are shown (n = 10; five patients, normal (open diamonds) and PC (squares) tissue for each). Data shown are relative value to patient 1. B, RT-qPCR analysis of basal levels of hZIP1 mRNA and miR-182 in LCM-collected epithelium from PC (PCa) patients (n = 5), primary normal epithelial cells (PrE-1 and PrE-2, cells from two patients), and PC cell lines (PC3 and LNCaP). Data are shown relative to PrE-1. miR-182 normalized to RNU44 and hZIP1 normalized to GAPDH. *, p < 0.01 paired t test between the normal and cancer tissue. The graph is representative of three independent experiments, and error bars represent S.D. of technical duplicates.
miR-182 Regulates hZIP1 Expression in Vitro
miR-182 was selected for in vitro studies because it was expressed higher in PC and had two putative binding sites in the hZIP1–3′-UTR, as opposed to miR-346, which was lower in PC and only had one binding site in hZIP1. We examined hZIP1 and miR-182 expression in two prostate cancer cell lines (LNCaP, PC3), in two patient-derived primary prostatic epithelial cell cultures (PrE-1, PrE-2) and in primary prostatic stromal cells (PrS-1, PrS-2). Both hZIP1 and miR-182 were expressed specifically in epithelial-derived primary cultures and PC cell lines (Fig. 1B). The PC cell line PC3 showed the highest level of miR-182 and the lowest of hZIP1 mRNA. Neither hZIP1 nor miR-182 was expressed highly in PrS cells (Fig. 1B), which is consistent with zinc accumulating in zinc epithelium.
We next tested the ability of miR-182 to alter hZIP1 in cells. Transient transfection of pre-miR-182 decreased hZIP1 protein in PrE cells (Fig. 2A). Pre-miR-182 also decreased hZIP1 mRNA in PrE cell lines (data from two patients PrE-1 and PrE-2) and in LNCaP cells (Fig. 2B). Specific overexpression of the mature miR-182 following pre-miR transfection was confirmed by RT-qPCR (supplemental Fig. S1). The 3′-UTR of hZIP1 (NM_014437.3) contains two putative binding sites for miR-182 at positions 574 and 814 (Fig. 2C). Transfection of cells with pre-miR-182 decreased luciferase activity of a luc-hZIP1–3′-UTR construct (Fig. 2D). To confirm the putative miR-182 binding sites, the sites were mutated by site-directed mutagenesis (Fig. 2C). miR-182 transfection did not alter luciferase activity of the hZIP1–3′-UTR-mut construct (Fig. 2D). These experiments confirmed regulation of hZIP1 by miR-182 via two binding sites in the 3′-UTR.
FIGURE 2.

Regulation of hZIP1 by miR-182 and validation of miR-182 binding sites in hZIP1 3′-UTR in normal PrE cells. A, immunoblot of hZIP1 protein in PrE cells 48 h following transfection with 50 nmol of pre-miR-182 or pre-miR-NEG (ratio to β-tubulin). B, hZIP1 mRNA in two PrE cell lines and in LNCaP prostate cancer cells 48 h following transfection with 50 nmol of pre-miR-182 or pre-miR-NEG. Results are shown relative value to pre-miR-NEG transfection. hZIP1 normalized to β2-microglobulin. Error bars represent S.D. of replicate experiments. C, predicted miR-182 binding sites in hZIP1 3′-UTR and site-directed mutagenesis locations (underlined in boldface type). D, luciferase activity of luc-hZIP1–3′-UTR or luc-hZIP1-mut-3′-UTR 24 h following co-transfection with prL-null, pre-miR-182 or pre-miR-NEG. Results were normalized to Renilla luciferase and shown as percentage of control. Error bars represent S.D. of replicate experiments. *, p < 0.05 paired t test. Results are representative of three or more independent experiments.
Expression of miR-183, miR-96, and miR-182 Cluster Is Higher in PC
miR-182 is transcribed on a polycistronic RNA strand with miR-96 and miR-183 (Fig. 3A), which is then processed into the three mature miR (24). All three miR have a high degree of sequence homology and potentially overlapping mRNA targets (Fig. 3A). Therefore, we investigated the expression of miR-183 and miR-96 in prostate tissue and cells and the ability of these miR to regulate hZIP1.
FIGURE 3.

miR-183-96-182 cluster expression in prostate cells and patient tissue. A, miR-183-96-182 expressed as polycistronic RNA on chromosome 7 and sequence alignment for human miR-183, miR-96, and miR-182. B, miR-183, -96, and -182 expression in human prostate tissue by cDNA array. Graphs shows mean expression ± 95% confidence intervals for normal (norm) prostate (n = 11) and PC (PCa) tissue (n = 50). **, p < 10E-7 unpaired t test. Adaptation of data was by Martens-Uzunova et al. (25). C, basal levels of miR-183, miR-96, and miR-182 in human prostate cell cultures by RT-qPCR. Results shown relative to PrE-1 and normalized to RNU44 and RNU48. Error bars represent S.D. of duplicate experiments.
miR microarray profiling of an outside patient cohort of 50 patients with organ-confined prostate tumors and 11 normal controls demonstrated that the expression levels of miR-183, miR-96, and miR-182 were increased with at least 2-fold in PC tissue compared with normal adjacent prostate (Fig. 3B) (25). The observed up-regulation was found significant when examined by a Welch t test, followed by multiple testing correction by the method of Benjamini and Hochberg (corrected p values of 0.002, 0.0002, and 0.00008, for miR-183, miR-96, and miR-182, respectively). Correlation analysis of the miR showed that expression levels of miR-183 and miR-96 are highly correlated to each other in patients (r = 0.77, p < 0.0005) but that miR-182 levels did not correlate with the levels of other two miR (supplemental Table S1). Zinc transporter levels for these patients were not included in this data set. These results indicate that in addition to miR-182, miR-183, and miR-96 are present at higher levels in PC and may contribute to hZIP1 mRNA regulation. Also, the lack of expression correlation between all three miR suggest that there is secondary regulation of the individual miR following transcription as a single transcript as miR-183-96-182.
miR-183 was not included in our original miRNA screen in patients, and miR-96 was undetectable by our technique. All three miR (183, 96, and 182) are present in prostatic epithelial PrE and PC cell lines, but not in prostatic stromal PrS cells (Fig. 3C). miR-96 was lower in all cells that expressed the cluster, suggesting expression regulation secondary to transcription. PC3 cells, which are androgen-independent, express higher levels of the cluster, suggesting that the expression of miR-183-96-182 may further increase with disease progression.
miR-183, -96, and -182 Regulate hZIP1
Because miR-183, -96, and -182 are expressed biologically together as a cluster, we tested the ability of the miR to regulate hZIP1 individually and as a cluster. Transient transfection with pre-miR showed strong down-regulation of hZIP1 mRNA and protein by miR-96 and miR-182 (Fig. 4, A and B), which is consistent with the predicted binding sites for those miR. miR-183 lowered hZIP1 mRNA to a lesser degree, but the inhibitory effect on hZIP1 was strongest when all three miR were expressed in concert. Interestingly, although miR-182 and -183 have higher homology overall, miR-183 has a one-base difference near the 5′ end where hZIP1 binding occurs (Fig. 3B). Our results suggest that this small change is enough to alter its affinity for the target.
FIGURE 4.

miR-183-96-182 cluster regulation of hZIP1 and intracellular zinc in primary prostate epithelial cells. hZIP1 mRNA (A) and protein (B) levels 24 h after transfection of miR-183, miR-96, or miR-182 in PrE cells. mRNA measured by RT-qPCR and protein by immunoblotting. Ratio to β-tubulin for immunoblot. C, luciferase activity of luc-hZIP1–3′-UTR or luc-hZIP1-mut-3′-UTR 24 h following co-transfection with prL-null, pre-miR-182 or pre-miR-NEG. Results were normalized to Renilla luciferase and shown as percentage of control. Error bars represent S.D. of replicate experiments. D, intracellular zinc in PrE cells 48 h following transfection with 15–50 nm pre-miR to miR-183, miR-96, and miR-182. Error bars are S.E. of three experiments. *, p < 0.05 paired t test.
The two putative bindings sites for miR-182 in hZIP1 3′-UTR are highly conserved across species (supplemental Fig. S2). Despite highly similar sequences, target prediction software predicted the formation of hybrids between hZIP1 and miR-96 and -182, not with miR-183. Alignment and free energy of hybridization were calculated for each of the miR with hZIP1 using RNAhybrid (45) (supplemental Fig. S3).
miR-183, -96, and -182 all inhibited the luc-hZIP1–3′-UTR construct and had no effect on the mutated 3′-UTR (Fig. 4C), indicating functionality of the putative miR binding sites. Mutation of the miR binding sites individually showed that miR-96 preferentially binds to the 575 site, whereas miR-182 can bind both of the sites (Fig. 4C).
miR-96 and miR-182 Inhibit Zinc Uptake
To determine whether altering hZIP1 levels was of biological significance, we examined intracellular zinc concentration. Overexpression of miR-96 and miR-182 and miR-183-96-182 together significantly lowered intracellular zinc levels in PrE cells (Fig. 5A). miR-183 alone lowered zinc to a lesser degree. These results show that the cluster of miR-183-96-182 inhibits hZIP1.
FIGURE 5.

miR-183-96-182 cluster regulates intracellular zinc uptake. A, luciferase activity of luc-hZIP1–3′-UTR or luc-hZIP1-mut-3′-UTR 24 h following co-transfection with prL-null, pre-miR-183, pre-miR-96, pre-miR-182, or pre-miR-NEG (nm of pre-miR indicated on x axis). Results were normalized to Renilla luciferase and shown as percentage of control. Error bars represent S.D. of replicate experiments. *, p < 0.05 paired t test. B, intracellular zinc in HEK-293 cells imaged with FluoZin-3 (green) and nuclei stained with Hoescht (blue) 0 and 3 min after adding 150 μm ZnSO4. C, quantification of zinc uptake by FluoZin-3 fluorescence in HEK-293 cells. Data collected every 45 s for 10 min and shown as percentage of time zero fluorescence. Zinc uptake measured 24 h following transfection with 50 nm pre-miR-NEG, pre-miR-183, pre-miR-96, or pre-miR-182. The no zinc line is a negative control to demonstrate no change in FluoZin-3 fluorescence in the absence of zinc. Data points represent the mean, and error bars represent S.E. of three independent experiments that each contained technical duplicates. *, p < 0.05 paired t test.
We next examined intracellular zinc import. HEK-293 (human embryonic kidney) cells were used to measure zinc uptake as these cells transfect at high efficiency and have been used previously for zinc transport assays (26). In the HEK-293 cells, miR-183, -96, and -182 regulate hZIP1 expression and luc-hZIP1–3′-UTR similarly to our previous observations in prostate cells (Fig. 5A). Two days after transfection with pre-miR, cells were loaded with FluoZin-3, a fluorescent dye that specifically binds to intracellular labile zinc (Fig. 5B). Then, zinc was added to the cells and the intracellular zinc content measured over time via FluoZin-3 fluorescence. Because zinc was added in excess to the medium, this method will show the overall zinc uptake into the cell. The results demonstrate the amount of zinc in the cell at each time point but do not differentiate between the rate of zinc import and export. Regulation of zinc uptake in HEK-293 cells echoed our previous results for total intracellular zinc in that expression miR-96, miR-182, or all three miR inhibited zinc uptake, whereas miR-183 alone only trended to decrease the zinc (Fig. 5C). These results show that acute intracellular zinc import is attenuated by miR-96/182. Also, as these experiments were carried out in HEK-293 cells, which are human embryonic kidney cells, demonstrates that zinc regulation by the miR is not unique to prostate cells.
miR-183-96-182 Regulate Multiple Zinc Transporters
Given the marked effect of the miR on zinc levels and the presence of other zinc transporters in prostate cells (27), we next examined the ability of this miR cluster to regulate other zinc transporters. We selected additional zinc transporters based on computational predicted miR target analysis and on a study by Xu et al. (24), which showed five hZIPs and three hZnTs are putative mRNA targets for miR-183, miR-96, or miR-182. Of the eight additional zinc transporters analyzed, overexpression of miR-183-96-182 together in PrE cells suppressed mRNA levels of six zinc transporters (hZIP1, hZIP3, hZIP7, hZIP9, hZnT1, and hZnT7) and did not affect two zinc transporters (hZIP10, hZnT9) (Table 2). Transfection with the miR individually suppressed zinc transporter mRNAs as predicted by binding sites in the 3′-UTRs, but the effects were stronger when the miR were transfected together. FOXO3 has previously been reported to be regulated by miR-182 and miR-96 (28, 29) and was included as a positive control.
TABLE 2.
Regulation of zinc transporters by miR-183-96-182 cluster
| Zinc transporter | miR sites in 3′-UTR (no.) | Change in mRNA by miR overexpressiona |
|||
|---|---|---|---|---|---|
| miR-183 | miR-96 | miR-182 | miR-183/96/182 | ||
| % | |||||
| hZIP1 | miR-182 (2), miR-96 (2) | −25 | −72 | −73 | −76 |
| hZIP3 | miR-96 (1) | −24 | −41 | −24 | −34 |
| hZIP7 | miR-182 (1), miR-96 (1) | −20 | −43 | −30 | −27 |
| hZIP9 | miR-96 (1) | +18 | −23 | −26 | −45 |
| hZIP10 | miR-96 (1) | +45 | −2 | −7 | −8 |
| hZnT1 | miR-182 (1) | +57 | +27 | −37 | −15 |
| hZnT7 | miR-182 (1) | −17 | −33 | −50 | −55 |
| hZnT9 | miR-183 (1) | −28 | +1 | −1 | −15 |
| FOXO3 | miR-182 (2), miR-96 (2) | −25 | −34 | −15 | −33 |
a PrE cells transfected for 48 h with 50 nm of pre-miR to -183, -96, or -182. mRNA quantified by qRT-PCR were normalized to TATA box-binding protein and shown as percent change compared to cells transfected with pre-miR-neg (scrambled). Shown are the mean of three independent experiments with three different PrE cell lines.
DISCUSSION
Intracellular zinc is tightly controlled as zinc is required for many physiological processes, including structural functions, catalytic functions, gene expression, protein-protein interactions, fatty acid metabolism, apoptosis, and signal transduction (30). Unlike most organs that maintain very low zinc levels, the prostate distinctively concentrates zinc, a phenotype that is diminished in malignant prostate. In PC tissue, we observed consistently lower levels of the zinc transporter, hZIP1, and screened for miR inversely correlated to hZIP1. We identified miR-182 as being inversely associated with hZIP1 mRNA in PC patients. A caveat to this approach is that any miR overexpressed in PC would inversely correlate with hZIP1 but not necessarily be a regulator of hZIP1. Therefore, we made use of cell cultures to validate hZIP1 as a bona fide target of miR-182. Not only did we confirm miR-182 as a regulator of hZIP1, we observed regulation of other zinc transporters and labile zinc by miR-183, -96, and -182. During preparation of this work, Zou et al. (31) showed that RREB-1 (ras responsive element binding protein-1) contributes to regulation of hZIP1 in the PC3 cell line. In agreement with their data, in our experiments, hZIP1 expression was not altered in PC3 cells transfected with miR -183, -96, and -182 (data not shown). The RREB-1 regulation of hZIP1 may also fit into the miR-183 family regulation of zinc as RREB-1 contains a putative binding sites for miR-183. Although not included in our study, regulation of zinc homeostasis by MTF-1 (metal-responsive element binding transcription factor-1), metallothionein proteins, and others should not be discounted.
Clustered miRNAs account for 37% of human miRNAs and are thought to exist as a mechanism to more efficiently coordinate complex cell processes than regulation by a single miRNA can provide (32). Mature miR-183, -96, and -182 have similar sequences and are highly conserved across species (humans to zebrafish), suggesting that they are the result of an ancient gene duplication. We show here that miR-183, -96, and -182 function to target several proteins involved in zinc import/export to have an overall regulation of zinc homeostasis. We observed regulation of zinc homeostasis by this cluster in both prostate cells and HEK-293 cells, suggesting a universal mechanism that is not unique to the prostate. The mechanism that regulates expression of this cluster is not known. miR-182 expression has been shown to be responsive to ionizing radiation (33). Of note, we did not observe changes in miR-183-96-182 following exposure to high levels of zinc (data not shown).
Either individually or as a cluster, the levels of miR-183, miR-96, and miR-182 have been shown to be deregulated in cancer, autoimmunity, and senescence. The expression of miR-183-96-182 cluster is higher in PC compared with normal prostate in a recent study by Schaefer et al. (34). They further found that expression of these miR along with miR-149, -181b, -205, and -375 correctly identified PC from normal tissue with an area under the curve of 0.88 (34). miR-96 and miR-182 are expressed at a high level in urothelial carcinoma and detection of the miR in urine correlated with disease stage and grade (35). Dai et al. (36) recently reported a 10-fold increase in miR-183-96-182 cluster expression in splenocytes in a mouse model of lupus, suggesting a role for this cluster in autoimmunity. miR-183 and miR-182 were overexpressed in stress-induced premature senescence in vitro (37). Of relevance to zinc, the miR-183-96-182 cluster is highly expressed in the adult mammalian retina (24), also a zinc-rich organ like prostate, and may be involved in insulin signaling (38).
Mature miR-183, -96, and -182 have sequence similarity but have distinct and common mRNA targets. Both miR-96 and miR-182 are reported to target FOXO1 and FOXO3 in breast and melanoma cancer cell lines and endometrial tumors (28, 29, 39; Myatt, 47). mir-182 also targets BRCA1 and may sensitize cells to poly(ADP-ribose) polymerase inhibitors (33). The miR-182 knock-out mouse does not have an apparent phenotype (40), suggesting potential compensation by miR-96 and miR-183. Of note, we analyzed prostate tissue from these mice and did not detect a difference in hZIP1 in the miR-182−/− mice (data not shown), further suggesting that there is redundancy in the targets of the miR-183-96-182 cluster. miR-183 has mRNA targets distinct from miR-96 and -182 despite similar sequences. Sarver et al. (41) showed that miR-183 was highly expressed in synovial sarcomas and acts as an oncomir by targeting EGR1 mRNA.
The questions remain on whether dietary zinc is chemoprotective in the prostate or whether low zinc in PC is tied to its dedifferentiated phenotype. Animal and epidemiology studies have shown mixed results for the chemopreventive activity of dietary zinc. In the TRAMP mouse model of PC, dietary zinc supplementation reduced tumor size and PC serum indicators, supporting a chemoprotective effect of zinc (42). There are two large cohort studies that looked at supplemental zinc and PC risk. Gonzalez et al. (7) found that zinc supplementation did not decrease in overall PC but did decrease the risk of advanced PC diagnosis (hazard ratio = 0.34). In a Swedish cohort, there was no association between dietary zinc and PC (43), but high zinc supplementation did associate with reduced risk of PC-specific death (hazard ratio = 0.64) (8).
There are several hypotheses on the role of zinc disparity in prostate carcinogenesis. One is that low zinc changes the metabolic state of the prostate cell and is thus a contributor to carcinogenesis. The proposed mechanisms is that high zinc in normal prostate inhibits mitochondria aconitase, causing decreased citrate oxidase (44). In contrast, the lower zinc in PC may facilitate increased citrate oxidation, which then increases available energy that is required for tumor growth. Another hypothesis is that high zinc is a phenotype of differentiated luminal prostate cells, therefore PC cells, which are in dedifferentiated state, have lost the ability to sequester zinc because of dedifferentiation. Therefore, although low zinc is a robust phenotype of PC, it is not clear whether low zinc contributes to carcinogenesis or is a result of carcinogenesis.
In summary, we show that the cluster of miR-183-96-182 is a regulator of intracellular zinc concentrations in prostate cells. Furthermore, we and others have shown overexpression of this miR cluster in PC, implicating a role for this miR-cluster in carcinogenesis. Further analysis of miR-183-96-182 in preneoplastic lesions is needed to investigate its regulation in early disease. Mouse transgenic and knock-out models will provide insight into the role of this cluster in the development of normal prostate, zinc homeostasis, and prostate carcinogenesis.
Zinc is an essential micronutrient and the discovery of the control of intracellular zinc by a highly conserved miR cluster is novel and suggests an epigenetic component to zinc homeostasis within cells. This finding has distinctive relevance to PC given the marked decrease in zinc levels and its potential in promoting this disease. Finally, our results have implications not only in PC but also in other cancers and in other organs with high zinc.
Supplementary Material
Acknowledgments
We thank Drs. Virigila Macias and Yi Lu for help with specimen selection and pathological identification, Dr. Alan Diamond for proofreading, Lindsay Gallagher for technical support, Dr. Margaret Wright for statistical help, and Dr. Tapio Visacorpi and Dr. Guido Jenster for the design and implementation of microarray experiments. We also thank Dr. Renty Franklin at the University of Maryland (Baltimore, MD) for the hZIP1 antibody and Dr. Naoharu Iwai at the Shiga University of Medical Science (Otsu, Japan) for providing prostate tissue from miR-182 knock-out mice.
This work was supported by the Faculty Seed Award from the University of Illinois at Chicago Institute for Research on Race and Public Policy (to L. N.), Department of Defense Grant PC074307 (to A. K.-B.), University of Illinois at Chicago Honors College Undergraduate award (to E. A. K.), Sigma Xi grant-in-aid Research award (to E. A. K.), Phi Kappa Phi Scholarly Projects grant (to E. A. K.), the C. M. Craig Fellowship Summer Research program (to D. N. J.), and Grant 201438 from the European Union Seventh Framework Programme (FP7/2007-2013) (to E. M.-U.).

The on-line version of this article (available at http://www.jbc.org) contains supplemental Table S1 and Figs. S1–S3.
- PC
- prostate cancer
- miR
- microRNA(s)
- LCM
- laser capture microdissection
- qPCR
- quantitative PCR
- luc
- luciferase
- PrE
- primary prostatic epithelial
- PrS
- primary prostatic stromal
- hZnT
- human zinc transporter.
REFERENCES
- 1. Costello L. C., Franklin R. B., Feng P., Tan M., Bagasra O. (2005) Cancer Causes Control 16, 901–915 [DOI] [PubMed] [Google Scholar]
- 2. Mawson C. A., Fischer M. I. (1952) Can J. Med. Sci. 30, 336–339 [DOI] [PubMed] [Google Scholar]
- 3. Franklin R. B., Feng P., Milon B., Desouki M. M., Singh K. K., Kajdacsy-Balla A., Bagasra O., Costello L. C. (2005) Mol. Cancer 4, 32. [DOI] [PMC free article] [PubMed] [Google Scholar]
- 4. Habib F. K., Mason M. K., Smith P. H., Stitch S. R. (1979) Br. J. Cancer 39, 700–704 [DOI] [PMC free article] [PubMed] [Google Scholar]
- 5. Cortesi M., Fridman E., Volkov A., Shilstein SSh., Chechik R., Breskin A., Vartsky D., Kleinman N., Kogan G., Moriel E., Gladysh V., Huszar M., Ramon J., Raviv G. (2008) Prostate 68, 994–1006 [DOI] [PubMed] [Google Scholar]
- 6. Ghosh S. K., Kim P., Zhang X. A., Yun S. H., Moore A., Lippard S. J., Medarova Z. (2010) Cancer Res. 70, 6119–6127 [DOI] [PMC free article] [PubMed] [Google Scholar]
- 7. Gonzalez A., Peters U., Lampe J. W., White E. (2009) Nutr. Cancer 61, 206–215 [DOI] [PMC free article] [PubMed] [Google Scholar]
- 8. Epstein M. M., Kasperzyk J. L., Andrén O., Giovannucci E. L., Wolk A., Håkansson N., Andersson S. O., Johansson J. E., Fall K., Mucci L. A. (2011) Am. J. Clin. Nutr. 93, 586–593 [DOI] [PMC free article] [PubMed] [Google Scholar]
- 9. Rishi I., Baidouri H., Abbasi J. A., Bullard-Dillard R., Kajdacsy-Balla A., Pestaner J. P., Skacel M., Tubbs R., Bagasra O. (2003) Appl. Immunohistochem. Mol. Morphol. 11, 253–260 [DOI] [PubMed] [Google Scholar]
- 10. Lichten L. A., Cousins R. J. (2009) Annu. Rev. Nutr. 29, 153–176 [DOI] [PubMed] [Google Scholar]
- 11. Coppola V., De Maria R., Bonci D. (2010) Endocr. Relat. Cancer 17, F1–17 [DOI] [PubMed] [Google Scholar]
- 12. Nonn L., Vaishnav A., Gallagher L., Gann P. H. (2010) Exp. Mol. Pathol. 88, 45–51 [DOI] [PMC free article] [PubMed] [Google Scholar]
- 13. Peehl D. M. (2003) in Prostate Cancer Methods and Protocols (Russell P. J., Kingsley E. A., eds) pp. 41–57, Humana Press, Totowa, NJ [Google Scholar]
- 14. Peehl D. M. (2005) Endocr. Relat. Cancer 12, 19–47 [DOI] [PubMed] [Google Scholar]
- 15. Hwang H. W., Wentzel E. A., Mendell J. T. (2009) Proc. Natl. Acad. Sci. U.S.A. 106, 7016–7021 [DOI] [PMC free article] [PubMed] [Google Scholar]
- 16. Livak K. J., Schmittgen T. D. (2001) Methods 25, 402–408 [DOI] [PubMed] [Google Scholar]
- 17. Rasband W. S. (2011) ImageJ, U. S. National Institutes of Health, Bethesda, MD [Google Scholar]
- 18. Benjamini Y., Hochberg Y. (1995) Journal of the Royal Statistical Society 57, 289–300 [Google Scholar]
- 19. Lewis B. P., Burge C. B., Bartel D. P. (2005) Cell 120, 15–20 [DOI] [PubMed] [Google Scholar]
- 20. Betel D., Wilson M., Gabow A., Marks D. S., Sander C. (2008) Nucleic Acids Res. 36, D149–153 [DOI] [PMC free article] [PubMed] [Google Scholar]
- 21. John B., Enright A. J., Aravin A., Tuschl T., Sander C., Marks D. S. (2004) PLoS Biol. 2, e363. [DOI] [PMC free article] [PubMed] [Google Scholar]
- 22. Ambs S., Prueitt R. L., Yi M., Hudson R. S., Howe T. M., Petrocca F., Wallace T. A., Liu C. G., Volinia S., Calin G. A., Yfantis H. G., Stephens R. M., Croce C. M. (2008) Cancer Res. 68, 6162–6170 [DOI] [PMC free article] [PubMed] [Google Scholar]
- 23. Ozen M., Creighton C. J., Ozdemir M., Ittmann M. (2008) Oncogene 27, 1788–1793 [DOI] [PubMed] [Google Scholar]
- 24. Xu S., Witmer P. D., Lumayag S., Kovacs B., Valle D. (2007) J. Biol. Chem. 282, 25053–25066 [DOI] [PubMed] [Google Scholar]
- 25. Martens-Uzunova E. S., Jalava S. E., Dits N. F., van Leenders G. J., Moller S., Trapman J., Bangma C. H., Litman T., Visakorpi T., Jenster G. (2011) Oncogene [Epub ahead of print] [DOI] [PubMed] [Google Scholar]
- 26. Ohana E., Hoch E., Keasar C., Kambe T., Yifrach O., Hershfinkel M., Sekler I. (2009) J. Biol. Chem. 284, 17677–17686 [DOI] [PMC free article] [PubMed] [Google Scholar]
- 27. Albrecht A. L., Somji S., Sens M. A., Sens D. A., Garrett S. H. (2008) Biometals 21, 405–416 [DOI] [PubMed] [Google Scholar]
- 28. Guttilla I. K., White B. A. (2009) J. Biol. Chem. 284, 23204–23216 [DOI] [PMC free article] [PubMed] [Google Scholar]
- 29. Segura M. F., Hanniford D., Menendez S., Reavie L., Zou X., Alvarez-Diaz S., Zakrzewski J., Blochin E., Rose A., Bogunovic D., Polsky D., Wei J., Lee P., Belitskaya-Levy I., Bhardwaj N., Osman I., Hernando E. (2009) Proc. Natl. Acad. Sci. U.S.A. 106, 1814–1819 [DOI] [PMC free article] [PubMed] [Google Scholar]
- 30. Truong-Tran A. Q., Ho L. H., Chai F., Zalewski P. D. (2000) J. Nutr. 130, 1459S-1466S [DOI] [PubMed] [Google Scholar]
- 31. Zou J., Milon B. C., Desouki M. M., Costello L. C., Franklin R. B. (2011) Prostate [Epub ahead of print] [DOI] [PMC free article] [PubMed] [Google Scholar]
- 32. Altuvia Y., Landgraf P., Lithwick G., Elefant N., Pfeffer S., Aravin A., Brownstein M. J., Tuschl T., Margalit H. (2005) Nucleic Acids Res. 33, 2697–2706 [DOI] [PMC free article] [PubMed] [Google Scholar]
- 33. Moskwa P., Buffa F. M., Pan Y., Panchakshari R., Gottipati P., Muschel R. J., Beech J., Kulshrestha R., Abdelmohsen K., Weinstock D. M., Gorospe M., Harris A. L., Helleday T., Chowdhury D. (2011) Mol. Cell 41, 210–220 [DOI] [PMC free article] [PubMed] [Google Scholar]
- 34. Schaefer A., Jung M., Mollenkopf H. J., Wagner I., Stephan C., Jentzmik F., Miller K., Lein M., Kristiansen G., Jung K. (2010) Int. J. Cancer 126, 1166–1176 [DOI] [PubMed] [Google Scholar]
- 35. Yamada Y., Enokida H., Kojima S., Kawakami K., Chiyomaru T., Tatarano S., Yoshino H., Kawahara K., Nishiyama K., Seki N., Nakagawa M. (2011) Cancer Sci. 102, 522–529 [DOI] [PubMed] [Google Scholar]
- 36. Dai R., Zhang Y., Khan D., Heid B., Caudell D., Crasta O., Ahmed S. A. (2010) PLoS One 5, e14302. [DOI] [PMC free article] [PubMed] [Google Scholar]
- 37. Li G., Luna C., Qiu J., Epstein D. L., Gonzalez P. (2009) Mech Ageing Dev. 130, 731–741 [DOI] [PMC free article] [PubMed] [Google Scholar]
- 38. Xu J., Wong C. (2008) RNA 14, 1276–1283 [DOI] [PMC free article] [PubMed] [Google Scholar]
- 39. Lin H., Dai T., Xiong H., Zhao X., Chen X., Yu C., Li J., Wang X., Song L. (2010) PLoS One 5, e15797. [DOI] [PMC free article] [PubMed] [Google Scholar]
- 40. Jin Z. B., Hirokawa G., Gui L., Takahashi R., Osakada F., Hiura Y., Takahashi M., Yasuhara O., Iwai N. (2009) Mol. Vis. 15, 523–533 [PMC free article] [PubMed] [Google Scholar]
- 41. Sarver A. L., Li L., Subramanian S. (2010) Cancer Res. 70, 9570–9580 [DOI] [PubMed] [Google Scholar]
- 42. Prasad A. S., Mukhtar H., Beck F. W., Adhami V. M., Siddiqui I. A., Din M., Hafeez B. B., Kucuk O. (2010) J. Med. Food 13, 70–76 [DOI] [PMC free article] [PubMed] [Google Scholar]
- 43. Epstein M. M., Kasperzyk J. L., Andrén O., Giovannucci E. L., Wolk A., Hakansson N., Andersson S. O., Johansson J. E., Fall K., Mucci L. L. (2011) Am. J. Clin. Nutr. 3, 586–593 [DOI] [PMC free article] [PubMed] [Google Scholar]
- 44. Costello L. C., Liu Y., Franklin R. B., Kennedy M. C. (1997) J. Biol. Chem. 272, 28875–28881 [DOI] [PubMed] [Google Scholar]
- 45. Krüger J., Rehmsmeier M. (2006) Nucl. Acids Res. 34, W451–W454 [DOI] [PMC free article] [PubMed] [Google Scholar]
Associated Data
This section collects any data citations, data availability statements, or supplementary materials included in this article.