Background: Neuronal differentiation of PC12 cells requires sustained ERK signaling induced by NGF.
Results: Global expression analysis identified a set of genes that was induced preferentially by NGF-mediated ERK signaling. The NGF-induced genes were targeted by AP-1 and CREB transcription factors.
Conclusion: Preferential NGF gene induction is mediated by sustained AP-1 activity.
Significance: A transcriptional program specifically induced during neuronal differentiation has been characterized.
Keywords: AP1 Transcription Factor, ERK, MAP Kinases (MAPKs), Neurodifferentiation, Neurotrophic Factor, PC12 Cells
Abstract
Neuronal differentiation of PC12 cells in response to NGF is a prototypical model in which signal duration determines a biological response. Sustained ERK activity induced by NGF, as compared with transient activity induced by EGF, is critical to the differentiation of these cells. To characterize the transcriptional program activated preferentially by NGF, we compared global gene expression profiles between cells treated with NGF and EGF for 2–4 h, when sustained ERK signaling in response to NGF is most distinct from the transient signal elicited by EGF. This analysis identified 69 genes that were preferentially up-regulated in response to NGF. As expected, up-regulation of these genes was mediated by sustained ERK signaling. In addition, they were up-regulated in response to other neuritogenic treatments (pituitary adenylate cyclase-activating polypeptide and 12-O-tetradecanoylphorbol-13-acetate plus dbcAMP) and were enriched for genes related to neuronal differentiation/function. Computational analysis and chromatin immunoprecipitation identified binding of CREB and AP-1 family members (Fos, FosB, Fra1, JunB, JunD) upstream of >30 and 50%, respectively, of the preferentially NGF-induced genes. Expression of several AP-1 family members was induced by both EGF and NGF, but their induction was more robust and sustained in response to NGF. The binding of Fos family members to their target genes was similarly sustained in response to NGF and was reduced upon MEK inhibition, suggesting that AP-1 contributes significantly to the NGF transcriptional program. Interestingly, Fra1 as well as two other NGF-induced AP-1 targets (HB-EGF and miR-21) function in positive feedback loops that may contribute to sustained AP-1 activity.
Introduction
PC12 rat pheochromocytoma cells are an established cell culture model for studying neuronal differentiation. In response to treatment with nerve growth factor (NGF) and other neuritogenic agents, PC12 cells differentiate into cells resembling sympathetic neurons, as indicated by cessation of cell proliferation, neurite outgrowth, electrical excitability, and expression of neuronal markers. NGF induces differentiation via the receptor-tyrosine kinase, TrkA, which activates downstream signaling pathways including phospholipase Cγ, phosphatidylinositol 3-kinase, and Ras/Raf/MEK/ERK (1). Notably, treatment of PC12 cells with epidermal growth factor (EGF), which also stimulates a receptor-tyrosine kinase (ErbB), fails to induce differentiation but maintains PC12 cell proliferation (2).
The distinct biological responses induced by NGF compared with EGF is intriguing as both growth factors activate receptor-tyrosine kinases that are coupled to a similar set of downstream signaling pathways (3). One of these pathways, the MEK/ERK pathway, has been shown to be necessary and sufficient for NGF-induced differentiation, as expression of constitutively active forms of Ras, Raf, MEK, and ERK results in differentiation even in the absence of NGF (4–10), whereas functional inhibition of Ras or MEK blocks NGF-induced differentiation (8, 11–13). However, EGF also results in robust activation of the ERK pathway. Comparisons of NGF and EGF signaling have indicated that the induction of differentiation by NGF, but not by EGF, is the result of sustained activation of ERK in response to NGF versus transient activation in response to EGF. In particular, ERK activity remains elevated for several hours after NGF stimulation but returns to base-line levels after 30–60 min of treatment with EGF (14–19). The differentiation of PC12 cells thus provides an important model for understanding the mechanisms by which the duration of growth factor signaling can lead to distinct responses at the cellular level.
Whereas the role of sustained ERK activity in NGF-induced differentiation is well established, the transcriptional program that is activated by this sustained ERK signaling and is ultimately responsible for acquisition of a neuronal phenotype has not been as well characterized. The initial transcriptional response to growth factor stimulation is the induction of immediate-early genes within 30–60 min of growth factor stimulation. Nearly all of the immediate-early genes induced by NGF are also induced by EGF (1, 20), so this initial transcriptional response, which occurs before observed differences in NGF- versus EGF-induced ERK signaling, does not distinguish the effects of NGF and EGF treatment. However, previous studies have identified a few genes that are preferentially induced by NGF as compared with EGF at later time points (greater than 1 h) (21–27). In the present study we have expanded this approach by using global expression profiling to identify a set of genes that is preferentially induced by NGF compared with EGF at the time points corresponding to NGF-specific sustained ERK activity (2–4 h after growth factor stimulation). The genes that were up-regulated preferentially by NGF at these times were found to be dependent on sustained ERK activity and to encode many proteins with established roles in neuronal differentiation and/or function. Computational predictions and experimental analysis identified AP-12 and CREB transcription factors as major regulators of this NGF-induced transcriptional program. The expression and in vivo DNA binding activity of several AP-1 family members was enhanced after stimulation with NGF compared with EGF, suggesting that sustained activation of these factors contributes to the preferential induction of a large number of genes in response to NGF. Furthermore, several preferentially NGF-induced AP-1 targets, including Fra1 (Fosl1), miR-21, and HB-EGF, participate in positive feedback regulation of MEK/ERK and AP-1 signaling and thus may contribute directly to propagating sustained AP-1 activity in response to NGF.
EXPERIMENTAL PROCEDURES
Cell Culture and Treatments
PC12 rat pheochromocytoma cells were grown in Dulbecco's modified Eagle's medium (DMEM) (Mediatech) containing 10% fetal bovine serum (HyClone) and 5% horse serum (Invitrogen). For gene expression studies, PC12 cells were plated at 7.6 × 10⁵ cells/60-mm plate and 3.5 × 10⁵ cells per 35-mm plate and allowed to grow for 24 h. After 24 h cells were washed once in low serum media (DMEM with 0.5% horse serum) and then starved for 24 h in this low serum media. PC12 cells were treated with NGF (50 ng/ml; R&D Systems), EGF (25 ng/ml; Calbiochem), PACAP38 (100 nm; Phoenix Pharmaceuticals), TPA (20 nm; Sigma), dbcAMP (0.5 mm, Sigma), and U0126 (10 μm; Cell Signaling Technology).
Microarray Analysis
Microarrays were performed on three independent biological samples. Total RNA for microarray experiments was extracted with TRIzol reagent (Invitrogen). After ethanol precipitation, RNA was applied to an RNeasy column (Qiagen) for further purification as per the manufacturer's protocol. The quality of the RNA was determined using an Agilent bioanalyzer before analysis on Affymetrix Rat Gene 1.0ST microarrays. Microarray sample preparation/labeling, hybridization, scanning, and subsequent data analysis were conducted by the Boston University Microarray Facility. Heatmaps were constructed using the program MultiExperiment Viewer (28).
Real-time Reverse Transcription-Polymerase Chain Reaction (RT-PCR)
Total RNA used for real time RT-PCR was extracted using a TRIzol extraction as per the manufacturer's protocol. Real-time RT-PCR was carried out as previously described (29). Primer sequences are listed in supplemental Table 1.
Gene Ontology Analysis
Overrepresentation of Gene Ontology (GO) terms was determined using the Data Base for Annotation, Visualization and Integrated Discovery (DAVID) Version 6.7 (30, 31). 65/69 preferentially NGF-induced genes had an identifier recognized by the DAVID data base and were used for this analysis. A GO category was considered to be enriched significantly compared with the rat genome as a whole if it was associated with >10% of the genes with a p value <0.05. The DAVID functional annotation clustering tool was used to identify overrepresented clusters of GO terms that co-associate with one another.
siRNA Transfection
PC12 cells were plated at 1 × 10⁵ cells/35-mm plate in 2 ml of complete medium 1 day before transfection with Lipofectamine 2000 (Invitrogen) as per the manufacturer's protocol. A mixture containing 5 μl of Lipofectamine 2000 and the corresponding siRNA in 500 μl of serum-free media was incubated at room temperature for 20 min before adding it to the cells. Negative control siRNA #1 (Ambion, 4390843) and siRNAs targeting Plaur (Ambion, S132350) and PVR (Ambion, S128925) were added at a final concentration of 20 nm. Cells were incubated with the siRNAs for ∼7 h, and then the medium was changed to low serum media for another ∼12 h after which the cells were treated with NGF as indicated in Fig. 4. To assess the extent of knockdown, expression of the siRNA-targeted genes after 2 h NGF treatment was determined by real time RT-PCR.
FIGURE 4.
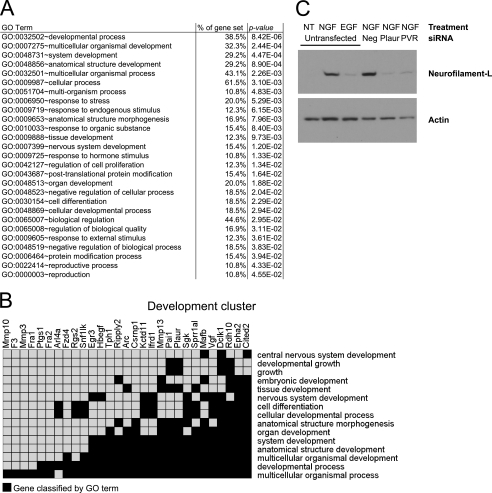
Genes induced preferentially by NGF are enriched for functions related to differentiation/development. A, gene ontology analysis using the DAVID Bioinformatics Data base was conducted on the gene set that was preferentially induced by NGF. Shown are GO terms that were overrepresented in this gene set compared with all rat genes (p < 0.05, >10% of genes had to be classified by a GO term). B, functional cluster analysis of this gene set identified a cluster of similar GO terms related to development/differentiation (p < 0.01, enrichment score = 2.22). An enrichment score >1.3 is generally considered significant. For this analysis, classification stringency was set to low. The GO terms associated with this cluster are shown on the right, and the preferentially NGF-induced genes within this cluster are listed across the top. A black box denotes that a gene was associated with the corresponding GO term. C, Western blot analysis was used to determine levels of neurofilament-L after NGF treatment in the presence/absence of siRNAs against the preferentially NGF-induced genes Plaur and PVR. PC12 cells were transfected with siRNAs against Plaur, PVR, or a negative control siRNA (Neg) and then treated with NGF for 2 days. Knockdown of both Plaur and PVR was greater than 80%. Results are representative of three independent experiments. NT, not treated.
Transcription Factor Binding Site Analysis
Identification of overrepresented transcription factor binding sites in the upstream sequences of the preferentially NGF-induced gene set compared with a background gene set was conducted as previously described (29). The background gene set consisted of 291 genes whose expression levels from the microarray experiments did not change in response to treatment (log 2 < 0.1 and log 2 > −0.1). The regions 5 kb upstream of the transcription start sites in rat and the corresponding human orthologous sequences were analyzed with the MATCH program using the MinSUM threshold for the matrices found in TRANSFAC Version 12.1. Sequences and MULTIZ alignments were obtained from the University of California Santa Cruz Genome Browser (Version rn4/Nov 2004, Version hg18/March 2006), which were available for 43 of the 69 preferentially NGF-induced genes. Binding site matrices that averaged more than 1 predicted binding site/kb of sequence in the background gene set were excluded from subsequent analysis. Permutation p values were FDR-corrected.
AP-1 and CREB Chromatin Immunoprecipitation (ChIP)
ChIP assays were performed as previously described (32) using 5 μg of the following antibodies: Fos (Santa Cruz, sc-7202), FosB (Santa Cruz, sc-48), Fra-1 (Santa Cruz, sc-605), Fra-2 (Santa Cruz, sc-171), Jun (Santa Cruz, sc-1694X and Abcam, ab31419), JunB (Santa Cruz, sc-73X), JunD (Santa Cruz, sc-74), and CREB-1 (Santa Cruz, sc-186). For ChIP assays using antibodies for the AP-1 family members, protein A-agarose beads (Upstate Biotechnology) were washed successively in low salt wash, high salt wash, LiCl wash, and twice in 1× Tris/EDTA buffer. When using the CREB-1 antibody, protein A-agarose beads were washed successively in low salt wash three times, once in LiCl wash, and twice in 1× Tris/EDTA buffer. Cross-links were reversed using high salt and heating to 65 °C overnight. Immunoprecipitated DNA was purified using a gel extraction kit (Qiagen) and quantified with real-time PCR using primers located near the respective predicted transcription factor binding sites (within 300 bp, see supplemental Table 1).
Immunoblots
PC12 cells were lysed in 2× Laemmli buffer. Proteins were electrophoresed on SDS-polyacrylamide gels, transferred to nitrocellulose or polyvinylidene difluoride membranes, and immunoblotted with antibodies to total p44/42 MAPK (ERK1/2) (Cell Signaling #9102), phospho p44/42 MAPK (ERK1/2) (Cell Signaling #9101), neurofilament-L (Cell Signaling #2837), Fos (Santa Cruz, sc-7202), FosB (Santa Cruz, sc-48), Fra-1 (Santa Cruz, sc-605), JunB (Santa Cruz, sc-73X), and β-actin (Sigma) overnight at 4 °C. Membranes were visualized with chemiluminescence or fluorescence after using the appropriate horseradish peroxidase-linked or Cy3-labeled secondary antibody. Phospho-ERK1/2 and ERK1/2 immunoblots were quantified using ImageJ software. Values obtained for both p44 and p42 ERK bands were added together, and phospho p44/42 values were normalized to total p44/42.
RESULTS
Identification of Genes That Are Preferentially Induced by NGF
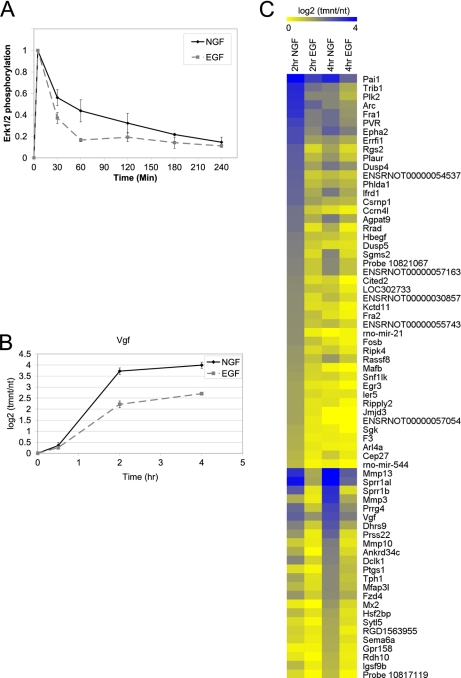
Global expression profiling was used to identify changes in gene expression that occurred preferentially in response to NGF after 2 and 4 h of treatment of PC12 cells with NGF or EGF. These time points coincided with the period of sustained ERK signaling induced by NGF (Fig. 1A) as well as with the preferential induction of Vgf, which has been previously identified as a preferentially NGF-induced gene involved in neuronal differentiation (21) (Fig. 1B).
FIGURE 1.
Identification of genes preferentially induced by NGF. A, PC12 cells were treated with NGF or EGF for 0–4 h. Phosphorylated p44/42 levels were normalized to total p44/42 levels (which remained constant). Levels of phosphorylated p44/42 relative to the maximum phosphorylation observed for each growth factor were quantified from immunoblots. Data are the averages of at least two experiments ± S.D. B, PC12 cells were treated with NGF or EGF for 0.5, 2, and 4 h. Total RNA was extracted, and real-time RT-PCR was used to quantify Vgf expression levels. Data are presented as the log 2 ratio of treatment/no treatment (tmnt/nt; n = 4 ±S.E.). C, PC12 cells were treated with NGF or EGF for 2 or 4 h or left untreated. Total RNA for three independent biological replicates was extracted and subjected to Affymetrix Rat Gene 1.0ST Arrays. Shown in the heatmap are the 69 genes that were preferentially up-regulated by NGF compared with EGF (NGF/no treatment log2 > 1, FDR p value< 0.01 and NGF/EGF log 2 > 0.75, FDR p value< 0.01), with blue being associated with high up-regulation and yellow being associated with expression levels comparable with untreated cells. Genes are sorted by those with highest induction at 2 h NGF in the top half and those with highest induction at 4 h NGF in the bottom half. Within these subsets, genes are sorted from highest to lowest up-regulation in response to NGF.
The results of microarray analyses (supplemental Table 2) are summarized in Table 1. Treatment with NGF for 2 or 4 h resulted in a >2-fold up-regulation of 265 genes and down-regulation of 97 genes (p < 0.01, FDR corrected). Treatment with EGF resulted in the up-regulation of 85 genes and down-regulation of 20 genes. All of the genes affected by EGF were also up- or down-regulated in response to NGF, and there were no genes that were up- or down-regulated to a greater extent by EGF than by NGF.
TABLE 1.
Summary of microarray analysis of NGF- and EGF-treated PC12 cells
PC12 cells were treated with NGF or EGF for 2 or 4 h or left untreated. Total RNA for three independent biological replicates was extracted and subjected to Affymetrix Rat Gene 1.0ST arrays. Shown are the numbers of genes that were up-regulated or down-regulated at 2 or 4 h for each treatment as well as those that were preferentially affected by either growth factor. 12 rapidly induced immediate-early genes were excluded from these counts and subsequent analyses because they reached maximum induction much earlier (30 min).
| Genes affected by NGF NGF/NT > 2-fold (p < 0.01) | Genes affected by EGF EGF/NT > 2-fold (p < 0.01) | Genes preferentially affected by NGF NGF/EGF > 1.7-fold (p < 0.01) | Genes preferentially affected by EGF EGF/NGF > 1.7-fold (p < 0.01) | |
|---|---|---|---|---|
| Up-regulated | 265 | 85 | 69 | 0 |
| Down-regulated | 97 | 20 | 0 | 0 |
Although larger numbers of genes were up-regulated or down-regulated by NGF than by EGF, the differences in expression between NGF and EGF treatments for most of these genes were small. We, therefore, sought to identify a set of genes whose expression was significantly different between NGF and EGF treatments by comparing the extent of expression changes induced by NGF versus EGF. A set of preferentially NGF-regulated genes was, therefore, defined by expression changes that were 1.7-fold greater (p < 0.01) in response to NGF than to EGF (Table 1). None of the genes was down-regulated >1.7-fold more by NGF compared with EGF and thus did not meet these criteria for preferential NGF down-regulation at the 2–4 h time points.
In contrast to the down-regulated genes, 69 genes were up-regulated preferentially by NGF compared with EGF (NGF/EGF >1.7-fold, p < 0.01) (Table 1). The expression levels of these genes after both EGF and NGF treatment are summarized as a heatmap in Fig. 1C. Of the 69 genes that were preferentially induced by NGF, some demonstrated no appreciable levels of induction in response to EGF treatment (i.e. Rgs2, Jmjd3, Kctd11, Rrad), whereas others (i.e. Sprr1al, Mmp13, Mmp3) were induced by EGF but to a lesser extent than induction by NGF. The 69 genes that were preferentially up-regulated by NGF included genes that were previously shown to be more highly up-regulated by NGF than EGF, such as Plaur, Vgf, Pai1, Arc, Mmp3, and Mmp13 (21–24). These genes will be referred to as “preferentially NGF-induced genes,” and subsequent studies focused on this gene set.
Several different patterns of gene expression were observed in the microarray experiments. In Fig. 1C, the 69 preferentially NGF-induced genes were separated into 2 groups; 1) the upper half contains 45 genes that were more highly induced at 2 h of NGF treatment, and 2) the bottom half contains 24 genes that were more highly induced at 4 h of NGF treatment. The kinetics of gene induction also varied, with the expression of some genes (e.g. Jmjd3, Kctd11, and Ccrn4l) being up-regulated at the earlier 2 h time point and subsequently returning to basal levels at 4 h of NGF treatment. Other genes were expressed at higher levels at 4 h (e.g. Mmp3 and Mmp10), and there was a variety of intermediate kinetic profiles where the expression levels at 2 and 4 h were roughly the same (Vgf, Dclk1, Epha2, Agpat9).
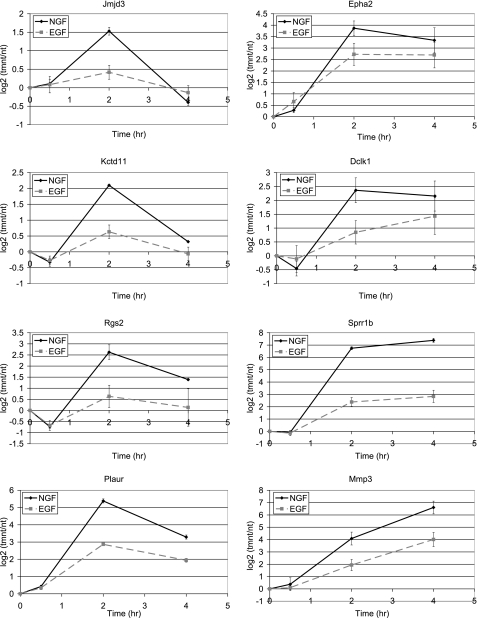
The differential expression of representative genes preferentially induced by NGF was also examined by real time RT-PCR over a period of 0.5–4 h of growth factor treatment (Fig. 2). These experiments confirmed the preferential NGF-mediated induction that was observed in the microarray experiments, with genes such as Jmjd3, Kctd11, and Rgs2 showing no significant up-regulation in response to EGF. Sprr1b, which demonstrated the largest differential expression between NGF and EGF treatment in the microarray experiments, exhibited a similarly large differential expression (∼20-fold) between NGF and EGF treatment via real time RT-PCR analysis (Fig. 2). In addition, the different kinetic patterns of gene expression that were observed in the microarray experiments were confirmed by real time RT-PCR.
FIGURE 2.
Real-time RT-PCR analysis of a panel of genes induced preferentially by NGF compared with EGF. RNA was extracted from PC12 cells treated with NGF (solid line) or EGF (dashed line) for 0, 0.5, 2, and 4 h and subjected to real-time RT-PCR analysis. Data are the average (n = 2–4) log 2 ratio of treatment/no treatment ± S.E.
Genes Preferentially Induced by NGF Play a Role in Neuronal Differentiation/Function
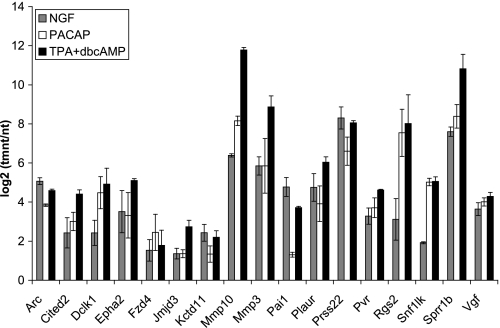
PC12 cells can undergo differentiation in response to treatments other than NGF, so it was of interest to determine if the genes preferentially induced by NGF were also induced by other agents that induce neuronal differentiation. We, therefore, investigated the expression of these genes in response to treatment of PC12 cells with the neuropeptide PACAP, which binds to G protein-coupled receptors and activates phospholipase C, cAMP, and MEK/ERK signaling pathways (33), and to treatment with TPA plus dbcAMP, which induces differentiation via activation of protein kinase C and protein kinase A. These treatments activate some of the same signaling pathways as NGF, but they also activate distinct signaling programs. Fig. 3 shows the differential expression of a panel of preferentially induced genes in response to NGF, PACAP, and TPA plus dbcAMP (all of which resulted in differentiation characterized by extensive neurite extension). All of these genes were induced to similar or higher extents when treated with these other neuritogenic agents as compared with NGF. Thus, this gene set is similarly up-regulated by three different treatments that promote neuronal differentiation in PC12 cells.
FIGURE 3.
Genes preferentially induced by NGF compared with EGF were similarly up-regulated by other agents that promote PC12 differentiation. Real time RT-PCR analysis was conducted on PC12 cells treated with NGF, PACAP, and TPA+dbcAMP over a time course of 1–6 h. Plotted are the maximum observed inductions for each of the treatments over the time course. Data are the averages from 2–3 independent experiments ± S.D.
The functions of the genes preferentially induced by NGF were investigated by GO analysis using the DAVID Bioinformatics Data base (30, 31). Consistent with their induction by multiple factors that induce PC12 differentiation, this gene set was enriched for GO categories related to development and differentiation, such as “developmental process” (39% of gene set), “multicellular organismal development” (32% of gene set), “system development” (29% of gene set), “tissue development” (12% of gene set), “nervous system development” (15% of gene set), and “cell differentiation” (19% of gene set) (Fig. 4A). We next applied the DAVID functional annotation clustering tool to our gene set. This tool finds overrepresented clusters of GO terms that co-associate with one another, thus grouping similar GO annotations together. The top two GO clusters for the preferentially NGF-induced genes were related to development (p < 0.01, enrichment score = 2.22) (Fig. 4B) and peptidase/matrix metalloproteinase activity (p < 0.05, enrichment score = 1.4) (not shown). Modification of the extracellular environment by matrix metalloproteinases is known to be crucial for neurite formation/outgrowth, and many matrix metalloproteinases (Mmp3, Mmp10, Mmp13) were preferentially induced by NGF. Fig. 4B was generated from the functional annotation clustering results for those genes that were associated with GO terms related to developmental functions. Twenty-nine genes were associated with a GO term in this functional cluster, which included GO terms such as “nervous system development,” and “cell differentiation,” suggesting that the preferentially NGF-induced gene set is enriched in genes whose functions may be critical for PC12 differentiation.
The function of preferentially NGF-induced genes in PC12 differentiation was investigated by determining the effect of siRNA knockdown on the expression of neurofilament-L, a well characterized neuronal marker whose expression is up-regulated at later time points upon acquisition of a neuronal phenotype (34, 35). Neurofilament-L was nearly undetectable in untreated, undifferentiated PC12 cells (Fig. 4C, first lane) but was robustly expressed after cells were induced to differentiate for 2 days in the presence of NGF (Fig. 4C, second lane). EGF, as expected based on its inability to promote PC12 differentiation, resulted in much lower neurofilament-L expression (Fig. 4C, third lane). siRNA knockdown of the preferentially NGF-induced genes, Plaur and PVR, significantly inhibited the NGF-mediated induction of neurofilament-L (Fig. 4C, fifth and sixth lanes), demonstrating a critical role for these genes in PC12 differentiation.
These results are consistent with previous studies that demonstrated a role for Plaur and PVR in PC12 differentiation (24, 36). In addition, several other preferentially NGF-induced genes (Mmp3, Mmp10, Plk2, and Rgs2) have previously been shown to be critical for PC12 differentiation through siRNA knockdown or functional inhibition (36–38). Many also have established roles in neuronal or brain differentiation/function (Sgk, Sprr1a, Jmjd3, Kctd11, Ifrd1, Epha2, rno-miR-21, Pai1, Tph1, Sema6a, Hbegf, Egr3, Arc, Vgf, Dclk1) (21, 39–55). In total, at least 21 (30%) of the preferentially NGF-induced genes have previously described roles in neuronal differentiation/function in PC12 cells and other neuronal systems. Combining these 21 genes with the 29 genes associated with a GO term in the development functional cluster (Fig. 4B), roughly 50% (34) of the genes preferentially induced by NGF are implicated in neuronal development.
Sustained MEK/ERK Signaling Contributes to Gene Induction by NGF
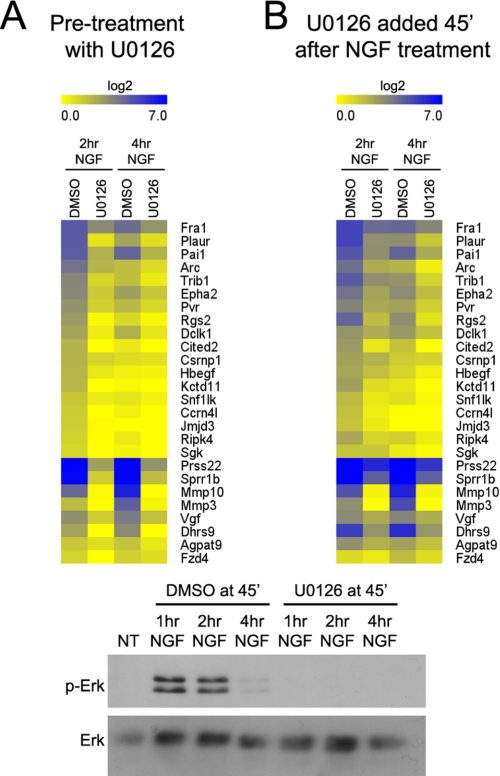
Because sustained ERK activation is the key difference between NGF and EGF signaling that leads to neuronal differentiation, we investigated the role of MEK/ERK signaling in the up-regulation of the preferentially NGF-induced genes. Pretreatment of PC12 cells with the MEK inhibitor U0126 significantly reduced the induction of a representative subset of these genes in response to NGF (Fig. 5A). Thus, all of the preferentially NGF-induced genes tested are downstream of the signaling pathway critical for PC12 differentiation.
FIGURE 5.
Genes up-regulated preferentially by NGF are regulated by sustained ERK signaling. Real time RT-PCR analysis was conducted on total RNA from PC12 cells that were pretreated with DMSO or U0126 1 h before NGF treatment (A) or from PC12 cells that were treated with DMSO or U0126 45 min after NGF (B). Results are presented as the average log2 ratio of treatment/no treatment in the form of a heatmap, n = 2. An immunoblot of phospho and total ERK after 0–3 h of NGF treatment when cells were treated with UO126 or vehicle control (DMSO) 45 min after NGF is shown below.
To determine the importance of a sustained ERK signal for the up-regulation of these genes, U0126 was added 45 min after NGF treatment, resulting in a transient ERK signal similar to that observed in response to EGF treatment. When U0126 was added 45 min after NGF treatment, ERK phosphorylation was not detectable 15 min later (after a total of 1 h NGF treatment) (Fig. 5, lower panel). Such delayed treatment with U0126 generally reduced the up-regulation of the preferentially NGF-induced genes tested at both 2 and 4 h of NGF treatment (Fig. 5B), indicating that sustained ERK signaling contributes to induction of these genes. It is noteworthy that the effect of delayed U0126 addition was less than that observed upon pretreatment with the inhibitor (compare Fig. 5, A and B). This is consistent with the observed differences in gene expression induced by NGF compared with EGF, as EGF also resulted in a significant but reduced up-regulation of many of the preferentially NGF-induced genes (see Fig. 1C).
AP-1 and CREB Bind to Regulatory Regions of Many Genes Preferentially Induced by NGF
Because genes that are activated downstream of common stimuli or signaling pathways may be regulated by a similar set of transcription factors (29, 56, 57), we identified transcription factor binding sites that were overrepresented in the regulatory regions of the genes that were preferentially induced by NGF. In addition, only binding sites that were conserved between the rat and human sequence were considered, as binding sites that are conserved across species are more likely to be biologically relevant (58).
Binding sites were predicted utilizing the TRANSFAC 12.1 data base and the MinSUM threshold in regions spanning 5 kb upstream of the transcription start sites for both the gene set preferentially induced by NGF treatment as well as a background gene set composed of 291 genes whose expression did not change in response to growth factor treatment. For the binding site analysis, 43 of the 69 preferentially NGF-induced genes were used, as an upstream sequence could not be obtained for the other 26 genes.
Binding sites for AP-1 and CREB were found to be overrepresented in the upstream regions of the preferentially NGF-induced gene set (FDR corrected p value< 0.01). Using the V$AP1_Q6_01 matrix, >65% (28/43) of the genes preferentially induced by NGF had at least one predicted AP-1 binding site in their upstream regions, suggesting that AP-1 could regulate a large subset of this gene set. >40% (18/43) of the genes preferentially induced by NGF had a predicted CREB binding site in their upstream regions when using the V$CREB_Q2_01 matrix. CREB and AP-1 were not only predicted to target a large fraction of the preferentially NGF-induced genes, but both of these factors have been previously linked to PC12 neuronal differentiation (59–66), so they were investigated further.
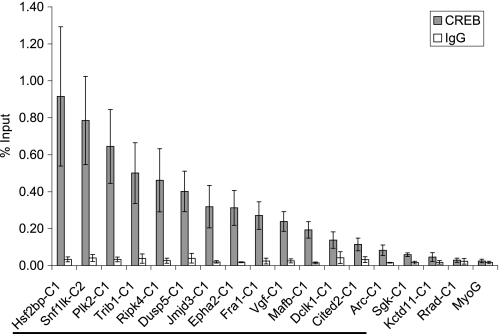
ChIP assays were conducted to identify in vivo binding of CREB to these predicted binding sites (Fig. 6). In untreated PC12 cells, 14 of the predicted CREB target genes tested had CREB bound at the predicted sites compared with an IgG control and compared with the upstream region of the negative control Myog (>3-fold compared with both controls). CREB has previously been shown to bind to its target genes constitutively (67), and CREB binding did not change upon NGF treatment (data not shown). Thus, CREB was bound to the upstream regions of >30% (14/43) of the preferentially NGF-induced genes.
FIGURE 6.
Identification of CREB binding sites in the upstream regions of genes induced preferentially by NGF. ChIP assays were conducted using antibody against CREB1 or an IgG control. Immunoprecipitated DNA was quantified via real time PCR using primers adjacent to/overlapping the predicted CREB binding sites (see supplemental Table 1 for locations). Data are plotted as % input and are the average from three determinations ± S.E. The upstream region of Myog, a muscle-specific gene, served as a negative control. If a gene had several predicted CREB binding sites in its upstream regulatory sequence, only the region with the highest level of binding is presented. Different CREB binding sites located in the upstream regulatory region of the same gene are designated by C1, C2, etc. and can be found in supplemental Table 1. The 14 genes that had CREB bound to their upstream regions (>3-fold compared with Myog and IgG controls) are denoted by the solid line in the figure.
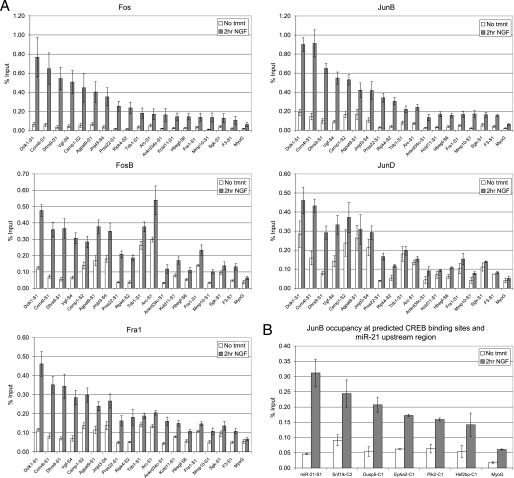
Putative AP-1 binding sites upstream of 65% (28/43) of the preferentially NGF-induced genes were identified. The AP-1 family of transcription factors consists of the Fos family members (Fos, FosB, Fra1, Fra2) and Jun family members (Jun, JunB, JunD). These family members bind as dimers in various combinations, with the Jun family members able to homo- or heterodimerize with themselves or with the Fos family members, whereas the Fos family members must heterodimerize with one of the Jun family members (68). Because AP-1 can bind in so many different combinations, ChIP assays were conducted for all AP-1 family members. Fra2 and Jun could not be detected at the promoter regions of the genes that were preferentially induced by NGF treatment. In contrast, NGF treatment resulted in the recruitment of Fos, FosB, Fra1, JunB, and JunD to predicted sites upstream of 18 of the preferentially NGF-induced genes (Fig. 7A). These factors were bound >2-fold higher at the predicted AP-1 target regions in NGF-treated cells compared with an IgG control and to the upstream region of the negative control Myog. Although there was a high level of recruitment of most AP-1 family members in response to NGF, JunD was bound at a relatively high level in untreated cells and was recruited to a lesser extent than the other AP-1 family members. In some cases, such as for JunD binding upstream of Agpat9, Trib1, and Arc, there was almost no recruitment in response to NGF treatment (Fig. 7A).
FIGURE 7.
Identification of AP-1 binding sites in the upstream regions of genes induced preferentially by NGF. A, ChIP assays were conducted in PC12 cells that were either left untreated or treated with NGF for 2 h using antibodies for Fos, FosB, Fra1, JunB, and JunD. Immunoprecipitated DNA was quantified via real time PCR using primers adjacent to/overlapping predicted AP-1 binding sites (see supplemental Table 1 for locations) and plotted as % input. The upstream region of Myog, a muscle-specific gene, served as the negative control. Data are the averages of 2–6 biological replicates ± S.E. Shown are only those upstream sequences that were significantly immunoprecipitated by AP-1 antibodies (>2-fold compared with Myog and the IgG control for at least 2 AP-1 family members). If a gene had more than 1 predicted AP-1 binding site in its upstream regulatory region, only the region with the highest binding is presented. Different AP-1 binding sites located in the upstream regulatory region of the same gene are designated by S1, S2, etc. and can be found in supplemental Table 1. B, AP-1 binding in regions containing predicted CREB sites and in the upstream region of miR-21 was detected by conducting JunB ChIPs in PC12 cells treated as in A. Immunoprecipitated DNA was quantified via real time PCR using primers adjacent to/overlapping predicted CREB or previously identified AP-1 (for miR-21) (87, 88) binding sites. Data are the average of two determinations ± S.E.
CREB and AP-1 share a very similar consensus binding site and have previously been shown to regulate genes through the same binding site (69–73). To obtain a more comprehensive list of AP-1 and CREB target genes, we conducted ChIP assays to detect binding of CREB in regions that contain a predicted AP-1 site and to detect binding of AP-1 in regions that contain a predicted CREB site. We did not detect binding of CREB to regions containing any of the AP-1 binding sites identified in Fig. 7A. However, we did detect binding (>2-fold compared with Myog and IgG controls) of AP-1 to several regions containing predicted CREB sites as well as to the region upstream of the preferentially NGF-induced microRNA, miR-21 (Fig. 7B). This increased the total number of preferentially NGF-induced genes with upstream AP-1 sites to a total of 24, representing more than 50% (24/44) of the genes analyzed.
AP-1 Recruitment in Response to NGF Is Downstream of MEK/ERK Signaling
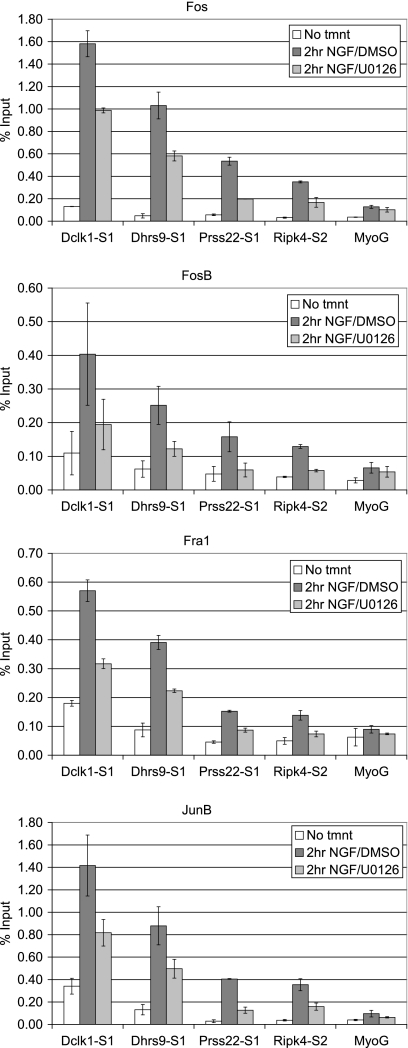
Because up-regulation of the preferentially NGF-induced genes was downstream of MEK/ERK signaling (see Fig. 5), we investigated the effect of MEK/ERK signaling on recruitment of AP-1 transcription factors to the upstream regions of these genes. ChIP assays were conducted on PC12 cells treated with U0126 before NGF treatment, and the levels of Fos, FosB, Fra1, and JunB at the upstream regions of representative AP-1 target genes were determined (Fig. 8), with similar results observed for the other AP-1 target genes. The recruitment of all of these AP-1 family members in response to NGF was reduced by inhibition of MEK with U0126, indicating that the MEK/ERK pathway contributes to AP-1 activation in the NGF-mediated transcriptional program of PC12 cells.
FIGURE 8.
AP-1 recruitment to NGF-induced genes is reduced upon MEK inhibition. ChIP assays were conducted on PC12 cells pre-treated with DMSO or U0126 1 h before NGF treatment. Chromatin was immunoprecipitated using antibody to Fos, FosB, Fra1, and JunB and quantified via real time PCR as in Fig. 7. Data are plotted as the average % input (n = 2) ± S.E.
Expression and Recruitment of AP-1 Family Members Are Increased Preferentially by NGF Compared with EGF
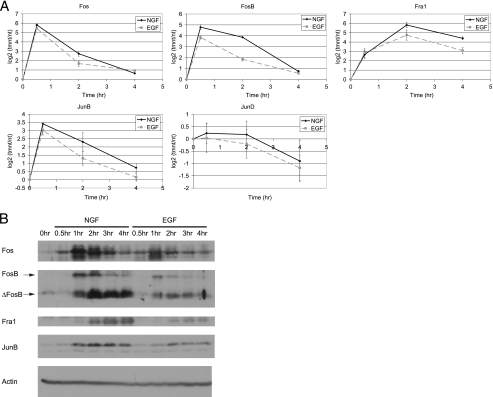
We further investigated the effects of NGF compared with EGF signaling on both the expression of AP-1 family members and on their recruitment to upstream regions of NGF target genes. Using real time RT-PCR, the mRNA levels for Fos, Fra1, FosB, JunB, and JunD were examined in response to NGF and EGF treatment over a time course of 0.5–4 h (Fig. 9A). These AP-1 family members were highly up-regulated in response to growth factor treatment, with the exception of JunD, whose expression did not significantly change. These results for JunD are consistent with previous studies (20, 74, 75) as well as with our microarray and ChIP data, which indicated minimal changes in JunD expression or recruitment in response to NGF treatment. The up-regulation of Fos, Fra1, FosB, and JunB at early time points (0.5 h) was similar in response to NGF and EGF. However, their expression levels at later time points were higher in response to NGF. These results are consistent with the phospho-ERK levels observed in Fig. 1A, where higher sustained phosphorylation was observed at later time points (0.5–2 h of NGF treatment). In fact, FosB and Fra1 are two of the genes that were up-regulated preferentially by NGF compared with EGF (see Fig. 1C).
FIGURE 9.
AP-1 mRNA and protein expression. A, real time RT-PCR analysis was used to quantify mRNA expression of Fos, FosB, Fra1, JunB, and JunD over a time course (0–4 h) of NGF or EGF treatment. Data are average log 2 ratios of treatment/no treatment for 3–4 replicate experiments ± S.E. B, Western blot analysis was used to determine protein levels of Fos, FosB, Fra1, and JunB in response to NGF or EGF treatment over a time course of 0.5–4 h. ΔFosB is a truncated alternatively spliced form of FosB that is recognized by the FosB antibody. Immunoblot shown is representative of at least two experiments. β-Actin was used as a loading control.
These studies also illustrate differences in the kinetics of induction of the AP-1 family members. Fos and FosB were more highly up-regulated at 0.5 h, and subsequently their expression levels decreased at 2 and 4 h, although the decrease in FosB expression was somewhat slower. Fra1 was more highly up-regulated at 2 h of NGF treatment, and this high level of expression was maintained at 4 h, consistent with previous studies (76) that demonstrated more delayed induction kinetics of this AP-1 family member. JunB displayed rapid induction (similar to Fos) at 0.5 h and subsequently decreased at 2 and 4 h of NGF treatment.
The protein levels of these AP-1 family members were also investigated because their expression is not only regulated at the mRNA level but also at the protein level via post-translational modifications and stability (68). The levels of Fos, FosB, Fra1, and JunB proteins were increased to a much greater extent in response to NGF as compared with EGF (Fig. 9B). In addition, the varying kinetic patterns observed at the mRNA level were mirrored at the protein level, with Fos, FosB, and JunB proteins reaching high levels very rapidly (1 h NGF), whereas Fra1 reached high levels at later time points (4 h NGF). These kinetic patterns at both the mRNA and protein levels are consistent with previous studies (20, 76, 77).
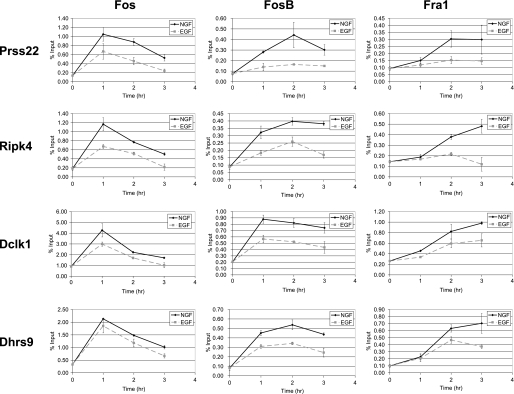
ChIP assays were conducted to determine binding of Fos, Fra1, and FosB over a time course (1–3 h) of NGF or EGF treatment for a panel of genes that was induced preferentially by NGF (Fig. 10). NGF treatment resulted in a higher level of recruitment for Fos, Fra1, and FosB throughout the duration of the experiment compared with EGF treatment. In addition, the same kinetic patterns observed at the mRNA and protein levels were observed for the recruitment of each of these AP-1 family members. Fos binding levels were highest at earlier time points (1 h), whereas Fra1 was recruited at later time points (3 h). FosB exhibited similar levels of binding at 1 and 2 h of treatment, thus illustrating a more intermediate binding pattern, as was mirrored by its mRNA and protein expression kinetics. Overall, the preferential recruitment of AP-1 family members in response to NGF, as compared with EGF, paralleled the increases in their expression, suggesting that their sustained expression drives the transcriptional response to NGF.
FIGURE 10.
Kinetics of AP-1 recruitment to preferentially NGF-induced genes in response to NGF and EGF. ChIP assays were conducted on PC12 cells treated with NGF or EGF for 0–3 h using antibodies for Fos, FosB, or Fra1. Binding of the AP-1 family members at the regions upstream of the genes Prss22, Ripk4, Dclk1, and Dhrs9 was quantified via real time PCR as in Fig. 7. Plotted is the average % input for two independent time course experiments ± S.E.
DISCUSSION
The distinct biological responses elicited by NGF and EGF (differentiation or proliferation) in PC12 cells are primarily determined by differences in signal duration. Differentiation is driven by the sustained ERK activity induced by NGF, as compared with the transient activation of ERK induced by EGF. In the present study, we sought to characterize the transcriptional program that is activated specifically downstream of sustained ERK signaling and would, therefore, be expected to contribute directly to the differentiation process.
We used microarray analysis to identify the global gene expression changes that occurred preferentially in response to NGF compared with EGF at 2–4 h after growth factor stimulation, when the sustained ERK activity induced by NGF was most distinct from the transient activity induced by EGF. The set of 69 genes that we identified as preferentially NGF-induced by this global analysis included several genes (Vgf, Mmp3, Arc, Mmp13, Pai1, and Plaur) that had previously been identified as being preferentially up-regulated by NGF at similar time points in non-global studies (21–24). Many of the genes we identified as being preferentially induced by NGF had also been shown to be preferentially induced by treatments that induce differentiation (NGF and PACAP) compared with a treatment that does not induce PC12 differentiation (insulin) (78). We similarly found that the preferentially NGF-induced genes were induced by treatment of PC12 cells with PACAP or with TPA plus dbcAMP, which also induce neuronal differentiation.
Inhibition of MEK with a small molecule inhibitor blocked induction of the preferentially NGF-induced genes, consistent with the central role of the MEK/ERK pathway downstream of NGF. In addition, we found that the induction of these genes was significantly reduced by inhibition of MEK 45 min after NGF treatment, resulting in a transient ERK signal, mimicking that induced by EGF. Thus, sustained ERK signaling induced by NGF contributed to up-regulation of the preferentially induced genes.
Approximately 50% of the genes preferentially induced by NGF were implicated in neuronal development as determined by GO functional cluster analysis and previous studies that characterized their roles in neuronal differentiation/function in PC12 cells and other neuronal systems. We further confirmed that the preferentially NGF-induced genes Plaur and PVR were required for PC12 differentiation by siRNA knockdown in the present study. A number of these genes (e.g. Arc, Vgf, Mmp3) have been extensively studied with regard to their roles in neuronal systems. Others have been implicated in neuronal function, but their roles are less characterized. For example, Sgk1 has been shown to play a role in spatial learning in rats and has been shown to promote neuronal dendrite growth (39). Sprr1a, which has the highest level of differential expression between NGF and EGF in our study, has previously been shown to be induced after peripheral axon damage and to localize with F-actin and play a role in axonal outgrowth (40). The expression of Jmjd3, a histone H3K27 demethylase, was shown to be regulated in neural stem cell differentiation in response to retinoic acid. In addition, Jmjd3 regulated a number of neuronal genes when overexpressed in neural stem cells (41) and thus could regulate PC12 differentiation through subsequent gene expression changes. Epha2 receptor activation was shown to be involved in the differentiation of neural precursor cells via activation of the MEK/ERK pathway and has been implicated in axon guidance and neural crest cell migration (44, 45). We also identified two microRNAs as being preferentially up-regulated by NGF (miR-21 and miR-544), suggesting that they may selectively down-regulate a number of targets at later time points in response to NGF. MiR-21, a well studied oncomir, has been shown to be up-regulated in the hippocampus after traumatic brain injury (46). In addition, upon MYCN knockdown in SK-N-BE cells, which promotes neuronal differentiation, miR-21 was strongly up-regulated (48). These studies suggest that in addition to its role in cell proliferation and apoptosis, miR-21 could be important for neuronal differentiation.
Computational analysis identified conserved binding sites for CREB and AP-1 as being overrepresented in the upstream regulatory regions of the preferentially NGF-induced genes. ChIP assays subsequently verified binding of AP-1 to predicted sites upstream of more than 50% of the preferentially NGF-induced genes and binding of CREB to more than 30%. Thus, a substantial fraction of the genes that were preferentially induced by NGF were targeted by these two transcription factors. Because the computational prediction of binding sites was limited to sequences within 5 kb upstream of the transcription start site, it is likely that additional genes in the preferentially NGF-induced gene set are also targeted by CREB and AP-1, at sites located further upstream or downstream of their transcription start sites.
Both CREB and AP-1 have previously been found to play a role in PC12 differentiation (59–66). Overexpression of a dominant negative CREB mutant inhibited neuritogenesis in response to NGF in PC12 cells, indicating that CREB is necessary for NGF-mediated differentiation (61). Moreover, an activating phosphorylation of CREB by Rsk at serine 133 has been shown to be sustained in response to NGF compared with EGF (79, 80), suggesting that CREB could play a role in preferential gene induction by NGF.
AP-1 has been shown to be necessary and sufficient for PC12 differentiation through functional inhibition and overexpression studies (59, 60, 62–66). Overexpression of Jun family members induced PC12 differentiation in the absence of NGF (59, 60, 63, 64, 66), and this was further accentuated by overexpression of Fos (60). Knockdown, functional inhibition, or overexpression of dominant negative constructs demonstrated that Fos (60, 62), Jun (60, 62), and JunB (65) are necessary for NGF-induced differentiation.
In addition to being critical for NGF-induced differentiation, a number of studies have demonstrated that AP-1 is regulated preferentially by NGF compared with EGF as a result of sustained ERK activation. AP-1 expression, phosphorylation, and in vitro DNA binding activity were sustained in PC12 cells treated with NGF compared with EGF (60, 81–84). Our results further indicate that the sustained expression and/or activation of Fos, FosB, Fra1, and JunB contribute to the preferential induction of a number of genes in response to NGF. The binding of these AP-1 family members to their target genes in vivo was sustained after stimulation with NGF as compared with EGF and was reduced upon inhibition of MEK, indicating that AP-1 is activated downstream of MEK/ERK signaling. These findings suggest that the sustained expression and/or activation of these AP-1 family members allows them to mediate programs of gene expression that translate differences in ERK signal duration into distinct biological outcomes (differentiation versus proliferation), analogous to what was originally characterized in fibroblasts in response to varying ERK signal duration (77, 85). It is noteworthy that distinct kinetics of both expression and DNA binding were observed for different Fos family members, with Fos and FosB showing highest expression and DNA binding at early times after NGF stimulation, whereas Fra1 expression and DNA binding were maximal after 2–4 h. These differences in induction kinetics for the Fos family are consistent with previous studies in other cell types (20, 76) and indicate that the composition of AP-1 dimers changes over time. Interestingly, Fra1, which is induced preferentially by NGF, contains an AP-1 binding site in its upstream regulatory region (see Fig. 7). This suggests that preferential regulation of the early AP-1 family members Fos and FosB affects the later expression of Fra1, consistent with a previous report that demonstrated Fra1 regulation by AP-1 in several cell types (86).
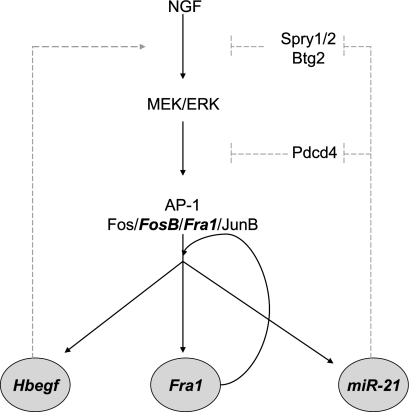
It is noteworthy that Fra1 binds to its own upstream region, thereby activating its own expression in a positive feedback loop. This positive feed-forward and autoregulatory loop could be one mechanism by which sustained AP-1 activity is maintained after NGF stimulation (Fig. 11). In addition to this autoregulatory loop, our results lead us to propose a model in which AP-1 participates in at least two additional positive regulatory loops in the NGF-mediated transcriptional program (Fig. 11). One of the preferentially NGF-induced AP-1-target genes, Hbegf, encodes a member of the EGF family that could maintain sustained activation of ERK in a feed-forward loop. In support of this model, HB-EGF has been shown to promote PC12 neurite outgrowth, inducing sustained ERK signaling similar to that induced by NGF (52). Additional positive feedback loops affecting several steps in the Ras/Raf/MEK/ERK/AP-1 pathway are proposed based on our identification of miR-21 as a preferentially NGF-induced microRNA. Several studies have demonstrated miR-21 induction by AP-1, downstream of Ras signaling (87, 88), and our results demonstrated robust recruitment of AP-1 to the upstream region of miR-21 in response to NGF treatment. In vivo targets of miR-21 include Spry1, Spry2, and Btg2, all inhibitors of ERK activation, and Pdcd4, an inhibitor of AP-1 activation (87–95). Thus, miR-21 up-regulation results in elevated MEK/ERK and AP-1 activity by removing the inhibitory action of these factors. Consistent with these studies, miR-21 knockdown or overexpression affected the level and duration of ERK phosphorylation in response to hyaluronan treatment of a glioma cell line (89). Thus, we propose that the preferential up-regulation of miR-21 in response to NGF in PC12 cells is also part of an integral positive feedback loop by which NGF maintains sustained ERK and AP-1 activity.
FIGURE 11.
Model for MEK/ERK/AP-1 positive feedback loops driven by preferentially NGF-induced genes. FosB, Fra1, Hbegf, and miR-21 were identified as preferentially NGF-induced genes (see Fig. 1C). Shown is a model of positive feedback loops involving these genes that would maintain activation of MEK/ERK/AP-1 signaling. Solid black lines indicate the transcriptional interactions demonstrated in the present paper. Dashed gray lines indicate the previously established activities of HB-EGF and miR-21 (52, 87–95).
Overall, our study has identified on a global scale an NGF-mediated transcriptional program that is activated downstream of sustained ERK signaling during the initial stages of PC12 differentiation. Extending previous studies showing sustained activation of AP-1 in response to NGF in PC12 cells, we have linked the sustained expression/activity of AP-1 transcription factors to the preferential NGF-induction of >50% of the genes in this transcriptional program. Many of these genes have established roles in neuronal differentiation, and several may participate in autoregulatory loops that maintain this sustained AP-1 activity.
Supplementary Material
Acknowledgment
We are grateful to Ulla Hansen for helpful comments and discussion of the manuscript.
This work was supported, in whole or in part, by National Institutes of Health Grant RO1 CA18689 (to G. M. C.).

The on-line version of this article (available at http://www.jbc.org) contains supplemental Tables 1 and 2.
- AP-1
- activator protein-1
- PACAP
- pituitary adenylate cyclase-activating polypeptide
- TPA
- 12-O-tetradecanoylphorbol-13-acetate
- dbcAMP
- dibutyryl-cyclic AMP
- FDR
- false discovery rate
- GO
- gene ontology
- CREB
- cyclic AMP response element-binding protein.
REFERENCES
- 1. Segal R. A., Greenberg M. E. (1996) Annu. Rev. Neurosci. 19, 463–489 [DOI] [PubMed] [Google Scholar]
- 2. Huff K., End D., Guroff G. (1981) J. Cell Biol. 88, 189–198 [DOI] [PMC free article] [PubMed] [Google Scholar]
- 3. Chao M. V. (1992) Cell 68, 995–997 [DOI] [PubMed] [Google Scholar]
- 4. Bar-Sagi D., Feramisco J. R. (1985) Cell 42, 841–848 [DOI] [PubMed] [Google Scholar]
- 5. Noda M., Ko M., Ogura A., Liu D. G., Amano T., Takano T., Ikawa Y. (1985) Nature 318, 73–75 [DOI] [PubMed] [Google Scholar]
- 6. Troppmair J., Bruder J. T., App H., Cai H., Liptak L., Szeberényi J., Cooper G. M., Rapp U. R. (1992) Oncogene 7, 1867–1873 [PubMed] [Google Scholar]
- 7. Wood K. W., Qi H., D'Arcangelo G., Armstrong R. C., Roberts T. M., Halegoua S. (1993) Proc. Natl. Acad. Sci. U.S.A. 90, 5016–5020 [DOI] [PMC free article] [PubMed] [Google Scholar]
- 8. Cowley S., Paterson H., Kemp P., Marshall C. J. (1994) Cell 77, 841–852 [DOI] [PubMed] [Google Scholar]
- 9. Robinson M. J., Stippec S. A., Goldsmith E., White M. A., Cobb M. H. (1998) Curr. Biol. 8, 1141–1150 [DOI] [PubMed] [Google Scholar]
- 10. Wood K. W., Sarnecki C., Roberts T. M., Blenis J. (1992) Cell 68, 1041–1050 [DOI] [PubMed] [Google Scholar]
- 11. Hagag N., Halegoua S., Viola M. (1986) Nature 319, 680–682 [DOI] [PubMed] [Google Scholar]
- 12. Szeberényi J., Cai H., Cooper G. M. (1990) Mol. Cell. Biol. 10, 5324–5332 [DOI] [PMC free article] [PubMed] [Google Scholar]
- 13. Pang L., Sawada T., Decker S. J., Saltiel A. R. (1995) J. Biol. Chem. 270, 13585–13588 [DOI] [PubMed] [Google Scholar]
- 14. Vaudry D., Stork P. J., Lazarovici P., Eiden L. E. (2002) Science 296, 1648–1649 [DOI] [PubMed] [Google Scholar]
- 15. Marshall C. J. (1995) Cell 80, 179–185 [DOI] [PubMed] [Google Scholar]
- 16. Nguyen T. T., Scimeca J. C., Filloux C., Peraldi P., Carpentier J. L., Van Obberghen E. (1993) J. Biol. Chem. 268, 9803–9810 [PubMed] [Google Scholar]
- 17. Gotoh Y., Nishida E., Yamashita T., Hoshi M., Kawakami M., Sakai H. (1990) Eur. J. Biochem. 193, 661–669 [DOI] [PubMed] [Google Scholar]
- 18. Traverse S., Gomez N., Paterson H., Marshall C., Cohen P. (1992) Biochem. J. 288, 351–355 [DOI] [PMC free article] [PubMed] [Google Scholar]
- 19. Qui M. S., Green S. H. (1992) Neuron 9, 705–717 [DOI] [PubMed] [Google Scholar]
- 20. Herschman H. R. (1991) Annu. Rev. Biochem. 60, 281–319 [DOI] [PubMed] [Google Scholar]
- 21. Salton S. R., Fischberg D. J., Dong K. W. (1991) Mol. Cell. Biol. 11, 2335–2349 [DOI] [PMC free article] [PubMed] [Google Scholar]
- 22. Machida C. M., Rodland K. D., Matrisian L., Magun B. E., Ciment G. (1989) Neuron 2, 1587–1596 [DOI] [PubMed] [Google Scholar]
- 23. Vician L., Basconcillo R., Herschman H. R. (1997) J. Neurosci. Res. 50, 32–43 [DOI] [PubMed] [Google Scholar]
- 24. Farias-Eisner R., Vician L., Silver A., Reddy S., Rabbani S. A., Herschman H. R. (2000) J. Neurosci. 20, 230–239 [DOI] [PMC free article] [PubMed] [Google Scholar]
- 25. Vician L., Silver A. L., Farias-Eisner R., Herschman H. R. (2001) J. Neurosci. Res. 64, 108–120 [DOI] [PubMed] [Google Scholar]
- 26. Töröcsik B., Angelastro J. M., Greene L. A. (2002) J. Neurosci. 22, 8971–8980 [DOI] [PMC free article] [PubMed] [Google Scholar]
- 27. Harada T., Morooka T., Ogawa S., Nishida E. (2001) Nat. Cell Biol. 3, 453–459 [DOI] [PubMed] [Google Scholar]
- 28. Saeed A. I., Bhagabati N. K., Braisted J. C., Liang W., Sharov V., Howe E. A., Li J., Thiagarajan M., White J. A., Quackenbush J. (2006) Methods Enzymol. 411, 134–193 [DOI] [PubMed] [Google Scholar]
- 29. Tullai J. W., Schaffer M. E., Mullenbrock S., Kasif S., Cooper G. M. (2004) J. Biol. Chem. 279, 20167–20177 [DOI] [PubMed] [Google Scholar]
- 30. Dennis G., Jr., Sherman B. T., Hosack D. A., Yang J., Gao W., Lane H. C., Lempicki R. A. (2003) Genome Biol. 4, P3. [PubMed] [Google Scholar]
- 31. Huang da W., Sherman B. T., Lempicki R. A. (2009) Nat. Protoc. 4, 44–57 [DOI] [PubMed] [Google Scholar]
- 32. Tullai J. W., Chen J., Schaffer M. E., Kamenetsky E., Kasif S., Cooper G. M. (2007) J. Biol. Chem. 282, 9482–9491 [DOI] [PMC free article] [PubMed] [Google Scholar]
- 33. Ravni A., Bourgault S., Lebon A., Chan P., Galas L., Fournier A., Vaudry H., Gonzalez B., Eiden L. E., Vaudry D. (2006) J. Neurochem. 98, 321–329 [DOI] [PubMed] [Google Scholar]
- 34. Virtanen I., Lehto V. P., Lehtonen E., Vartio T., Stenman S., Kurki P., Wager O., Small J. V., Dahl D., Badley R. A. (1981) J. Cell Sci. 50, 45–63 [DOI] [PubMed] [Google Scholar]
- 35. Lee V., Trojanowski J. Q., Schlaepfer W. W. (1982) Brain Res. 238, 169–180 [DOI] [PubMed] [Google Scholar]
- 36. Draghetti C., Salvat C., Zanoguera F., Curchod M. L., Vignaud C., Peixoto H., Di Cara A., Fischer D., Dhanabal M., Andreas G., Abderrahim H., Rommel C., Camps M. (2009) J. Biol. Chem. 284, 32053–32065 [DOI] [PMC free article] [PubMed] [Google Scholar]
- 37. Nordstrom L. A., Lochner J., Yeung W., Ciment G. (1995) Mol. Cell. Neurosci. 6, 56–68 [DOI] [PubMed] [Google Scholar]
- 38. Heo K., Ha S. H., Chae Y. C., Lee S., Oh Y. S., Kim Y. H., Kim S. H., Kim J. H., Mizoguchi A., Itoh T. J., Kwon H. M., Ryu S. H., Suh P. G. (2006) Cell. Signal. 18, 2182–2192 [DOI] [PubMed] [Google Scholar]
- 39. Lang F., Böhmer C., Palmada M., Seebohm G., Strutz-Seebohm N., Vallon V. (2006) Physiol. Rev. 86, 1151–1178 [DOI] [PubMed] [Google Scholar]
- 40. Bonilla I. E., Tanabe K., Strittmatter S. M. (2002) J. Neurosci. 22, 1303–1315 [DOI] [PMC free article] [PubMed] [Google Scholar]
- 41. Jepsen K., Solum D., Zhou T., McEvilly R. J., Kim H. J., Glass C. K., Hermanson O., Rosenfeld M. G. (2007) Nature 450, 415–419 [DOI] [PubMed] [Google Scholar]
- 42. Gallo R., Zazzeroni F., Alesse E., Mincione C., Borello U., Buanne P., D'Eugenio R., Mackay A. R., Argenti B., Gradini R., Russo M. A., Maroder M., Cossu G., Frati L., Screpanti I., Gulino A. (2002) J. Cell Biol. 158, 731–740 [DOI] [PMC free article] [PubMed] [Google Scholar]
- 43. Roth A., Gill R., Certa U. (2003) Mol. Cell. Neurosci. 22, 353–364 [DOI] [PubMed] [Google Scholar]
- 44. Aoki M., Yamashita T., Tohyama M. (2004) J. Biol. Chem. 279, 32643–32650 [DOI] [PubMed] [Google Scholar]
- 45. Klein R. (2001) Curr. Opin. Cell Biol. 13, 196–203 [DOI] [PubMed] [Google Scholar]
- 46. Redell J. B., Zhao J., Dash P. K. (2011) J. Neurosci. Res. 89, 212–221 [DOI] [PMC free article] [PubMed] [Google Scholar]
- 47. Soeda S., Koyanagi S., Kuramoto Y., Kimura M., Oda M., Kozako T., Hayashida S., Shimeno H. (2008) Thromb Haemost 100, 1014–1020 [DOI] [PubMed] [Google Scholar]
- 48. Buechner J., Henriksen J. R., Haug B. H., Tømte E., Flaegstad T., Einvik C. (2011) Differentiation 81, 25–34 [DOI] [PubMed] [Google Scholar]
- 49. Nakamura K., Hasegawa H. (2007) Mol. Neurobiol. 35, 45–54 [DOI] [PubMed] [Google Scholar]
- 50. Kerjan G., Dolan J., Haumaitre C., Schneider-Maunoury S., Fujisawa H., Mitchell K. J., Chédotal A. (2005) Nat. Neurosci. 8, 1516–1524 [DOI] [PubMed] [Google Scholar]
- 51. Xu X. M., Fisher D. A., Zhou L., White F. A., Ng S., Snider W. D., Luo Y. (2000) J. Neurosci. 20, 2638–2648 [DOI] [PMC free article] [PubMed] [Google Scholar]
- 52. Zhou Y., Besner G. E. (2010) Neurosignals 18, 141–151 [DOI] [PMC free article] [PubMed] [Google Scholar]
- 53. Li L., Yun S. H., Keblesh J., Trommer B. L., Xiong H., Radulovic J., Tourtellotte W. G. (2007) Mol. Cell. Neurosci. 35, 76–88 [DOI] [PMC free article] [PubMed] [Google Scholar]
- 54. Lyford G. L., Yamagata K., Kaufmann W. E., Barnes C. A., Sanders L. K., Copeland N. G., Gilbert D. J., Jenkins N. A., Lanahan A. A., Worley P. F. (1995) Neuron 14, 433–445 [DOI] [PubMed] [Google Scholar]
- 55. Weimer J. M., Anton E. S. (2006) Neuron 49, 3–4 [DOI] [PubMed] [Google Scholar]
- 56. Jürchott K., Kuban R. J., Krech T., Blüthgen N., Stein U., Walther W., Friese C., Kiełbasa S. M., Ungethüm U., Lund P., Knösel T., Kemmner W., Morkel M., Fritzmann J., Schlag P. M., Birchmeier W., Krueger T., Sperling S., Sers C., Royer H. D., Herzel H., Schäfer R. (2010) PLoS Genet 6, e1001231. [DOI] [PMC free article] [PubMed] [Google Scholar]
- 57. Hughes J. D., Estep P. W., Tavazoie S., Church G. M. (2000) J. Mol. Biol. 296, 1205–1214 [DOI] [PubMed] [Google Scholar]
- 58. Wasserman W. W., Sandelin A. (2004) Nat. Rev. Genet. 5, 276–287 [DOI] [PubMed] [Google Scholar]
- 59. Leppä S., Eriksson M., Saffrich R., Ansorge W., Bohmann D. (2001) Mol. Cell. Biol. 21, 4369–4378 [DOI] [PMC free article] [PubMed] [Google Scholar]
- 60. Eriksson M., Taskinen M., Leppä S. (2007) J. Cell. Physiol. 210, 538–548 [DOI] [PubMed] [Google Scholar]
- 61. Sun P., Watanabe H., Takano K., Yokoyama T., Fujisawa J., Endo T. (2006) Genes Cells 11, 1097–1113 [DOI] [PubMed] [Google Scholar]
- 62. Gil G. A., Bussolino D. F., Portal M. M., Alfonso Pecchio A., Renner M. L., Borioli G. A., Guido M. E., Caputto B. L. (2004) Mol. Biol. Cell 15, 1881–1894 [DOI] [PMC free article] [PubMed] [Google Scholar]
- 63. Leppä S., Saffrich R., Ansorge W., Bohmann D. (1998) EMBO J. 17, 4404–4413 [DOI] [PMC free article] [PubMed] [Google Scholar]
- 64. Heasley L. E., Storey B., Fanger G. R., Butterfield L., Zamarripa J., Blumberg D., Maue R. A. (1996) Mol. Cell. Biol. 16, 648–656 [DOI] [PMC free article] [PubMed] [Google Scholar]
- 65. Lönn P., Zaia K., Israelsson C., Althini S., Usoskin D., Kylberg A., Ebendal T. (2005) Neurochem. Res. 30, 753–765 [DOI] [PubMed] [Google Scholar]
- 66. Dragunow M., Xu R., Walton M., Woodgate A., Lawlor P., MacGibbon G. A., Young D., Gibbons H., Lipski J., Muravlev A., Pearson A., During M. (2000) Brain Res. Mol. Brain Res. 83, 20–33 [DOI] [PubMed] [Google Scholar]
- 67. Conkright M. D., Guzmán E., Flechner L., Su A. I., Hogenesch J. B., Montminy M. (2003) Mol. Cell 11, 1101–1108 [DOI] [PubMed] [Google Scholar]
- 68. Hess J., Angel P., Schorpp-Kistner M. (2004) J. Cell Sci. 117, 5965–5973 [DOI] [PubMed] [Google Scholar]
- 69. Masquilier D., Sassone-Corsi P. (1992) J. Biol. Chem. 267, 22460–22466 [PubMed] [Google Scholar]
- 70. van Dam H., Castellazzi M. (2001) Oncogene 20, 2453–2464 [DOI] [PubMed] [Google Scholar]
- 71. Sassone-Corsi P., Ransone L. J., Verma I. M. (1990) Oncogene 5, 427–431 [PubMed] [Google Scholar]
- 72. Hoeffler J. P., Deutsch P. J., Lin J., Habener J. F. (1989) Mol. Endocrinol. 3, 868–880 [DOI] [PubMed] [Google Scholar]
- 73. Manna P. R., Stocco D. M. (2007) J. Mol. Endocrinol. 39, 261–277 [DOI] [PubMed] [Google Scholar]
- 74. Hirai S. I., Ryseck R. P., Mechta F., Bravo R., Yaniv M. (1989) EMBO J. 8, 1433–1439 [DOI] [PMC free article] [PubMed] [Google Scholar]
- 75. Ryder K., Lanahan A., Perez-Albuerne E., Nathans D. (1989) Proc. Natl. Acad. Sci. U.S.A. 86, 1500–1503 [DOI] [PMC free article] [PubMed] [Google Scholar]
- 76. Cohen D. R., Curran T. (1988) Mol. Cell. Biol. 8, 2063–2069 [DOI] [PMC free article] [PubMed] [Google Scholar]
- 77. Murphy L. O., MacKeigan J. P., Blenis J. (2004) Mol. Cell. Biol. 24, 144–153 [DOI] [PMC free article] [PubMed] [Google Scholar]
- 78. Chung J., Kubota H., Ozaki Y., Uda S., Kuroda S. (2010) PLoS One 5, e9011. [DOI] [PMC free article] [PubMed] [Google Scholar]
- 79. Bonni A., Ginty D. D., Dudek H., Greenberg M. E. (1995) Mol. Cell. Neurosci. 6, 168–183 [DOI] [PubMed] [Google Scholar]
- 80. Xing J., Kornhauser J. M., Xia Z., Thiele E. A., Greenberg M. E. (1998) Mol. Cell. Biol. 18, 1946–1955 [DOI] [PMC free article] [PubMed] [Google Scholar]
- 81. Boss V., Roback J. D., Young A. N., Roback L. J., Weisenhorn D. M., Medina-Flores R., Wainer B. H. (2001) J. Neurosci. 21, 18–26 [DOI] [PMC free article] [PubMed] [Google Scholar]
- 82. Pellegrino M. J., Stork P. J. (2006) J. Neurochem. 99, 1480–1493 [DOI] [PubMed] [Google Scholar]
- 83. Schlingensiepen K. H., Wollnik F., Kunst M., Schlingensiepen R., Herdegen T., Brysch W. (1994) Cell. Mol. Neurobiol. 14, 487–505 [DOI] [PubMed] [Google Scholar]
- 84. Su F., Kozak K. R., Herschman H., Reddy S. T., Farias-Eisner R. (2007) J. Neurosci. Res. 85, 1952–1958 [DOI] [PubMed] [Google Scholar]
- 85. Murphy L. O., Smith S., Chen R. H., Fingar D. C., Blenis J. (2002) Nat. Cell Biol. 4, 556–564 [DOI] [PubMed] [Google Scholar]
- 86. Bergers G., Graninger P., Braselmann S., Wrighton C., Busslinger M. (1995) Mol. Cell. Biol. 15, 3748–3758 [DOI] [PMC free article] [PubMed] [Google Scholar]
- 87. Talotta F., Cimmino A., Matarazzo M. R., Casalino L., De Vita G., D'Esposito M., Di Lauro R., Verde P. (2009) Oncogene 28, 73–84 [DOI] [PubMed] [Google Scholar]
- 88. Fujita S., Ito T., Mizutani T., Minoguchi S., Yamamichi N., Sakurai K., Iba H. (2008) J. Mol. Biol. 378, 492–504 [DOI] [PubMed] [Google Scholar]
- 89. Kwak H. J., Kim Y. J., Chun K. R., Woo Y. M., Park S. J., Jeong J. A., Jo S. H., Kim T. H., Min H. S., Chae J. S., Choi E. J., Kim G., Shin S. H., Gwak H. S., Kim S. K., Hong E. K., Lee G. K., Choi K. H., Kim J. H., Yoo H., Park J. B., Lee S. H. (2011) Oncogene 30, 2433–2442 [DOI] [PubMed] [Google Scholar]
- 90. Hatley M. E., Patrick D. M., Garcia M. R., Richardson J. A., Bassel-Duby R., van Rooij E., Olson E. N. (2010) Cancer Cell 18, 282–293 [DOI] [PMC free article] [PubMed] [Google Scholar]
- 91. Frankel L. B., Christoffersen N. R., Jacobsen A., Lindow M., Krogh A., Lund A. H. (2008) J. Biol. Chem. 283, 1026–1033 [DOI] [PubMed] [Google Scholar]
- 92. Asangani I. A., Rasheed S. A., Nikolova D. A., Leupold J. H., Colburn N. H., Post S., Allgayer H. (2008) Oncogene 27, 2128–2136 [DOI] [PubMed] [Google Scholar]
- 93. Lu Z., Liu M., Stribinskis V., Klinge C. M., Ramos K. S., Colburn N. H., Li Y. (2008) Oncogene 27, 4373–4379 [DOI] [PubMed] [Google Scholar]
- 94. Sayed D., Rane S., Lypowy J., He M., Chen I. Y., Vashistha H., Yan L., Malhotra A., Vatner D., Abdellatif M. (2008) Mol. Biol. Cell 19, 3272–3282 [DOI] [PMC free article] [PubMed] [Google Scholar]
- 95. Liu M., Wu H., Liu T., Li Y., Wang F., Wan H., Li X., Tang H. (2009) Cell Res. 19, 828–837 [DOI] [PubMed] [Google Scholar]
Associated Data
This section collects any data citations, data availability statements, or supplementary materials included in this article.


