

Abstract
The pathogenetic mechanisms underlying gastrointestinal dysmotility in diabetic patients remain poorly understood, although enteric neuropathy, damage to interstitial cells of Cajal (ICC) and smooth muscle cell injury are believed to play a role. The aim of this study was to investigate the morphological and functional changes underlying intestinal dysmotility in RIP-I/hIFNβ transgenic mice treated with multiple very low doses of streptozotocin (20 mg/kg, i.p., 5 days). Compared with vehicle-treated mice, streptozotocin-treated animals developed type 1 diabetes mellitus, with sustained hyperglycaemia for 3.5 months, polyphagia, polydipsia and increased faecal output without changes in faecal water content (metabolic cages). Diabetic mice had a longer intestine, longer ileal villi and wider colonic crypts (conventional microscopy) and displayed faster gastric emptying and intestinal transit. Contractility studies showed selective impaired neurotransmission in the ileum and mid-colon of diabetic mice. Compared with controls, the ileal and colonic myenteric plexus of diabetic mice revealed ultrastructural features of neuronal degeneration and HuD immunohistochemistry on whole-mount preparations showed 15% reduction in neuronal numbers. However, no immunohistochemical changes in apoptosis-related markers were noted. Lower absolute numbers of neuronal nitric oxide synthase- and choline acetyltransferase-immunopositive neurons and enhanced vasoactive intestinal polypeptide and substance P immunopositivity were observed. Ultrastructural and immunohistochemical analyses did not reveal changes in the enteric glial or ICC networks. In conclusion, this model of diabetic enteropathy shows enhanced intestinal transit associated with intestinal remodelling, including neuroplastic changes, and overt myenteric neuropathy. Such abnormalities are likely to reflect neuroadaptive and neuropathological changes occurring in this diabetic model.
Keywords: colon, diabetes mellitus, ileum, immunohistochemistry, intestinal transit, neuromuscular transmission
Diabetes mellitus (DM) is associated with a wide range of chronic complications. Gastrointestinal (GI) symptoms, including diarrhoea and constipation, are more prevalent in diabetic patients than in the normal population (Bytzer et al. 2001). Diabetic gastroenteropathy can significantly impair the patient's quality of life and represents a major burden for any healthcare system. Development of new treatment options is hampered by poor understanding of the underlying pathophysiological mechanisms (Ördog 2008).
The best known GI motor disturbance associated with DM is gastroparesis, both in patients and animal models (Ma et al. 2009). However, there is a lack of basic knowledge on the small intestinal and colonic motor function in DM. Delayed, normal or accelerated intestinal transit has been reported in patients and animal models (Zhao et al. 2006). Delayed colonic transit has been described in diabetic subjects (Jung et al. 2003) and decreased distal colon motility has been reported in non-obese diabetic mice (Ördog et al. 2004). By contrast, both enhanced spontaneous activity of the proximal colon (Forrest & Parsons 2003) and peristalsis in the distal colon (Yoneda et al. 2001) might occur in diabetic rats. Abnormal GI motility might be due to impairment of the key elements responsible for its control, i.e. the enteric nervous system, interstitial cells of Cajal (ICC) and the smooth muscle.
In the myenteric plexus (MP), changes in neuronal numbers and altered expression of neurotransmitters have been described. Loss of myenteric neurons has been reported in several areas of the GI tract in rodents with either short-term or long-term DM (Fregonesi et al. 2001; Furlan et al. 2002; Anitha et al. 2006; Pereira et al. 2008). Apoptotic neuronal death appears to contribute to the neurodegeneration seen in the MP of diabetic models (Guo et al. 2004; Anitha et al. 2006). Enteric neuronal subpopulations respond differently to DM and the magnitude of the changes appears specific to the gut segment, enteric plexus (submucosal versus myenteric), neuromediator, model and duration of DM (LePard 2005). The metabolic disorder caused by DM may also influence the survival or function of the pacemaker cells in the GI tract, the ICC. Degenerative changes and/or ICC loss have been demonstrated throughout the GI tract of patients and diabetic models showing GI dysmotility (Ördog 2008). Abnormalities in GI smooth muscle may also play a central role in diabetic gastroenteropathy. These abnormalities include morphological remodelling and alterations in its excitability mechanisms or intracellular signal transduction pathways (Nowak et al. 1990; Anjaneyulu & Ramarao 2002).
This study has been based on a murine model of type 1 DM, the RIP-I/hIFNβ transgenic mouse treated with multiple very low doses of streptozotocin (STZ) (Casellas et al. 2006). This transgenic mouse expresses human interferon β in pancreatic β cells. There is evidence that IFNβ produces a local pro-inflammatory effect in pancreatic islets, inducing β cell damage that can result in type 1 DM (Pelegrin et al. 1998). Furthermore, when STZ is administered as multiple low doses, it triggers an autoimmune-mediated destruction of β cells. IFN β expression in pancreatic β cells in the present model increases mouse susceptibility to multiple very low doses of STZ, which are not diabetogenic in control mice. Thus, the direct toxic effects of STZ are minimized and the autoimmune response is maximized, making this model reminiscent to type 1 DM in humans (Casellas et al. 2006). Given the lack of basic knowledge on diabetic enteropathy compared with diabetic gastropathy, the main objective of this study was to evaluate the impact of DM on structures and mechanisms responsible for the control of intestinal motility in this model as compared to control transgenic mice at 6 months of age.
Materials and methods
Animals and tissue preparation
Male RIP-I/hIFNβ transgenic mice in outbreed ICR background were obtained from the Center of Animal Biotechnology and Gene Therapy (Universitat Autònoma de Barcelona, Spain) (Pelegrin et al. 1998; Casellas et al. 2006). At 2 months of age (approximately 35 g), animals were assigned to one of two groups: diabetic (mice treated with multiple very low doses of STZ, 20 mg/kg, i.p., five consecutive days) or control (animals treated with citrate buffer). Glycaemia was determined once a fortnight. Animals were considered diabetic when two successive determinations exceeded 250 mg/dl. Animals were kept under specific pathogen-free conditions on a 12-h light/dark cycle, at 22 ± 2 °C and 55 ± 10% RH with free access to water and a standard diet (2018S Teklad Global; Harlan Teklad, Madison, WI, USA). All the functional and morphological studies were performed 3–3.5 months after the onset of DM by an investigator blinded to the animal groups. Tissue samples were obtained after sacrificing the animals by cervical dislocation. The experimental procedure was approved by the Ethics Committee of Universitat Autònoma de Barcelona.
Functional studies
Metabolic study
Mice were housed in individual metabolic cages for 24 h, with 50 ml water and 7–8 g food. After the 24-h period, water and food intake as well as urine output were measured. Faeces were weighed, dried, and faecal water content was calculated.
Gastric emptying (GE) and small bowel transit
After an overnight fast, mice were fed 0.25 ml of a phenol red meal. Thirty min later, the stomach was isolated and ligated at the cardiac and pyloric ends. The entire small bowel was dissected, its total length and the front of the marker measured, and divided into 10 segments. The quantity of marker in the stomach and each intestinal segment was determined as previously described (Tachéet al. 1987). The percent GE, and the speed (cm/min) and geometric centre of the distribution of the marker throughout the small bowel were measured (Martín et al. 2004).
Colonic transit
The mid-distal colon was submerged into a 120-ml horizontal tissue bath with a silicon base and filled with modified Krebs solution (37 ± 1 °C, pH 7.4). Every 7 min a 4 mm-wide bead was inserted approximately 0.5 cm into the oral side of the colon. The time taken for each artificial pellet to be expelled was measured and peristalsis was recorded (Figure 1). When a bead was not expulsed within 20 min, it was assigned a value of 20. The estimation of colonic transit was expressed as the mean distance covered by the three artificial pellets per min (mm/min).
Figure 1.
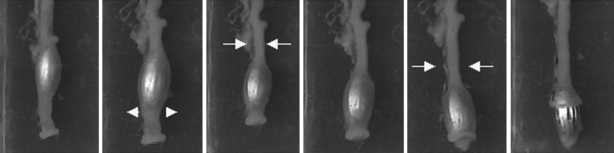
Colonic transit. Sequence image of bead propulsion and expulsion. Colonic muscle contraction proximal to the bead (arrows) along with relaxation distal to it (arrowheads) allow for propulsion of the bead towards the anal end.
Muscle bath studies
One-centimeter-long full thickness ileal preparations and 2-mm-wide mid-colon muscle strips were placed in 10-ml organ baths containing Krebs solution (37 ± 1 °C). Colonic strips were maintained under non-adrenergic, non-cholinergic conditions (NANC) (phentolamine, atropine and propanolol, each at 1 μM). Ileal and colonic samples were mounted in their longitudinal and circular axis, respectively, to obtain a predominant excitatory (ileum) or inhibitory (colon) neural response. These layers were thus selected to evaluate the main neurotransmitters involved in each response. Samples were tied (initial tension 500 mg) to an isometric force transducer (Harvard VF-1 Apparatus Inc., Holliston, MA, USA) Data were digitized (25 Hz) and collected in a PC with Datawin 1 software (Panlab, Barcelona, Spain). The experimental protocol included the following: (i) the study of the spontaneous mechanical activity pattern; (ii) the use of KCl (30 mM) to elicit ileal contraction and sodium nitroprusside (NaNP, 1 μM) to investigate colonic relaxation; (iii) electrical field stimulation (EFS) of the ileum (1-3-5-10-15-20 V, 30 Hz, 0.3-ms pulse duration, 1-s stimulus duration) to induce a preferential contractile response and EFS of the colon (60 V, 50 Hz, 0.4-ms pulse duration, 2–3-min stimulus duration) for a preferential inhibitory response.
Morphological studies
Histology
Ileal and mid-colonic samples were gently flushed clean, fixed in 4% formaldehyde (pH 7.3) and processed for routine histological examination. The general architecture of the intestinal wall was examined as described (Diani et al. 1976). Morphometrical evaluation of the mucosal (longitudinal sections) and muscle layers (cross-sections) was also performed to determine mean villus height, villus width and crypt depth (ileum); mean depth and width of the crypts of Lieberkühn (colon) (Diani et al. 1976); and mean thickness of the circular and longitudinal muscle layers.
Immunohistochemistry
Ileal and mid-colonic segments were opened along the mesenteric border, cleaned, pinned slightly stretched and fixed in 4% formaldehyde (4 h, 4 °C). Whole-mount preparations including the longitudinal muscle-MP (LMMP) were dissected. Longitudinal muscle and MP samples (4 × 2.5 mm) were processed for single- or double-label immunofluorescence treatments. Samples were washed (3 × 10 min) in phosphate-buffered saline (PBS, pH 7.4) containing 0.3% triton X-100 and incubated with the appropriate primary antibodies (48 h, 4 °C) (Table 1A). After washing, they were exposed to species-appropriate fluorochrome-conjugated secondary antibodies (1–2 h, RT) (Table 1B), washed in PBS and mounted in Mowiol. Antibody solutions contained 0.2% bovine serum albumin to minimize background. Negative controls were prepared by omitting the corresponding primary antibody. Longitudinal muscle-MP samples were observed under a Nikon Eclipse 90i epifluorescence microscope with FITC and TRITC filtres. For each animal, organ and antibody used, microphotographs of five randomly selected fields at 10× or 20× magnification were taken with a Nikon Digital Sight DS-5M Camera (Nikon Corp., Tokyo, Japan). Single-labelling procedures were used to study the density of neuron-specific enolase (NSE), VIP, SP, glial fibrillary acidic protein (GFAP) and c-kit in the MP. The mean percentage of the image occupied by positive structures was calculated with the morphometric software VideoTesT Morphology (VideoTesT Co., St. Petesburg, Russia). Double-labelling procedures were used to evaluate the percent myenteric neurons expressing neuronal nitric oxide synthase (nNOS), choline acetyltransferase (ChAT), cleaved caspase-3 or Bcl-2, relative to the whole myenteric neuronal population (HuD-positive neurons) (LePard 2005). Neuronal density was also determined and expressed as the average number of HuD-positive perikarya per field.
Table 1.
(A) Primary and (B) secondary antibodies
| Raised against | Host | Dilution | Source | Aimed at |
|---|---|---|---|---|
| (A) | ||||
| Human NSE | Rabbit | 1:10 | Calbiochem, San Diego, CA, USA | Neurons (cell body and processes) |
| Human HuD (L-20) | Goat | 1:200 | Santa Cruz Biotechnology, Santa Cruz, CA, USA | Neurons (cell body) |
| nNOS | Rabbit | 1:200 | Calbiochem | Nitrergic neurons |
| ChAT | Rabbit | 1:1000 | Kind gift from Dr. Schemann, Hannover, Germany | Cholinergic neurons |
| Cleaved caspase-3 | Rabbit | 1:100 | Cell Signaling Technology, Danvers, MA, USA | Apoptotic cells |
| Bcl-2 | Rabbit | 1:1500 | Chemicon International Inc., Temecula, CA, USA | Antiapoptotic protein Bcl-2 |
| VIP | Rabbit | 1:250 | Chemicon International | VIPergic neurons |
| SP | Rabbit | 1:250 | Chemicon International | SPergic neurons |
| Human c-kit (CD117) | Rabbit | 1:100 | DakoCytomation, Glostrup, Denmark | Interstitial cells of Cajal |
| Bovine GFAP | Rabbit | 1:250 | DakoCytomation | Enteric glial cells |
| Antibody | Host | Dilution | Source | Used against |
|---|---|---|---|---|
| (B) | ||||
| Anti-rabbit IgG*TRITC | Goat | 1:600 | Sigma Chemicals, Saint Louis, MO, USA | NSE |
| Anti-goat IgG*Alexa Fluor 555 | Donkey | 1:1000 | Molecular Probes, Inc, Eugene, OR, USA | HuD |
| Anti-rabbit IgG*Alexa Fluor 488 | Donkey | 1:1500 | Molecular Probes | nNOS, ChAT, Bcl-2, cleaved caspase-3 |
| Anti-rabbit IgG*CY3 | Goat | 1:150 | Amersham Int., Arlington Heights, IL, USA | VIP, SP, GFAP, c-kit |
GFAP, glial fibrillary acidic protein; NSE, neuron-specific enolase.
Transmission electron microscopy
Ileal and mid-colonic specimens were immersed in fixative composed of 2.5% glutaraldehyde plus 2% formaldehyde in 0.1 M PB overnight (4 °C) and subsequently processed for ultrastructural examination. Ultrathin sections (70 nm) from selected areas were cut with an Ultracut E Reichert-Jung ultramicrotome (C. Reichert AG, Wien, Austria) and stained with uranyl acetate and lead citrate. Sections were scanned with a 200Kv Jeol Jem-2011 transmission electron microscope (Jeol Ltd, Tokyo, Japan) equipped with a CCD Gatan 794 MSC 600HP camera (Gatan Inc., Pleasanton, CA, USA). From an ileal and colonic sample per animal, one section containing 2–3 myenteric ganglia was checked for ultrastructural neuronal damage, which was assessed according to the following arbitrary semiquantitative score: neuronal apoptosis = 5, condensation of the nucleus = 3, mitochondrial damage = 3, intracellular myelin-like profiles = 1, loss of synaptic contacts = 1 and distribution of lesions throughout the ganglia = 1 if focal or 3 if extensive. Thus, a single section could be given a maximal lesional score of 16.
Statistics
Data are presented as mean ± standard error of the mean (SEM) when normally distributed, or as median (25–75% percentiles) if non-normally distributed. ‘N’ equals the mice analysed per group. Comparisons of parametric data between experimental groups were assessed with the Student's t-test or two-way anova followed by the Bonferroni post hoc test. Comparisons of parametric data from the same animal were performed using the paired Student's t-test or one-way anova for repeated measures followed by the Bonferroni post hoc test. Non-parametric data were evaluated with the Mann–Whitney U-test. Contingency tables were analysed using the Fisher's exact test. Significance was assumed at P<0.05. Statistical analyses were carried out with GraphPad Prism 4.00 (GraphPad Software, San Diego, CA, USA).
Solutions and drugs
The phenol red meal consisted of 2% phenol red marker (Sigma Chemicals, St. Louis, MO, USA) in a casein hydrolysate (Sigma Chemicals) solution (2.77 Kcal/ml saline). The Krebs solution was bubbled with carbogen (95% O2–5% CO2) and was composed of (in mM): 10.10 glucose, 115.48 NaCl, 21.90 NaHCO3, 4.61 KCl (5.1 KCl for the modified Krebs solution), 1.14 NaH2PO4, 2.50 CaCl2 and 1.16 MgSO4 in distilled water. The following drugs were used: phentolamine, Nω-nitro-l-arginine (l-NNA) and nifedipine (Sigma Chemicals); atropine sulphate (Merck KGaA); N6-methyl-2′-deoxyadenosine-3′,5′-bisphosphate (MRS 2179) (Tocris, Bristol, UK); propranolol, tetrodotoxin (TTX) and NaNP (RBI, Natick, MA, USA). For immunohistochemical studies, triton X-100, bovine serum albumin (Sigma Chemicals) and Mowiol (Calbiochem, Darmstadt, Germany) were employed.
Results
Diabetes assessment
The STZ-treated transgenic animals were diabetic 1 month after the injections. During the following 3.5 months, they displayed sustained hyperglycaemia and failed to gain body weight. STZ-treated mice also showed marked polyphagia, polydipsia and polyuria, thus completing the classical manifestations indicative of DM. Faecal output was significantly increased as compared to control mice, although stool appearance and water content were not altered (data not shown). Diabetic animals had abdominal distention and more abundant GI content than controls.
Gastric emptying and intestinal transit
Gastric emptying was enhanced in diabetic animals compared with controls (61.2 ± 3.8%, N = 15 control vs. 88.5 ± 2.2%, N = 13 diabetic mice; t-test, P<0.001). The speed of marker propagation along the small bowel was enhanced in diabetic mice (1.45 ± 0.04 cm/min, N = 14 control vs. 1.60 ± 0.04 cm/min, N = 11 diabetic mice; t-test, P<0.05). However, because the small bowel was elongated in diabetic animals (51.2 ± 1.0 cm, control vs. 57.9 ± 2.0 cm, diabetic mice; t-test, P<0.01), the geometric centre of the marker was similar in both experimental groups (5.4 ± 0.1, control and 5.8 ± 0.2 diabetic mice; t-test, P>0.05). The mean transit time taken by three beads to pass through the mid-distal colon was lower in the diabetic than in the control group (14.4 ± 1.3 min, N = 18 control vs. 10.8 ± 1.4 min, N = 16 diabetic animals; t-test, P<0.05). Moreover, the mid-distal colon of diabetic mice was elongated (33.5 ± 0.8 mm, control vs. 40.6 ± 1.5 mm, diabetic mice; t-test, P<0.001). Therefore, the mean propagation rate of the artificial pellets was faster in diabetic mice (2.7 ± 0.8 mm/min, control vs. 5.2 ± 1.1 mm/min, diabetic mice; t-test, P<0.05). Some colons expelled ≥3 consecutive beads (33%, control vs. 81%, diabetic mice; Fisher's exact test, P <0.05).
Contractility studies
Longitudinal muscle layer of the ileum
No major differences between groups were observed either in the amplitude of spontaneous or induced (KCl 30 mM) contractions. However, the frequency of spontaneous cyclic contractions was slightly reduced in preparations from diabetic mice (34.7 ± 0.8 cpm, N = 10 control vs. 32.7 ± 0.5 cpm, N = 11 diabetic mice; t-test, P<0.05). In all the samples, EFS induced an atropine (1 μM)-sensitive phasic contraction, which increased in amplitude in a voltage-dependent manner (Figure 2a,b). The amplitude of contractions was higher in diabetic animals (two-way anova, P<0.01; N = 9/group) (Figure 2c). In the presence of atropine, EFS induced a transient relaxation defined by a transient inhibition of spontaneous motility (latency), a decrease in basal tone followed by an off contraction. Latency and basal tone loss were reduced in diabetic mice (two-way anova, P<0.001; N = 9/group). In both groups, the EFS-induced relaxation was abolished when the tissue was incubated with a combination of the nitric oxide synthase inhibitor l-NNA (1 mM) and the P2Y1 receptor antagonist MRS 2179 (20 μM) (Figure 3). After cholinergic, nitrergic and purinergic blockade, a TTX (1 μM)-sensitive excitatory response was elicited after EFS. This response consisted of voltage-dependent, sustained (approximately 20–30 s) contractions. Segments from diabetic mice displayed slightly but decreased area under the curve of the response compared with controls (two-way anova, P<0.001).
Figure 2.
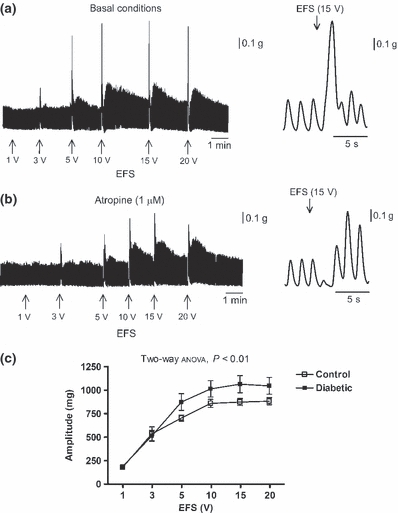
Electrical field stimulation (EFS)-evoked cholinergic response of the ileal longitudinal muscle layer. (a, b) Left panel: tracings of the EFS-induced contractions in a control sample at increasing voltages under basal conditions (a) and in the presence of atropine 1 μM (b). Right panel: expanded tracings showing a detailed EFS-evoked cholinergic contraction (a) and, under non-cholinergic conditions, an EFS-induced transient relaxation followed by an off contraction. (c) Relationship between stimulation voltage under basal conditions and amplitude of phasic contractions above basal tone in samples from diabetic mice compared with controls.
Figure 3.
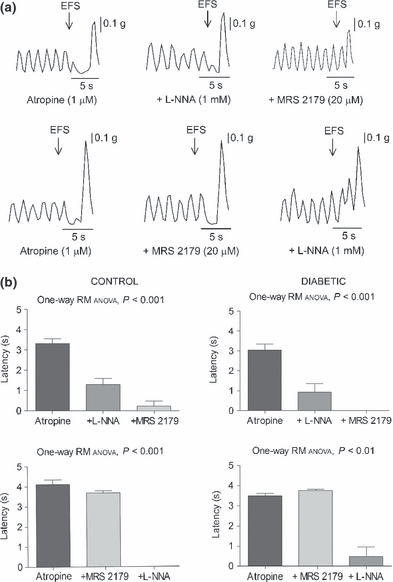
Effects of l-NNA (1 mM) and MRS 2179 (20 μM) on the 15 V-electrical field stimulation-induced relaxation of the ileal longitudinal muscle layer in the presence of atropine 1 μM. (a) Representative mechanical recordings showing the sequential reversal of the relaxation with the addition of these drugs in both orders. (b) Bar diagrams showing the inhibition of the initial level of relaxation, in terms of latency, after administration of l-NNA followed by MRS 2179 (upper panel) and MRS 2179 followed by l-NNA (lower panel) in preparations from control (left panel) and diabetic animals (right panel).
Circular muscle layer of the mid-colon
Spontaneous cyclic contractions of similar amplitude between groups were recorded. Nonetheless, their frequency was higher in diabetic mice (0.9 ± 0.1 cpm, N = 10 control vs. 1.3 ± 0.1 cpm, N = 9 diabetic mice; t-test, P<0.05). The nitric oxide donor NaNP (1 μM) caused complete cessation of motility in all the strips (N = 5/group). The presence of an inhibitory neural tone was studied with the addition of TTX, l-NNA or MRS 2179 to the bathing fluid. l-NNA (1 mM) or TTX (1 μM) (N = 10 control and N = 8–9 diabetic mice) increased the magnitude and frequency (paired t-test, P<0.05) of spontaneous contractions. Such an increase in contractile response was lower in diabetic mice, especially regarding the contraction frequency in the presence of TTX (paired t-test, P>0.05) (Figure 4a–d). After neural blockade with TTX, the amplitude and frequency of contractions was similar between groups (t-test, P>0.05). MRS 2179 (20 μM) (N = 5/group) failed to modify the spontaneous contractions in either group (paired t-test, P>0.05) (Figure 4e). Electrical field stimulation suppressed the spontaneous activity. l-NNA (1 mM) and MRS 2179 (20 μM) abolished this EFS-induced relaxation and an excitatory response was recorded, which was larger in diabetic compared with control mice (14.5 ± 9.2% excitation, N = 8 control vs. 162 ± 67% excitation, N = 8 diabetic mice; t-test, P<0.05) (Figure 5).
Figure 4.
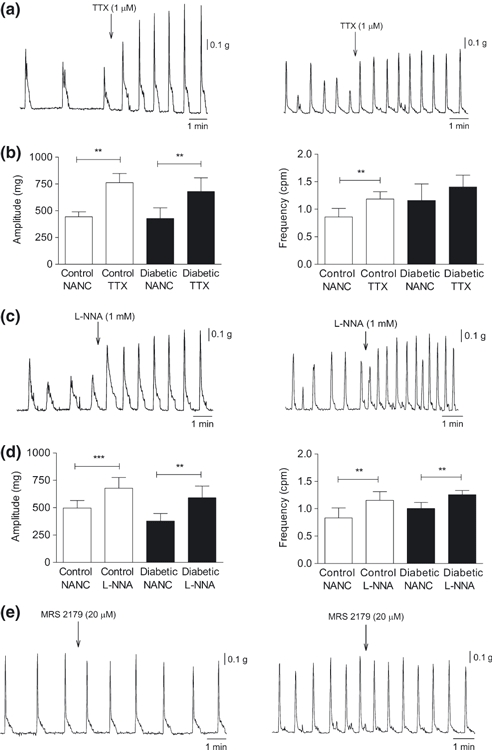
Effects of tetrodotoxin (TTX) (1 μM), l-NNA (1 mM) and MRS 2179 (20 μM) on the spontaneous mechanical activity of the circular muscle layer of the mid-colon. (a, c, e) Representative tracings showing the contractile activity of the strips from control (left panel) and diabetic mice (right panel) after TTX (a), l-NNA (c) or MRS 2179 (e) exposure. (b, d) Bar diagrams showing the changes in amplitude and frequency of circular muscle layer contractions in samples from both groups after TTX (b) or l-NNA (d) addition; paired Student's t-test, *P<0.05, **P<0.01 and ***P<0.001.
Figure 5.

Electrical field stimulation (EFS)-evoked inhibition of the spontaneous motility of the mid-colonic circular muscle layer under basal conditions (NANC) and in the presence of l-NNA (1 mM) and MRS 2179 (20 μM). (a) Mechanical recordings of strips from control (left panel) and diabetic animals (right panel) demonstrating the sequential reversal of the EFS-induced relaxation after l-NNA and MRS 2179 addition. (b) Histogram corresponding to the residual EFS-evoked response after l-NNA and MRS 2179 addition (expressed in percent inhibition or excitation) in strips from control and diabetic mice under each condition. Control reference values were obtained from the mechanical activity immediately previous to EFS application and assigned a value of −100%. Student's t-test was applied to each pair of columns, *P<0.05.
Histological evaluation of the intestinal wall
The general morphology of the ileum and mid-colon was preserved in diabetic animals, with no signs of degeneration or inflammation in any of the intestinal layers. Nonetheless, the crypts of Lieberkühn tended to contain more mucus in the lumina. Significant differences in microscopic measurements included villus lengthening, villus thinning and thickened circular muscle layer in the ileum, as well as wider crypts of Lieberkühn and thinner circular muscle layer in the mid-colon of diabetic mice (Table 2).
Table 2.
Microscopic measurements of the mucosal and muscle layers of the ileum and mid-colon of control and diabetic mice
| Ileum | Mid-Colon | ||||
|---|---|---|---|---|---|
| Control | Diabetic | Control | Diabetic | ||
| Mucosal layer | |||||
| No. villi/mm | 12.4 ± 0.5 | 12.0 ± 0.7 | No. crypts/mm | 23.4 ± 1.8 | 22.0 ± 1.3 |
| Villus length (μm) | 184.8 ± 11.0 | 224.6 ± 12.0* | |||
| Villus width ((μm) | 83.7 ± 3.9 | 73.1 ± 3.8** | Crypt width (μm) | 39.6 ± 1.4 | 43.8 ± 1.1* |
| Crypt depth (μm) | 105.6 ± 7.0 | 116.2 ± 16.0 | Crypt depth (μm) | 288.7 ± 13.0 | 271.0 ± 10.6 |
| Muscle layer (thickness) | |||||
| Circular (μm) | 25.3 ± 2.2 | 30.5 ± 2.9* | Circular (μm) | 114.7 ± 9.5 | 84.5 ± 5.3* |
| Longitudinal (μm) | 15.5 ± 1.3 | 16.8 ± 1.2 | Longitudinal ((μm) | 22.2 ± 2.9 | 23.2 ± 1.7 |
| Whole-muscle layer (μm) | 40.8 ± 3.5 | 47.2 ± 4.1* | Whole-muscle layer (μm) | 136.7 ± 7.6 | 107.4 ± 4.9* |
Figures represent mean ± SEM. The mean value for each animal was obtained from 10 and 8 observations in the mucosal and muscle layer respectively. Significance was tested with the Student's t-test.
P<0.05 vs. control mice
P<0.01 vs. control mice.
Immunohistochemistry on LMMP whole-mount preparations
Neuron-specific enolase immunoreactivity provided strong, diffuse staining of the neuronal perikarya and processes of the MP. In diabetic mice, the NSE-positive area in the ileal MP was similar to controls, whereas it was reduced in the colonic MP (Table 3A, Figure 6). HuD immunohistochemistry, which stained the myenteric neuronal bodies, revealed decreased neuronal density both in the ileum and mid-colon of diabetic mice compared with controls (Table 3B, Figure 6). Numerous neuronal bodies immunoreactive for nNOS or ChAT were observed in the myenteric ganglia and, occasionally, along internodal nerve strands of all the preparations. The percentage of nNOS- or ChAT-labelled myenteric neurons did not differ between groups in either intestinal segment. The percentage of myenteric neurons displaying cleaved caspase-3 immunoreactivity was low in all the samples and similar between groups in each intestinal segment. The proportion of myenteric neurons moderately to strongly immunoreactive for Bcl-2 was comparable between groups in each intestinal segment (Table 3B). VIP or SP staining demonstrated a dense myenteric network of immunofluorescent nerve fibres and scattered VIP- or SP-expressing neuronal bodies within ganglia and along internodal strands. The density of VIP positivity was increased in both the ileal and colonic MP of diabetic mice. The frequency of VIP-positive neurons in the ileum was higher than in controls, whereas it remained unchanged in the colon (Table 3, Figure 6). Diabetic mice showed increased SP staining in the ileal and colonic MP compared with controls and unaltered frequency of SP-stained neuronal somas (Table 3, Figure 6). Enteric glial cells (EGC) were detected with an antibody against GFAP. Dense networks of immunoreactive star-shaped cells were seen extending throughout the ganglia, wrapping neuronal bodies and nerve fibre tracts. In diabetic mice, the density of the EGC network in both intestinal segments was indistinguishable from that of controls (Table 3A). Interstitial cells of Cajal of the myenteric plexus (ICC-MP) were identified by c-kit immunohistochemistry. In all the samples, it revealed a dense multilayered network of multipolar and anastomosed cells closely associated with the MP structures. No major differences in the density of the ileal or colonic ICC-MP were detected between groups (Table 3A).
Table 3.
Density of immunoreactivity to specific neurotransmitters and cell populations (A) and counts of immunohistochemically defined neuronal cell bodies (B) in ileal and mid-colonic myenteric plexus
| Ileum | Mid-colon | |||
|---|---|---|---|---|
| Control | Diabetic | Control | Diabetic | |
| (A) % positivity against | ||||
| NSE | 19.5 ± 1.6 (8) | 20.5 ± 1.5 (8) | 42.3 ± 2.1 (8) | 35.5 ± 1.9 (7)* |
| VIP | 0.8 ± 0.1 (3) | 1.3 ± 0.1 (4)** | 7.2 ± 0.4 (4) | 11.8 ± 1.8 (4)* |
| SP | 1.5 ± 0.3 (4) | 2.5 ± 0.2 (4)* | 4.3 ± 0.8 (5) | 7.6 ± 0.4 (4)* |
| GFAP | 7.5 ± 0.6 (4) | 8.6 ± 0.8 (4) | 11.9 ± 1.9 (4) | 12.1 ± 0.4 (4) |
| c-kit | 43.7 ± 1.9 (4) | 39.9 ± 3.7 (3) | 42.4 ± 1.9 (4) | 39.4 ± 1.5 (4) |
| (B) Neuronal counts | ||||
| HuD+ neurons/0.17 mm2 | 61.5 ± 4.6 (7) | 51.6 ± 4.4 (6)* | 88.3 ± 4.8 (7) | 75.0 ± 3.3 (7)* |
| % HuD+ neurons stained for | ||||
| nNOS | 25.8 ± 3.1 (3) | 31.8 ± 4.3 (3) | 39.6 ± 4.0 (4) | 41.6 ± 3.8 (4) |
| ChAT | 79.0 ± 5.1 (3) | 76.3 ± 2.5 (3) | 71.4 ± 8.2 (4) | 76.4 ± 3.9 (4) |
| Cleaved caspase-3 | 1.4 ± 1.0 (3) | 4.5 ± 2.0 (4) | 2.4 ± 1.2 (3) | 2.8 ± 1.4 (3) |
| Bcl-2 | 20.6 ± 2.3 (3) | 17.3 ± 2.8 (3) | 15.0 ± 2.4 (3) | 19.0 ± 2.4 (3) |
| No. +neurons/15 ganglia | ||||
| VIP | 3.5 ± 0.9 (4) | 9.0 ± 1.1 (4)** | 23.4 ± 3.5 (5) | 14.5 ± 2.4 (4) |
| SP | 11.3 ± 1.5 (4) | 8.8 ± 0.7 (4) | 8.9 ± 1.6 (5) | 6.8 ± 1.2 (4) |
GFAP, glial fibrillary acidic protein; NSE, neuron-specific enolase.
Figures represent mean ± SEM. The numbers of animals used are given in parentheses. Data in (A) are expressed as mean percent immunofluorescent area per scanned field. NSE staining was evaluated at 10× magnification (0.75 mm2/field). Samples immunostained with VIP, SP, GFAP or c-kit were scanned at 20× magnification (0.17 mm2/field). Counts in (B) are expressed as absolute numbers per 0.17 mm2 field, relative to total HuD-positive neurons or as absolute numbers in 15 ganglia. Only those neurons moderately to strongly immunoreactive for any given marker were quantified. Comparisons between groups were performed using the Student's t-test.
P<0.05 vs. control mice
P<0.01 vs. control mice.
Figure 6.
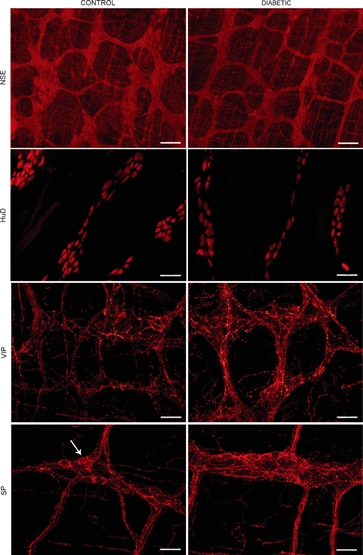
Immunohistochemistry on longitudinal muscle-myenteric plexus (LMMP) whole-mount preparations of ileum and colon of control and diabetic mice. Representative micrographs of neuron-specific enolase immunostaining, demonstrating the ganglionated myenteric network in the colon, which is less dense in diabetic mice; HuD immunostaining, showing immunoreactive neuronal somas of the ileal MP, with no staining of nerve fibres. Myenteric neurons were less numerous in samples from diabetic animals; VIP immunofluorescence in the colonic MP, demonstrating positivity primarily confined to neuronal processes and denser staining in samples from diabetic mice; SP immunofluorescence in the ileal MP, showing dense networks of fluorescent fibres, which are more abundant in diabetic animals. Note scattered faintly labelled neuronal somas (arrow).
Ultrastructural study of the myenteric plexus
Myenteric neurons in the ileum and mid-colon of control mice displayed a regular contour, an organized perikaryon with mitochondria of normal shape and uniform density, and a nucleus with diffusely and evenly spread chromatin (Figure 7a–c). Isolated neurons showed variable numbers of intracellular myelin-like profiles and enlargement of the interneuronal space. In approximately 50% of ileal and colonic samples from diabetic mice, myenteric ganglia focally or multifocally displayed neurons with distorted contour, shrunken perikarya, mitochondrial damage (swelling and/or disrupted cristae) and/or clumping of the chromatin [0.0 (0.0–2.0), N = 7 control vs. 4.0 (0.0–6.5), N = 7 diabetic mice; Mann–Whitney U-test, P<0.05] (Figure 7d–e). In the diabetic group, the MP of the ileum and colon was similarly damaged [3.5 (1.0–8.0), N = 7 ileum and 6.0 (0.0–6.0), N = 7 colon; P>0.05). However, the intestinal segments from each animal did not show the same extent of abnormalities. A clear regional progression of the lesions (i.e. proximal to distal or vice versa) was not detected. No ultrastructural abnormalities were detected in nerve bundles, EGC (Figure 7a) or ICC-MP in any of the investigated samples. Surrounding smooth muscle cells had an intact structure despite slight to moderate peripheral vacuolization of the sarcoplasm. In isolated ilea and colons from each group, such vacuolization corresponded to degenerate mitochondria.
Figure 7.
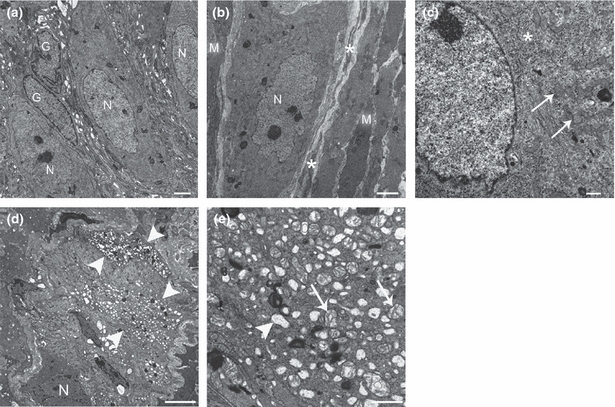
Representative transmission electron micrographs of the ileal and colonic myenteric plexus (MP) of control (a–c) and diabetic mice (d–e). a) Normal-appearing myenteric ganglion containing three neurons (N) and two enteric glial cells (G). (b) Neuromuscular arrangement in the MP and its close relationship with interstitial cells of Cajal (ICC) of the MP. A myenteric neuron (N) is surrounded by ICC processes (asterisks), which are in turn surrounded by smooth muscle cells (M). (c) Detailed view of the nuclear and perinuclear region of a normal-appearing myenteric neuron. Note rough endoplasmic reticulum (asterisk) and numerous mitochondria (arrows). (d) Abnormal myenteric ganglion. A neuron with preserved structure is shown (N), and at least two adjacent neurons exhibit severe vacuolization of the perikaryon (arrowheads). (e) Closer view of a myenteric neuron with signs of moderate-severe cell injury. Empty vacuoles corresponding to dilated rough endoplasmic reticulum (arrowhead), Golgi complex and swollen mitochondria with disrupted cristae (arrows) are seen.
Discussion
The main objective of this work was to study the structural and functional changes responsible for intestinal dysmotility in the RIP-I/hIFNβ transgenic mouse after 3.5 months of DM induced with STZ. In a preliminary study in strain-matched wild-type animals, multiple very low doses of STZ at 20 mg/kg showed no toxic effects on colonic MP and ICC-MP on immunohistochemical grounds (data not shown). Previous data show that single higher doses of STZ had no repercussions on the ileal MP of rats and guinea pigs (Belai et al. 1996; LePard 2005).
Two main groups of abnormalities in the diabetic mice might affect, directly or indirectly, the key elements responsible for the control of GI motility. On the one hand, metabolic disturbances such as hyperglycaemia and hypoinsulinaemia, which might cause deleterious effects; on the other hand, polyphagia, polydipsia and all the adaptive changes related to the disease, which should allow the animals to survive under adverse conditions. At 3.5 months of DM, RIP-I/hIFNβ mice probably showed a balance between all these concurrent factors: the intestinal transit was adapted to the diabetic state, and this adaptation was combined with signs of neuropathy.
RIP-I/hIFNβ diabetic mice consumed approximately 46% more food and approximately 230% more water as compared to controls, in line with other type 1 diabetic models (Forrest & Parsons 2003; Pereira et al. 2008). The GI content was significantly more abundant, and daily faecal output was approximately 60% increased despite unaltered faecal water content, indicating that water absorption is not impaired in this model. The presence of abundant well-formed faeces in diabetic mice coincides with findings in Otsuka Long-Evans Tokushima Fatty rats (Imaeda et al. 1998), whereas other long-term rat models of DM with gastroenteropathy present pasty unformed stools in the colon, suggestive of diarrhoea (Lincoln et al. 1984; Yamada et al. 2007).
Diabetic mice showed intestinal remodelling that reflected an increased area of food and water absorption: (i) the small bowel was elongated (approximately 10%), as reported in other experimental models within the first month of the disease (Ettarh & Carr 1997; Martín et al. 2004); (ii) the intestinal villi were longer, suggestive of mucosal hyperplasia, in accordance with data from other experimental rodent models (Mayhew & Carson 1989). Lengthening of the small bowel and mucosal hyperplasia has been regarded as adaptive changes in response to decreased glucose utilization and polyphagia in DM (Martín et al. 2004; Yamada et al. 2007). (iii) Approximately 20% elongation of the colon accompanied with wider crypts. This increase in the area of absorption in the small bowel and colon was accompanied by an adaptation of intestinal motility. Our data show that diabetic mice ate more than controls and daily faecal output was increased. Accordingly, diabetic mice cannot survive without an adaptation of the GI motility to the increased load in the GI tract. After 3.5 months of DM, this adaptation included the following: (i) faster GE, in line with results from type 2 diabetic patients with recently diagnosed DM (Phillips et al. 1992); thirty min after the administration of a phenol red meal, the stomach of diabetic mice only contained 11% of the marker, compared with 39% in controls. The faster GE in diabetic mice might explain the further progression of the marker down the small bowel. Nonetheless, accelerated small bowel transit cannot be ruled out. In fact, enhanced small bowel transit has been reported both in diabetic patients (Zhao et al. 2006) and rodent models (Anjaneyulu & Ramarao 2002; Anitha et al. 2006; Yamada et al. 2007). (ii) Accelerated colonic transit, in line with enhanced colonic transit and peristalsis in Otsuka Long-Evans Tokushima Fatty rats (Yoneda et al. 2001) and increased effectiveness in bead expulsion. In conclusion, our results suggest the following: (i) the increased GI content as a result of polyphagia is compensated with a larger surface of absorption in the small bowel and an adaptation of the mechanisms of control of GI motility resulting in accelerated GI transit and increased faecal output; (ii) the increased water intake is also compensated by a larger area of absorption in the colon.
The smooth muscle in RIP-I/hIFNβ diabetic mice showed no remarkable ultrastructural pathological changes. However, histology revealed a thickened smooth muscle layer (circular layer) in the small bowel, despite elongation of this organ; and a thinner smooth muscle layer (circular layer) in the mid-colon. The cause of these regional differences and apparent selective effect on the circular layer needs further enquiry. The increased smooth muscle thickness in the small intestine is consistent with the greater smooth muscle mass found in other long-term experimental models (Lincoln et al. 1984; Mayhew & Carson 1989; Nowak et al. 1990). The histological findings in the colon are in disagreement with other studies, where increased (Zhao et al. 2009) or unchanged (Yoneda et al. 2001) muscle thickness or mass has been reported. Despite altered muscle length and/or width, muscle function was unaffected in diabetic animals. The ileal longitudinal muscle layer and the colonic circular muscle layer displayed spontaneous cyclic contractions similar in amplitude to those shown by control preparations. Furthermore, the contractile response to KCl (30 mM) of the ileum and the relaxation response to NaNP (1 μM) of the mid-colon were comparable between groups. Taken together, these results suggest that the intestinal smooth muscle layer of this diabetic model is functionally unimpaired and it is probably able to adapt to DM-associated injury.
While ICC play a role in diabetic gastroparesis (Ördog 2008), their putative involvement in DM-associated intestinal dysmotility is less well known. We could not find a substantial decrease in c-kit staining or evidence of ultrastructural damage to the ileal or colonic ICC-MP of diabetic mice. By contrast, reduced areas of ICC-MP in the ileum and mid-colon of db/db mice (Yamamoto et al. 2008) and within the smooth muscle layer of the colon of diabetic patients (Nakahara et al. 2002) and type 1 diabetic murine models (Ördog et al. 2004; Lin et al. 2010) have been described. ICC-MP functionality was also evaluated in the mid-colon by assessing the frequency of spontaneous muscle contractions following neural blockade. In diabetic mice, the frequency of contractions was similar to controls, indicating that ICC-MP function was maintained. By contrast, in the small intestine a slight decrease in frequency of spontaneous contractions, which are probably related to smooth muscle cyclic depolarizations driven by the pacemaker network, was observed. This occurred despite the presence of an intact ICC-MP network. These discrepancies between structural and functional data need to be further explored. Altogether, our results suggest that ICC are able to survive and function despite the hypoinsulinaemia shown by this model (Casellas et al. 2006). Recent reports on the GI tract of murine models of DM have indicated that low or inefficient levels of trophic factors (e.g. insulin) rather than hyperglycaemia per se may alter the Kit signalling pathway, leading to ICC damage (Horvath et al. 2005; Yamamoto et al. 2008; Lin et al. 2010). The mechanism responsible for ICC-MP resistance to injury in the intestine of this model needs further evaluation. However, various studies support the idea that ICC classes show different susceptibility to alterations of the Kit signalling pathways (Ördog 2008).
Neuron-specific enolase and HuD immunolabelling of LMMP preparations revealed, respectively, diminished density of the MP in the mid-colon and reduced neuronal density by 15% both in the mid-colon and ileum of diabetic mice compared with controls. Two possible hypotheses could explain these results: (i) the elongation of the intestinal tract might be responsible for the reduced density of neurons, in which case a compensatory overgrowth of neuronal processes would be expected. (ii) DM causes neuronal damage and loss in the MP, as supported by other studies on the ileum (LePard 2005; Anitha et al. 2006; Pereira et al. 2008) and colon (Furlan et al. 2002) of diabetic rodents. Following this latter hypothesis, we investigated whether neuronal loss occurred via apoptosis, as described in the ileum and mid-colon of STZ-treated rodents after 2 months of DM (Guo et al. 2004; Anitha et al. 2006), using anti-cleaved caspase-3 immunohistochemistry. By contrast, in the current study, the percent cleaved caspase-3-positive neurons was low and similar between groups, although a slight tendency to increase was observed in the ileum of diabetic mice. Electron microscopy failed to demonstrate an increase in fully developed apoptotic figures in samples from this model. However, it showed severe neuronal injury, such as mitochondrial damage, compatible with hyperglycaemia-induced early apoptotic changes. These degenerative features resembled those seen in the colonic MP of STZ-treated diabetic mice (Anitha et al. 2006). Interestingly, not all neurons were damaged. Bcl-2 staining revealed no significant differences between groups. These results suggest that in this model an early death of the most susceptible neurons might have occurred. It is also possible that components of the apoptotic cascade other than cleaved caspase-3 and Bcl-2 might be involved in promoting (or protecting from) cell death. Globally, we can conclude that in RIP-I/hIFNβ diabetic mice, there is evidence of enteric neuropathy in the ileum and mid-colon characterized by loss of myenteric neurons and severe degenerative changes compatible with early neuronal apoptosis. This might imply a reduced nerve supply, altering the regional control of GI motility.
We investigated specific subpopulations of neurons, namely, ChAT-, nNOS-, SP- and VIP-containing neurons. Our results show the following: (i) the proportion of ChAT-positive myenteric neuronal somas (approximately 76% in each segment) was comparable between experimental groups, in accordance with another study on the ileal MP of STZ-treated diabetic mice (Anitha et al. 2006). (ii) The percent nNOS-positive myenteric neurons was also comparable between groups (approximately 25% in the ileum and approximately 40% in the mid-colon), in line with a study conducted on the ileal MP of STZ-treated guinea pigs (LePard 2005). However, given the reduced myenteric neuronal population in diabetic mice, ChAT- and nNOS-expressing neurons were decreased in absolute numbers, most likely reflecting loss of these subpopulations. (iii) Despite no major changes in numbers of SP-positive neurons in either compartment, SP immunoreactivity within neuronal fibres was prominent in all the samples and increased in diabetic animals, in line with findings in the small bowel of a type 1 diabetic patient (He et al. 2001) and STZ-treated diabetic rats (Belai & Burnstock 1990). (iv) In diabetic mice, absolute numbers of VIP-positive myenteric neurons were increased in the ileum. However, most remarkably, VIP immunoreactivity within neural fibre tracts was more abundant in both compartments, as reported in STZ-treated diabetic rats (Belai et al. 1985). All these data suggest that in diabetic mice, neuroplastic changes occur and affect several subclasses of neurons. (v) Despite myenteric neuronal loss in diabetic mice, we found unaltered morphology, distribution and density of the EGC network. By contrast, decreased GFAP immunostaining (in terms of intensity) and protein levels in the MP of the distal colon of STZ-treated diabetic rats have recently been reported (Liu et al. 2010).
Intestinal peristalsis involves the appropriate coordination of both the longitudinal and circular muscle layers, as evident in Figure 1. To evaluate the neurotransmitters involved in the neuromuscular response of each layer, the ileal longitudinal muscle layer and the mid-colonic circular muscle layer were selected for muscle bath studies. It is important to take into account, however, that to properly correlate the in vitro results with the ex vivo and in vivo data, the coordination of both muscle layers should be considered. Muscle bath studies showed that the predominant response in the longitudinal muscle layer of the small intestine is excitatory, as evidenced by the cholinergic phasic contractions elicited by EFS. Subsequent incubation with atropine revealed the presence of a functional inhibitory co-transmission (nitrergic and purinergic) followed by a TTX-sensitive non-cholinergic contraction. By contrast, in the colonic circular muscle layer, the predominant response under NANC conditions is inhibitory, of nitrergic and purinergic origin. As previously demonstrated in rats (Grasa et al. 2009), this constitutes an excellent model to study nitrergic and purinergic neurotransmission described in the human colon (Gallego et al. 2008, 2011). In diabetic mice, muscle bath studies revealed the following: (i) a slight increase in neurally mediated cholinergic contractions in the ileum. (ii) Decreased neurally mediated non-cholinergic contractions in the ileum, but more prominent non-cholinergic contractions in the colon. (iii) Impaired inhibitory neurotransmission in the ileum, reflected by the reduced EFS-induced relaxation in the presence of atropine. When the nitrergic and purinergic components of the EFS-evoked relaxation were analysed separately, no major differences were observed between groups regarding each pathway. This supports the impairment of both inhibitory pathways in diabetic mice. (iv) Impaired nitrergic inhibitory neural tone in the colon, as evidenced by a lower enhanced contractile activity in the presence of l-NNA or TTX. It is not easy to correlate morphological with functional data. Our immunohistochemical findings support the attenuated nitrergic response in both intestinal segments of diabetic mice. In DM, diminished nNOS expression has been associated with altered nitrergic GI motor control, including impaired relaxation in the jejunum (Zandecki et al. 2008) and enhanced colonic peristalsis and transit (Yoneda et al. 2001). Little is known regarding the involvement of purinergic inhibitory neurotransmission in diabetic gastroenteropathy (Burnstock 2008) owing to the lack of a specific marker for these neurons, and because only recently new pharmacological approaches have been available to separate the purinergic and nitrergic components (Grasa et al. 2009).
We can conclude that this model is a potential useful tool to study gastroenteropathy in type 1 DM and its pathogenesis. STZ-treated RIP-I/hIFNβ diabetic mice defecate frequently and show enhanced (but otherwise normal) GI transit. Gut dysmotility appears related to intestinal remodelling, myenteric neuropathy and impaired myenteric neurotransmission. Whereas some of these abnormalities reflect direct pathological effects of the disease, others reflect compensatory adaptive changes in an attempt to keep GI motility as unaffected as possible and, thus, allow the mice to survive to DM-induced injury. This model provides further evidence of the complexity of changes that occur in the GI tract in DM and that each GI region may respond differently to the effects of the disease. In fact, it is this heterogeneity of DM-associated changes that may explain the variability of GI clinical manifestations in humans and the difficulty in translating insights derived from animal models to human DM.
Acknowledgments
We are grateful to H.B. Mikkelsen, E. Fernández, D. Gallego, E. Albertí, M. Aulí, A. Salavert and E. Vidal for their technical support regarding whole-mount preparations, muscle bath and editing of the document. We also thank Prof. Michael Schemann (Technische Universität München) for the generous gift of the ChAT antibody. This work was financially supported by Ministerio de Educación (FPU grant to A. Domènech) and Ministerio de Ciencia y Tecnología (National Project grant SAF2003-05830).
Disclosure of interest
The authors confirm that there are no conflicts of interest.
References
- Anitha M, Gondha C, Sutliff R, et al. GDNF rescues hyperglycemia-induced diabetic enteric neuropathy through activation of the PI3K/Akt pathway. J. Clin. Invest. 2006;116:344–356. doi: 10.1172/JCI26295. [DOI] [PMC free article] [PubMed] [Google Scholar]
- Anjaneyulu M, Ramarao P. Studies on gastrointestinal tract functional changes in diabetic animals. Methods Find. Exp. Clin. Pharmacol. 2002;24:71–75. doi: 10.1358/mf.2002.24.2.677129. [DOI] [PubMed] [Google Scholar]
- Belai A, Burnstock G. Changes in adrenergic and peptidergic nerves in the submucous plexus of streptozocin-diabetic rat ileum. Gastroenterology. 1990;98:1427–1436. doi: 10.1016/0016-5085(90)91072-e. [DOI] [PubMed] [Google Scholar]
- Belai A, Lincoln J, Milner P, Crowe R, Loesch A, Burnstock G. Enteric nerves in diabetic rats: increase in vasoactive intestinal polypeptide but not substance P. Gastroenterology. 1985;89:967–976. doi: 10.1016/0016-5085(85)90195-7. [DOI] [PubMed] [Google Scholar]
- Belai A, Calcutt NA, Carrington AL, Diemel LT, Tomlinson DR, Burnstock G. Enteric neuropeptides in streptozotocin-diabetic rats; effects of insulin and aldose reductase inhibition. J. Auton. Nerv. Syst. 1996;58:163–169. doi: 10.1016/0165-1838(95)00129-8. [DOI] [PubMed] [Google Scholar]
- Burnstock G. The journey to establish purinergic signalling in the gut. Neurogastroenterol. Motil. 2008;20:8–19. doi: 10.1111/j.1365-2982.2008.01107.x. [DOI] [PubMed] [Google Scholar]
- Bytzer P, Talley NJ, Leemon M, Young LJ, Jones MP, Horowitz M. Prevalence of gastrointestinal symptoms associated with diabetes mellitus: a population-based survey of 15,000 adults. Arch. Intern. Med. 2001;161:1989–1996. doi: 10.1001/archinte.161.16.1989. [DOI] [PubMed] [Google Scholar]
- Casellas A, Salavert A, Agudo J, et al. Expression of IGF-I in pancreatic islets prevents lymphocytic infiltration and protects mice from type 1 diabetes. Diabetes. 2006;55:3246–3255. doi: 10.2337/db06-0328. [DOI] [PubMed] [Google Scholar]
- Diani AR, Gerritsen GC, Stromsta S, Murray P. A study of the morphological changes in the small intestine of the spontaneously diabetic Chinese hamster. Diabetologia. 1976;12:101–109. doi: 10.1007/BF00428973. [DOI] [PubMed] [Google Scholar]
- Ettarh RR, Carr KE. A morphological study of the enteric mucosal epithelium in the streptozotocin-diabetic mouse. Life Sci. 1997;61:1851–1858. doi: 10.1016/s0024-3205(97)00809-6. [DOI] [PubMed] [Google Scholar]
- Forrest A, Parsons M. The enhanced spontaneous activity of the diabetic colon is not the consequence of impaired inhibitory control mechanisms. Auton. Autacoid Pharmacol. 2003;23:149–158. doi: 10.1046/j.1474-8673.2003.00290.x. [DOI] [PubMed] [Google Scholar]
- Fregonesi CE, Miranda-Neto MH, Molinari SL, Zanoni JN. Quantitative study of the myenteric plexus of the stomach of rats with streptozotocin-induced diabetes. Arq. Neuropsiquiatr. 2001;59:50–53. doi: 10.1590/s0004-282x2001000100011. [DOI] [PubMed] [Google Scholar]
- Furlan MM, Molinari SL, Miranda Neto MH. Morphoquantitative effects of acute diabetes on the myenteric neurons of the proximal colon of adult rats. Arq. Neuropsiquiatr. 2002;60:576–581. doi: 10.1590/s0004-282x2002000400012. [DOI] [PubMed] [Google Scholar]
- Gallego D, Gil V, Aleu J, Aulí M, Clavé P, Jiménez M. Purinergic and nitrergic junction potential in the human colon. Am. J. Physiol. Gastrointest. Liver Physiol. 2008;295:G522–G533. doi: 10.1152/ajpgi.00510.2007. [DOI] [PubMed] [Google Scholar]
- Gallego D, Gil V, Aleu J, Martínez-Cutillas M, Clavé P, Jiménez M. Pharmacological characterization of purinergic inhibitory neuromuscular transmission in the human colon. Neurogastroenterol. Motil. 2011;23:792–e338. doi: 10.1111/j.1365-2982.2011.01725.x. [DOI] [PubMed] [Google Scholar]
- Grasa L, Gil V, Gallego D, Martín MT, Jiménez M. P2Y(1) receptors mediate inhibitory neuromuscular transmission in the rat colon. Br. J. Pharmacol. 2009;158:1641–1652. doi: 10.1111/j.1476-5381.2009.00454.x. [DOI] [PMC free article] [PubMed] [Google Scholar]
- Guo C, Quobatari A, Shangguan Y, Hong S, Wiley JW. Diabetic autonomic neuropathy: evidence for apoptosis in situ in the rat. Neurogastroenterol. Motil. 2004;16:335–345. doi: 10.1111/j.1365-2982.2004.00524.x. [DOI] [PubMed] [Google Scholar]
- He CL, Soffer EE, Ferris CD, Walsh RM, Szurszewski JH, Farrugia G. Loss of interstitial cells of cajal and inhibitory innervation in insulin-dependent diabetes. Gastroenterology. 2001;121:427–434. doi: 10.1053/gast.2001.26264. [DOI] [PubMed] [Google Scholar]
- Horvath VJ, Vittal H, Ordog T. Reduced insulin and IGF-I signaling, not hyperglycemia, underlies the diabetes-associated depletion of interstitial cells of Cajal in the murine stomach. Diabetes. 2005;54:1528–1533. doi: 10.2337/diabetes.54.5.1528. [DOI] [PubMed] [Google Scholar]
- Imaeda K, Takano H, Koshita M, Yamamoto Y, Joh T, Suzuki H. Electrical properties of colonic smooth muscle in spontaneously non-insulin-dependent diabetic rats. J. Smooth Muscle Res. 1998;34:1–11. doi: 10.1540/jsmr.34.1. [DOI] [PubMed] [Google Scholar]
- Jung HK, Kim DY, Moon IH, Hong YS. Colonic transit time in diabetic patients--comparison with healthy subjects and the effect of autonomic neuropathy. Yonsei Med. J. 2003;44:265–272. doi: 10.3349/ymj.2003.44.2.265. [DOI] [PubMed] [Google Scholar]
- LePard KJ. Choline acetyltransferase and inducible nitric oxide synthase are increased in myenteric plexus of diabetic guinea pig. Auton. Neurosci. 2005;118:12–24. doi: 10.1016/j.autneu.2004.12.002. [DOI] [PubMed] [Google Scholar]
- Lin LXL, Zhang W, Ge YB, et al. Roles of stem cell factor on the depletion of interstitial cells of Cajal in the colon of diabetic mice. Am. J. Physiol. Gastrointest. Liver Physiol. 2010;298:G241–G247. doi: 10.1152/ajpgi.90706.2008. [DOI] [PubMed] [Google Scholar]
- Lincoln J, Bokor JT, Crowe R, Griffith SG, Haven AJ, Burnstock G. Myenteric plexus in streptozotocin-treated rats. Neurochemical and histochemical evidence for diabetic neuropathy in the gut. Gastroenterology. 1984;86:654–661. [PubMed] [Google Scholar]
- Liu W, Yue W, Wu R. Effects of diabetes on expression of glial fibrillary acidic protein and neurotrophins in rat colon. Auton. Neurosci. 2010;154:79–83. doi: 10.1016/j.autneu.2009.12.003. [DOI] [PubMed] [Google Scholar]
- Ma J, Rayner CK, Jones KL, Horowitz M. Diabetic gastroparesis: diagnosis and management. Drugs. 2009;69:971–986. doi: 10.2165/00003495-200969080-00003. [DOI] [PubMed] [Google Scholar]
- Martín MT, Azpiroz F, Malagelada JR. Ileal brake failure in streptozotocin-induced diabetic rat. Scand. J. Gastroenterol. 2004;39:423–427. doi: 10.1080/00365520310008700. [DOI] [PubMed] [Google Scholar]
- Mayhew TM, Carson FL. Mechanisms of adaptation in rat small intestine: regional differences in quantitative morphology during normal growth and experimental hypertrophy. J. Anat. 1989;164:189–200. [PMC free article] [PubMed] [Google Scholar]
- Nakahara M, Isozaki K, Hirota S, et al. Deficiency of KIT-positive cells in the colon of patients with diabetes mellitus. J. Gastroenterol. Hepatol. 2002;17:666–670. doi: 10.1046/j.1440-1746.2002.02756.x. [DOI] [PubMed] [Google Scholar]
- Nowak TV, Harrington B, Weisbruch JP, Kalbfleisch JH. Structural and functional characteristics of muscle from diabetic rodent small intestine. Am. J. Physiol. 1990;258:G690–G698. doi: 10.1152/ajpgi.1990.258.5.G690. [DOI] [PubMed] [Google Scholar]
- Ördog T. Interstitial cells of Cajal in diabetic gastroenteropathy. Neurogastroenterol. Motil. 2008;20:8–18. doi: 10.1111/j.1365-2982.2007.01056.x. [DOI] [PubMed] [Google Scholar]
- Ördog T, Irwin N, Takayama I, Ward SM, Sanders K M. Depletion of interstitial cells of Cajal and electrical abnormalities in a murine model of diabetic colon dysfunction. Neurogastroenterol. Motil. 2004;16:664. [Google Scholar]
- Pelegrin M, Devedjian JC, Costa C, et al. Evidence from transgenic mice that interferon-beta may be involved in the onset of diabetes mellitus. J. Biol. Chem. 1998;273:12332–12340. doi: 10.1074/jbc.273.20.12332. [DOI] [PubMed] [Google Scholar]
- Pereira R, de Miranda-Neto M, da Silva Souza I, Zanoni J. Vitamin E supplementation in rats with experimental diabetes mellitus: analysis of myosin-V and nNOS immunoreactive myenteric neurons from terminal ileum. J. Mol. Histol. 2008;39:595–603. doi: 10.1007/s10735-008-9200-3. [DOI] [PubMed] [Google Scholar]
- Phillips WT, Schwartz JG, McMahan CA. Rapid gastric emptying of an oral glucose solution in type 2 diabetic patients. J. Nucl. Med. 1992;33:1496–1500. [PubMed] [Google Scholar]
- Taché Y, Maeda-Hagiwara M, Turkelson CM. Central nervous system action of corticotropin-releasing factor to inhibit gastric emptying in rats. Am. J. Physiol. 1987;253:G241–G245. doi: 10.1152/ajpgi.1987.253.2.G241. [DOI] [PubMed] [Google Scholar]
- Yamada K, Hosokawa M, Fujimoto S, et al. The spontaneously diabetic Torii rat with gastroenteropathy. Diabetes Res. Clin. Pract. 2007;75:127–134. doi: 10.1016/j.diabres.2006.06.034. [DOI] [PubMed] [Google Scholar]
- Yamamoto T, Watabe K, Nakahara M, et al. Disturbed gastrointestinal motility and decreased interstitial cells of Cajal in diabetic db/db mice. J. Gastroenterol. Hepatol. 2008;23:660–667. doi: 10.1111/j.1440-1746.2008.05326.x. [DOI] [PubMed] [Google Scholar]
- Yoneda S, Kadowaki M, Kuramoto H, Fukui H, Takaki M. Enhanced colonic peristalsis by impairment of nitrergic enteric neurons in spontaneously diabetic rats. Auton. Neurosci. 2001;92:65–71. doi: 10.1016/S1566-0702(01)00317-4. [DOI] [PubMed] [Google Scholar]
- Zandecki M, Vanden Berghe P, Depoortere I, et al. Characterization of myenteric neuropathy in the jejunum of spontaneously diabetic BB-rats. Neurogastroenterol. Motil. 2008;20:818–828. doi: 10.1111/j.1365-2982.2008.01091.x. [DOI] [PubMed] [Google Scholar]
- Zhao J, Frøkjaer JB, Drewes AM, Ejskjaer N. Upper gastrointestinal sensory-motor dysfunction in diabetes mellitus. World J. Gastroenterol. 2006;12:2846–2857. doi: 10.3748/wjg.v12.i18.2846. [DOI] [PMC free article] [PubMed] [Google Scholar]
- Zhao J, Nakaguchi T, Gregersen H. Biomechanical and histomorphometric colon remodelling in STZ-induced diabetic rats. Dig. Dis. Sci. 2009;54:1636–1642. doi: 10.1007/s10620-008-0540-3. [DOI] [PubMed] [Google Scholar]