

Abstract
Development of high-risk combinations of multiple islet autoantibodies and type 1 diabetes is associated with high-affinity insulin autoantibodies (IAA), but IAA affinity measurements require large serum volumes. We therefore investigated whether a simplified method of IAA affinity measurement using a low concentration of unlabelled insulin (ULI) competitor discriminated between moderate–high- and low-affinity IAA and identified individuals at highest risk of disease. Samples were assayed by radiobinding microassay using high (4·0 × 10−5 mol/l) and low (7 × 10⁻⁹ mol/l) ULI concentrations for competitive displacement in three cohorts of IAA-positive individuals; (1) 68 patients with newly-diagnosed type 1 diabetes; (2) 40 healthy schoolchildren; and (3) 114 relatives of patients with type 1 diabetes followed prospectively for disease development (median follow-up 13 years). IAA results obtained with low ULI were expressed as a percentage of those obtained with high ULI and this was used to classify samples as low or moderate–high affinity (0–50% and >50%, respectively). Sixty-eight patient samples were positive with high and 67 (99%) with low ULI. Forty schoolchildren were IAA-positive with high and 22 (55%) with low ULI (P < 0·001). Of the relatives, 113 were positive with high and 83 (73%) with low ULI (P < 0·001). In relatives, moderate–high affinity IAA were associated with multiple islet antibodies (P < 0·001) and greater diabetes risk than low affinity IAA (P < 0·001). A single low concentration of ULI competitor can act as a surrogate for complex IAA affinity measurements and identifies those IAA-positive relatives at highest risk of disease progression.
Keywords: affinity, insulin autoantibodies, prediction, progression
Introduction
Insulin autoantibodies (IAA) predict the onset of type 1 diabetes mellitus [1] and are usually the first islet autoantibodies detected in young children [2]. Radiobinding assays using 125I-labelled insulin detect IAAs that are associated more closely with disease than those measured by enzyme-linked immunosorbent assay (ELISA) [3]. There have been considerable improvements to the IAA radiobinding assay since its inception [4], notably the microassay which uses protein A sepharose (PAS) [5] or protein G sepharose (PGS) [6] to isolate immunocomplexes. However, despite competitive displacement with excess unlabelled insulin to demonstrate specificity and assay modifications that minimize non-specific binding [7–9], a large proportion of IAA-positive individuals do not progress to type 1 diabetes [10].
The development of high-risk combinations of multiple islet autoantibodies and type 1 diabetes is associated with high-affinity IAA in both first-degree relatives and children from the general population, and discrimination between high- and low-affinity IAA improves assay specificity and identifies those individuals at highest risk [11,12]. Affinity measurements with binding displacement curves, however, require large volumes of serum and use of a single insulin concentration that could discriminate between high- and low-affinity antibodies is highly desirable [13,14].
We have therefore investigated whether using a single low concentration of cold insulin competitor could further improve the disease specificity of the IAA assay without reducing disease sensitivity in well-characterized cohorts of healthy schoolchildren, patients with newly diagnosed type 1 diabetes and relatives of patients with type 1 diabetes who have been followed prospectively for disease development.
Materials and methods
Subjects and samples
The following IAA-positive samples were tested by competitive displacement with two concentrations of ULI to distinguish moderate–high-affinity and low-affinity IAA.
Patients with newly diagnosed type 1 diabetes
Sera from 68 patients (median age, 8·7 years; range, 1·3–16·6 years) with newly diagnosed type 1 diabetes found IAA-positive after competitive displacement with high ULI [9]. These sera were collected within 2 weeks of diagnosis (median 0 days, range −9 to 10 days).
Schoolchildren
Sera from 40 of 2860 healthy schoolchildren [15] found IAA-positive following competitive displacement with high ULI [9] (median age, 11·9 years; range, 9·3 to 13·6 years). Follow-up data on these children were not available.
Relatives of patients with type 1 diabetes
The final cohort comprised 114 first-degree relatives of patients with type 1 diabetes found previously to be IAA-positive after competitive displacement with high ULI following screening of 3594 participants in the Bart's–Oxford (BOX) Family Study [10], and followed prospectively for disease development (median follow-up to last contact or diabetes diagnosis, 13·0 years; range 0·5–25·0 years; median age, 23·2 years; range 2·1–58·6 years).
The study was approved by Local Research Ethics Committees and informed consent obtained from all participating subjects.
IAA assays
IAA were measured in 5 µl serum in duplicate using a radiobinding microassay [5] with A14-125I-labelled human insulin (Perkin-Elmer LAS, Beaconsfield, Bucks, UK), with or without unlabelled human insulin at both high (4·0 × 10−5 mol/l) and low (7 × 10⁻⁹ mol/l) concentrations (Actrapid, Novo Nordisk, Bagsvegaerd, Denmark). A total of 15 000 counts per minute (cpm) (1·1 × 10−10 mol/l) of labelled insulin was added to each well. Label was used within 2 weeks of the activity date. The 50 mmol/l Tris, 1% Tween-20, pH 8·0 (TBT) incubation buffer contained 1% bovine serum albumin (BSA) (Sigma, Poole, Dorset, UK) to reduce non-specific binding [9]. Immune complexes were precipitated with PAS (GE Healthcare, Little Chalfont, Bucks, UK). Bound 125I-labelled insulin was measured using a gamma counter (Perkin Elmer LAS). Results were calculated using a standard curve derived from dilutions of an insulin antibody-positive sample in normal human serum. Samples with IAA ≥0·2 units after competition were classified as positive [15]. The interassay coefficient of variation (CV) was 22% at 0·6 units and 18% at 1·9 units. The assay achieved a laboratory defined sensitivity of 40% at a specificity of 100% in the 2010 Diabetes Autoantibody Standardization Program.
Affinity stratification
To discriminate between high- and low-affinity IAA, two independent strategies were adopted. (1) Samples were assayed at high and low ULI and those samples only positive at high ULI were considered to represent low-affinity IAA, while those positive at low ULI were considered to represent high-affinity IAA. (2) Those samples found IAA-positive at the high ULI concentration were classified as of either low- or moderate–high-affinity by expressing results obtained with low ULI as a percentage of the results obtained with high ULI. One sample from a relative positive only at low ULI was excluded from this analysis. To assign a threshold percentage that discriminated between these affinity classifications, IAA displacement curves were determined in 60 selected IAA positive samples (from 15 patients with newly diagnosed type 1 diabetes, 12 schoolchildren and 33 relatives) by competitive displacement using increasing quantities of unlabelled human insulin as described previously [14] (5·5 × 10−11, 2·2 × 10−10, 1·7 × 10−9, 7 × 10⁻⁹, 2·8 × 10−8 and 2·8 × 10−7 mol/l), with the inclusion of the concentration of ULI used routinely in our laboratory for complete inhibition (4·0 × 10−5 mol/l). These samples were selected to cover the range of values obtained after displacement at high and low insulin concentrations.
Data analysis
Categorical variables were compared using the χ2 test. McNemar's test was used to compare differences in the frequency of IAA ≥0·2 units at high and low ULI. IAA values in the different affinity classes were compared using the Wilcoxon rank sum test. Survival analysis was carried out using Kaplan–Meier methods and log-rank testing (Mantel–Cox) used to compare survival between groups. IAA affinity was expressed as reciprocal Kd values (l/mol) calculated with non-linear regression analysis using GraphPad Prism5 (GraphPad Software, Inc., San Diego, CA, USA). Displacement curves were computed directly from the cpm for each competition reaction. For all analyses, a two-tailed P-value of 0·05 was considered significant. Statistical analyses were performed using the Statistics Package for Social Sciences Version 16 (SPSS, Inc., Chicago, IL, USA).
Results
Positivity at high and low ULI concentrations
Initial results showed that the sensitivity of IAA was maintained in patients and specificity improved in a low-risk population (healthy schoolchildren) following competitive displacement with the low concentration of ULI. Of 68 samples from patients with newly diagnosed type 1 diabetes that were IAA-positive (≥0·2 units) with the high concentration of ULI, 67 (99%) were also positive with the low concentration of ULI. In contrast, of the 40 schoolchild samples positive following competition with the high concentration of ULI, only 22 (55%) were positive with the low concentration of ULI (P < 0·001). This included five of the eight (62·5%) schoolchild samples with co-existing antibodies to glutamic acid decarboxylase (GADA) and/or islet antigen-2 (IA-2A).
A higher proportion of relatives found positive for IAA after displacement with the low concentration of ULI had high-risk combinations of multiple antibodies than those positive after displacement with the usual high concentration of ULI. Of the 114 samples from relatives previously found IAA-positive, 83 (73%) were IAA-positive following reassay with the low concentration of ULI, and 49 (59%) of these had GADA and or IA-2A. In comparison, 113 (99%) of these samples were positive following reassay with the high concentration of ULI (P < 0·001), and 52 (46%) of these had GADA and or IA-2A (P < 0·001; Table 1). Furthermore, life-table analysis showed that relatives who were IAA-positive with the low concentration of ULI were at significantly higher risk of progression to diabetes than those only positive with the high concentration of ULI (P = 0·003; Fig. 1A).
Table 1.
Characteristics of samples from patients with type 1 diabetes, healthy schoolchildren and relatives of patients with type 1 diabetes with (1) insulin autoantibodies (IAA) classified as low or moderate–high-affinity following competitive displacement with high and low unlabelled insulin (ULI) or (2) IAA units below or above the IAA threshold (0·2 units) following competitive displacement with low ULI
| IAA-affinity classification | IAA units with low ULI | |||
|---|---|---|---|---|
| Low | Moderate–high | <0·2 | ≥0·2 | |
| Patients | 1(1) | 67(99) | 1(1) | 67(99) |
| Schoolchildren | 26(65) | 14(35) | 18(45) | 22(55) |
| With GADA and/or IA–2A | 4(15) | 4(29) | 3(17) | 5(23) |
| Relatives | 39(35) | 74(65) | 31(27) | 83(73) |
| With GADA and/or IA–2A | 6(15) | 46(62)* | 4(13) | 49(59)* |
| Developed diabetes | 3(8) | 30(41)* | 3(10) | 31(37)* |
P < 0·001 for comparisons within categories. GADA, glutamic acid decarboxylase autoantibodies. IA-2A, islet antigen-2 autoantibodies.
Fig. 1.
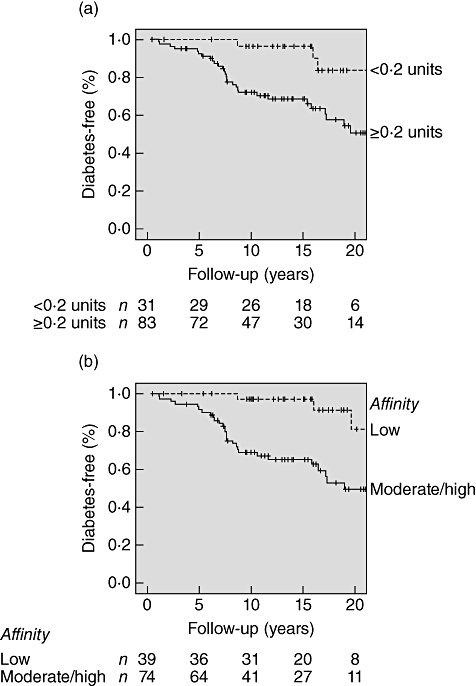
Kaplan–Meier survival analysis; progression to diabetes in relatives of patients with type 1 diabetes previously found insulin autoantibody (IAA)-positive according to (a) IAA positivity (≥0·2 units) with the low concentration of ULI (P = 0·003) and (b) IAA affinity classification (P < 0·001). The number of diabetes-free relatives remaining at each time-point is given below the axes.
Affinity measurements using competitive binding curves
To assign thresholds for classifying samples as of either high–moderate- or low-affinity IAA, affinities were calculated for the 60 selected IAA-positive samples by competitive displacement with seven concentrations of unlabelled human insulin (Fig. 2). Six samples that gave curve fits with an R2 value below 0·81, one that gave an ambiguous fit and four that did not converge were excluded from the analysis. One patient sample which fitted a two-site binding model with high (>1 × 10¹⁰ l/mol) and low (6·6 × 106 l/mol) affinity was also excluded. Of 48 samples included in the analysis, IAA affinities ranged between 4·42 × 104 and 1·09 × 1010 l/mol for 10 schoolchild samples, 2·0 × 109 and 2·9 × 1010 l/mol for 13 patient samples and 2·71 × 106 and 9·51 × 109 l/mol for the 25 samples from relatives. These competitive binding curves showed an association between affinity measurements and IAA results obtained following displacement with low ULI expressed as a percentage of those obtained with high ULI (Fig. 3). No samples for which this percentage was 50% or below had an IAA affinity >1 × 10⁸ l/mol, and therefore this threshold was used to classify all study samples as either of moderate–high (>50%) or of low (0–50%) affinity. Good discrimination between samples classified as moderate–high (median affinity, 4·08 × 109 l/mol; range 7·59 × 107 to 2·86 × 1010 l/mol) or low (median affinity, 1·22 × 107 l/mol; range 4·42 × 104 to 7·56 × 107 l/mol) affinity was achieved at this threshold.
Fig. 2.
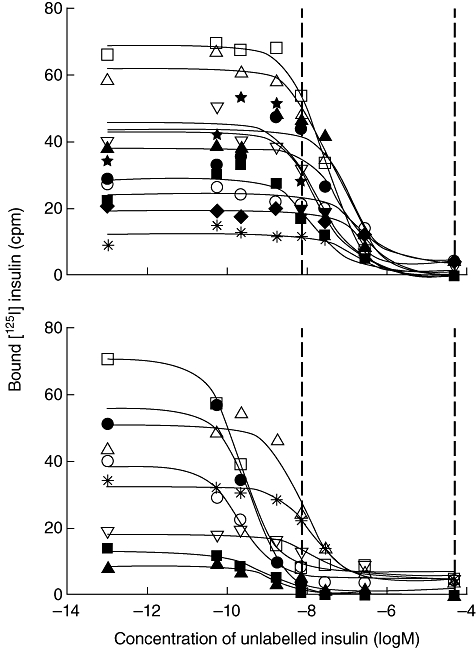
Displacement curves for selected insulin autoantibody (IAA)-positive samples from relatives of patients with type 1 diabetes following competitive displacement with seven different concentrations of unlabelled insulin (ULI). Only the 20 samples with binding below 80 counts per minute (cpm) that also gave curve fits with an R2 >0·81 are shown. In each plot the points used to generate the curve are represented by different symbols for each sample. Samples were classified according to the IAA result obtained at low ULI expressed as a percentage of the result at high ULI; (upper panel) low (0–50%)-affinity and (lower panel) moderate–high (>50%)-affinity. This classification gave good agreement with calculated affinity values for these samples; low (median 1·12 × 107 l/mol, range 3·0 × 106 to 7·56 × 107 l/mol) and moderate–high (median 1·2 × 109 l/mol, range 7·59 × 107 to 9·51 × 109 l/mol). Curves are fitted using non-linear regression (Prism). The dashed lines represent the low and high concentrations of ULI used to displace all samples in this study. Binding in absence of unlabelled insulin was assigned an ULI concentration of 1 × 10⁻¹³ mol/l.
Fig. 3.
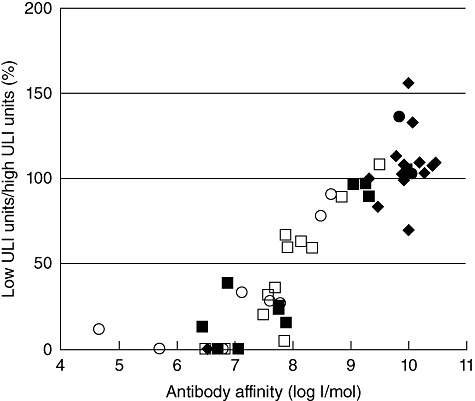
Insulin autoantibody (IAA) results obtained with low unlabelled insulin (ULI) expressed as a percentage of the units obtained with high ULI are plotted against affinity values calculated from displacement curves for selected samples from schoolchildren (circles), patients (diamonds) and relatives (squares) on which affinity measurements were available. Subjects with additional islet antibodies, with diabetes or who progressed to diabetes are indicated by the filled markers. All samples with low ULI units/high ULI units below 50% had an IAA affinity below 1 × 10⁸ l/mol.
Discrimination using affinity classification
Using the threshold derived from affinity measurements to classify all samples as of either moderate–high or low affinity following displacement with just two insulin concentrations, moderate–high-affinity IAA showed a strong disease association. Of the patient samples, 67 (99%) were classified as of moderate–high affinity compared with only 14 (35%) of the schoolchild samples. Of the 113 IAA-positive samples from relatives, 74 (65%) were classified as of moderate–high-affinity and 39 (35%) as of low affinity. In relatives, moderate–high-affinity IAA were associated with the presence of multiple islet autoantibodies; 46 (62%) of those samples classified as of moderate–high affinity had GAD and or IA-2 antibodies compared with only six (15%) of those of low affinity (P < 0·001; Table 1). Affinity classification also helped to discriminate risk of progression; IAA-positive relatives who had moderate–high-affinity IAA were at significantly higher risk of progression to diabetes within 20 years than those with low-affinity IAA (P < 0·001; Fig. 1b). This discrimination between moderate-high and low affinity was not related to titre, as the median IAA values of samples in the different affinity classes were similar following competition at high ULI; 0·80 units for the moderate–high- (range 0·23–99·7 units) and 0·82 units for the low- (range 0·22–191 units) affinity groups (P = 0·749).
Discussion
We have demonstrated in three well-characterized study cohorts that the use of a single low concentration of cold insulin can be used as a surrogate for IAA affinity measurements. All but one of the patient samples were IAA-positive following displacement with the low ULI concentration, while almost half of the healthy schoolchildren found positive following competition with high ULI were negative with low ULI. Nearly all the IAA-positive patients had high-affinity IAA, but affinity varied considerably among schoolchildren and relatives of patients with type 1 diabetes. Moderate–high-affinity IAA were most frequent in relatives of patients with type 1 diabetes who had multiple islet autoantibodies and those who progressed to type 1 diabetes. Conversely, single autoantibody-positive relatives usually had low-affinity IAA and did not progress to type 1 diabetes.
The single low concentration of unlabelled human insulin we used was the same as that established by Achenbach et al. [14]. This concentration provided good discrimination between high and low IAA affinity (Fig. 3) that was largely independent of IAA titre; IAA values with low ULI were less than 80% of those with high ULI in only 4·4% of patient samples. That the same low ULI concentration was effective at discriminating affinity in two different laboratories suggests that this approach should be widely applicable. Our assignment of the threshold percentage to classify low and moderate–high affinities (0–50% and >50%, respectively) were similar to those based on bound cpm [14]. Better discrimination of risk of progression could be achieved by setting this threshold higher, although that would risk losing sensitivity. Furthermore, we achieved similar discrimination of progression in relatives without reference to the result obtained at high ULI, either by comparing results with and without low ULI or by using the potentially more pragmatic criterion of positivity at low ULI concentration (Fig. 1a).
The reduction in non-specific binding achieved by the addition of BSA has recently led us to question the need for competitive displacement with high concentrations of ULI [9]. However, displacement with low ULI appears potentially useful in increasing prognostic information in the general population and identifying those relatives at highest risk of progression to type 1 diabetes. Competitive displacement with low ULI almost halved the number of schoolchildren identified as IAA-positive after displacement with high ULI, while only one patient became IAA-negative. To achieve a similar increase in specificity by simply raising the IAA threshold from the 98·6th (0·2 units) to the 99·2nd (1·0 units) percentile of the schoolchildren would cause sensitivity in patients to fall from 68% to 53%.
Our finding that IAA affinity could discriminate risk of progression in IAA-positive relatives is in agreement with other studies in relatives and schoolchildren [11,12], although this was not observed in the Diabetes Prediction and Prevention Project (DIPP) study [16]. We were unable to analyse IAA affinity in relation to diabetes progression in our schoolchild cohort because we do not have follow-up data. The lack of association between IAA affinity and multiple islet autoantibodies in our schoolchildren may well be the result of small numbers.
The importance of affinity measurements is not limited to IAA. In children with a first-degree relative with type 1 diabetes, high-affinity GADA have been associated with multiple islet autoantibodies or diabetes [17]. Hence, in those cohorts in which autoantibody affinity is associated with progression, affinity measurement using a single concentration of unlabelled antigen may prove an effective means by which the predictive value of other islet autoantibodies can be improved, without the need for complex displacement analysis.
Insulin autoantibody measurement remains a vital tool for characterizing and predicting type 1 diabetes in children, but the disease specificity of IAA could be improved by affinity measurement. Thus, to optimize prediction, routine competitive displacement in the IAA radiobinding assay should be performed using a single low concentration of unlabelled insulin.
Acknowledgments
This work was funded by Diabetes UK. We are indebted to the participants in the Bart's–Oxford Family Study and schoolchildren from the Oxford region for their support.
Disclosure
The authors declare that there is no conflict of interest.
References
- 1.Srikanta S, Ricker AT, McCulloch DK, Soeldner JS, Eisenbarth GS, Palmer JP. Autoimmunity to insulin, beta cell dysfunction, and development of insulin-dependent diabetes mellitus. Diabetes. 1986;35:139–42. doi: 10.2337/diab.35.2.139. [DOI] [PubMed] [Google Scholar]
- 2.Ziegler AG, Hummel M, Schenker M, Bonifacio E. Autoantibody appearance and risk for development of childhood diabetes in offspring of parents with type 1 diabetes: the 2-year analysis of the German BABYDIAB Study. Diabetes. 1999;48:460–8. doi: 10.2337/diabetes.48.3.460. [DOI] [PubMed] [Google Scholar]
- 3.Greenbaum CJ, Palmer JP, Kuglin B, Kolb H. Insulin autoantibodies measured by radioimmunoassay methodology are more related to insulin-dependent diabetes mellitus than those measured by enzyme-linked immunosorbent assay: results of the Fourth International Workshop on the Standardization of Insulin Autoantibody Measurement. J Clin Endocrinol Metab. 1992;74:1040–4. doi: 10.1210/jcem.74.5.1569152. [DOI] [PubMed] [Google Scholar]
- 4.Palmer JP, Asplin CM, Clemons P, et al. Insulin antibodies in insulin-dependent diabetics before insulin treatment. Science. 1983;222:1337–9. doi: 10.1126/science.6362005. [DOI] [PubMed] [Google Scholar]
- 5.Williams AJ, Bingley PJ, Bonifacio E, Palmer JP, Gale EA. A novel micro-assay for insulin autoantibodies. J Autoimmun. 1997;10:473–8. doi: 10.1006/jaut.1997.0154. [DOI] [PubMed] [Google Scholar]
- 6.Naserke HE, Dozio N, Ziegler AG, Bonifacio E. Comparison of a novel micro-assay for insulin autoantibodies with the conventional radiobinding assay. Diabetologia. 1998;41:681–3. doi: 10.1007/s001250050968. [DOI] [PubMed] [Google Scholar]
- 7.Williams AJ, Norcross AJ, Chandler KA, Bingley PJ. Non-specific binding to protein A Sepharose and protein G Sepharose in insulin autoantibody assays may be reduced by pre-treatment with glycine or ethanolamine. J Immunol Methods. 2006;314:170–3. doi: 10.1016/j.jim.2006.06.003. [DOI] [PubMed] [Google Scholar]
- 8.Yu L, Robles DT, Abiru N, et al. Early expression of antiinsulin autoantibodies of humans and the NOD mouse: evidence for early determination of subsequent diabetes. Proc Natl Acad Sci USA. 2000;97:1701–6. doi: 10.1073/pnas.040556697. [DOI] [PMC free article] [PubMed] [Google Scholar]
- 9.Williams AJ, Curnock R, Reed CR, Easton P, Rokni S, Bingley PJ. Anti-BSA antibodies are a major cause of non-specific binding in insulin autoantibody radiobinding assays. J Immunol Methods. 2010;362:199–203. doi: 10.1016/j.jim.2010.09.009. [DOI] [PubMed] [Google Scholar]
- 10.Bingley PJ, Williams AJ, Gale EA. Optimized autoantibody-based risk assessment in family members. Implications for future intervention trials. Diabetes Care. 1999;22:1796–801. doi: 10.2337/diacare.22.11.1796. [DOI] [PubMed] [Google Scholar]
- 11.Achenbach P, Koczwara K, Knopff A, Naserke H, Ziegler AG, Bonifacio E. Mature high-affinity immune responses to (pro)insulin anticipate the autoimmune cascade that leads to type 1 diabetes. J Clin Invest. 2004;114:589–97. doi: 10.1172/JCI21307. [DOI] [PMC free article] [PubMed] [Google Scholar]
- 12.Schlosser M, Koczwara K, Kenk H, et al. In insulin-autoantibody-positive children from the general population, antibody affinity identifies those at high and low risk. Diabetologia. 2005;48:1830–2. doi: 10.1007/s00125-005-1864-6. [DOI] [PubMed] [Google Scholar]
- 13.Achenbach P, Schlosser M, Williams AJ, et al. Combined testing of antibody titer and affinity improves insulin autoantibody measurement: diabetes Antibody Standardization Program. Clin Immunol. 2007;122:85–90. doi: 10.1016/j.clim.2006.09.004. [DOI] [PubMed] [Google Scholar]
- 14.Achenbach P, Guo LH, Gick C, et al. A simplified method to assess affinity of insulin autoantibodies. Clin Immunol. 2010;137:415–21. doi: 10.1016/j.clim.2010.09.002. [DOI] [PubMed] [Google Scholar]
- 15.Bingley PJ, Bonifacio E, Williams AJ, Genovese S, Bottazzo GF, Gale EA. Prediction of IDDM in the general population: strategies based on combinations of autoantibody markers. Diabetes. 1997;46:1701–10. doi: 10.2337/diab.46.11.1701. [DOI] [PubMed] [Google Scholar]
- 16.Siljander H, Harkonen T, Hermann R, et al. Role of insulin autoantibody affinity as a predictive marker for type 1 diabetes in young children with HLA-conferred disease susceptibility. Diabetes Metab Res Rev. 2009;25:615–22. doi: 10.1002/dmrr.998. [DOI] [PubMed] [Google Scholar]
- 17.Mayr A, Schlosser M, Grober N, et al. GAD autoantibody affinity and epitope specificity identify distinct immunization profiles in children at risk for type 1 diabetes. Diabetes. 2007;56:1527–33. doi: 10.2337/db06-1715. [DOI] [PubMed] [Google Scholar]