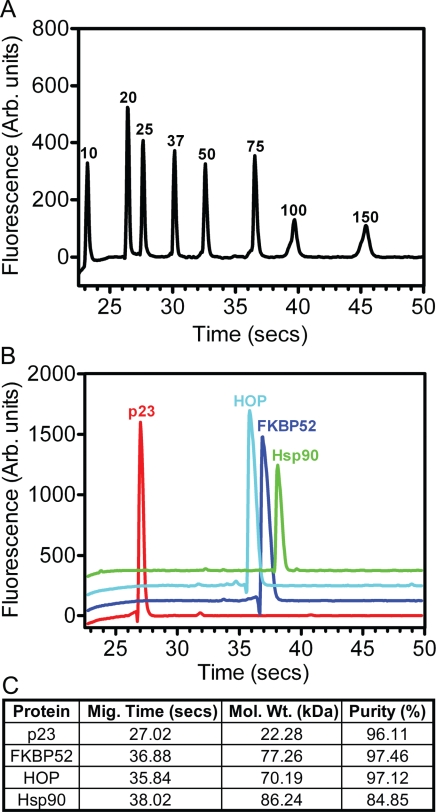
Figure 1. The purification of steroid hormone receptor chaperones and co-chaperones.
(A) A Laser excitation fluorescent detection chromatogram revealed the relative micro-fluidic migration positions of the molecular weight standards (values in kDa) depicted as a function of fluorescence versus time. (B) A similar laser excitation fluorescent detection chromatogram illustrating the migration positions of the p23 (red), FKBP52 (blue), HOP (cyan) and Hsp90 (green) proteins. The respective chromatographic spectra are staggered along the y-axis for purposes of clarity. (C) BIO-RAD Experion™ statistical analysis of the purified p23, FKBP52, HOP and Hsp90 proteins highlighting their respective migration times through the microfluidic channels of the Pro260 chips (seconds), as well as their estimated molecular weights (kDa) and relative degrees of homogeneity (%).

