Abstract
Constitutive activation of NF-κB is a frequent event in human cancers, playing important roles in cancer development and progression. In nontransformed cells, NF-κB activation is tightly controlled by IκBs. IκBs bind NF-κB in the cytoplasm, preventing it from translocating to the nucleus to modulate gene expression. Stimuli that activate NF-κB signaling trigger IκB degradation, enabling nuclear translocation of NF-κB. Among the genes regulated by NF-κB are those encoding the IκBs, providing a negative feedback loop that limits NF-κB activity. How transformed cells override this NF-κB/IκB negative feedback loop remains unclear. Here, we report in human glioma cell lines that microRNA-30e* (miR-30e*) directly targets the IκBα 3ι-UTR and suppresses IκBα expression. Overexpression of miR-30e* in human glioma cell lines led to hyperactivation of NF-κB and enhanced expression of NF-κB–regulated genes, which promoted glioma cell invasiveness in in vitro assays and in an orthotopic xenotransplantation model. These effects of miR-30e* were shown to be clinically relevant, as miR-30e* was found to be upregulated in primary human glioma cells and correlated with malignant progression and poor survival. Hence, miR-30e* provides an epigenetic mechanism that disrupts the NF-κB/IκBα loop and may represent a new therapeutic target and prognostic marker.
Introduction
Since its discovery in 1986 (1), NF-κB has been recognized as one of the most pleiotropic transcription factors and a key player in the regulation of inflammatory and immune responses as well as biological processes central to development of malignancies (2). Deregulated hyperactivation of NF-κB, frequently found in many cancer types, mediates key biological features of cancer by transcriptionally activating various target genes (3–5), and multiple kinase-mediated pathways have been found to trigger NF-κB activation (6–8).
NF-κB activation is tightly controlled by its natural inhibitors, IκBs, which bind and tether NF-κB in the cytoplasm until nuclear translocation is induced by signal-triggered IκB degradation. Previous studies have established that cytoplasmic IκBs can be phosphorylated by their kinases, i.e., IKKs, resulting in ubiquitin-mediated IκB degradation and release of NF-κB from the cytoplasm to the nucleus, where NF-κB activates transcription of its target genes. On the other hand, IκBs are among the genes subject to transcriptional activation by nuclear NF-κB, and their de novo re-synthesis re-shuttles the NF-κB complex back to the cytoplasm, thereby forming a negative feedback loop that maintains NF-κB activity at a well-controlled level so that constitutive NF-κB overactivation is prevented (9–11). Yet it remains puzzling how such a feedback mechanism is disrupted in cancers in which deregulated overactivation of NF-κB is commonly detected as a key component in the development of malignant phenotypes.
Gliomas represent one of the most aggressive and lethal human cancer types, as the cumulative 1-year survival rate remains below 30%, and individuals with grade IV glioblastoma multiforme have a median survival time of only 15 months (12–17). The poor prognosis and high lethality of the disease is largely attributed to the highly invasive/migratory nature of glioma cells, which are capable of diffusely infiltrating and widely migrating in the surrounding brain tissue (14, 18, 19). Furthermore, angiogenesis is clinically and pathologically linked to glioma aggressiveness, and neovascularization essentially supports glioma cell proliferation and spreading (20–24). Increased tumor microvascular density (MVD) has been identified in gliomas as a predictor of shorter patient survival (25, 26). Thus far, the molecular mechanisms mediating glioma invasion and angiogenesis remain incompletely understood.
MicroRNAs (miRNAs), a class of small regulatory RNA molecules, negatively regulate their mRNA targets in a sequence-specific manner. miRNAs have been demonstrated to play important roles in the initiation and progression of human cancers and therefore may represent promising targets for anticancer therapies (27–32). During the miRNA maturation process, two functional complementary short RNA molecules, designated miRNA and miRNA*, are formed (33–36). Here, using the human glioma as a model, we report a miRNA*-mediated mechanism that disrupts the NF-κB/IκB negative feedback loop and results in constitutive activation of NF-κB, leading to the aggressiveness of glioma. We found that miR-30e* directly interacted with the IκBα 3′-UTR, suppressed IκBα expression, and promoted nuclear localization and activation of NF-κB, leading to enhanced invasive and proangiogenic abilities of glioma cells. The clinical relevance of this novel epigenetic mechanism was demonstrated by our finding that miR-30e* was markedly upregulated in clinical gliomas and strongly correlated with the histological staging and survival of glioma patients. Our findings support miR-30e* as a potential new prognostic biomarker and therapeutic target of the disease.
Results
miR-30e* upregulation correlates with progression of human gliomas.
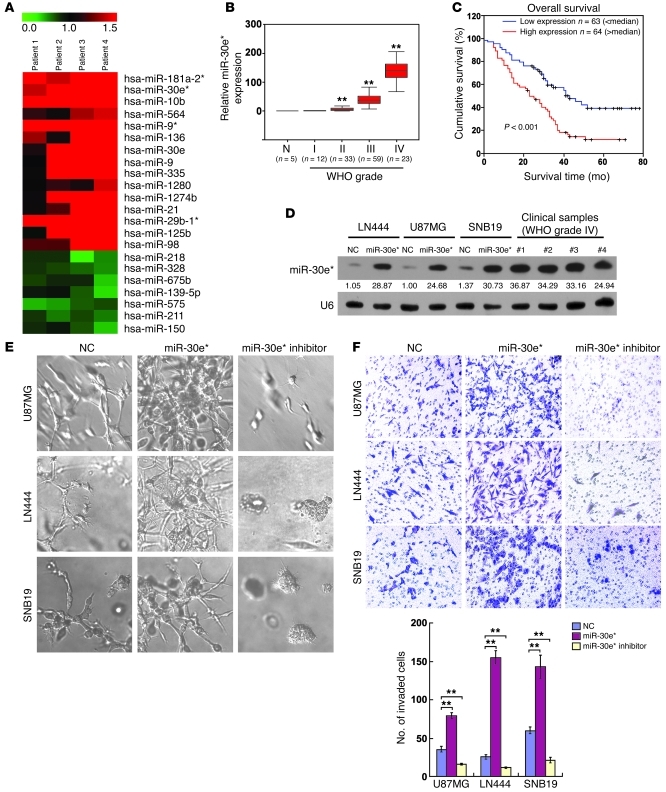
To determine which miRNA species may be involved in promoting the aggressiveness of gliomas mediated through NF-κB signaling, we first compared miRNA expression profiles in cells obtained from matched pairs of glioma and adjacent non-tumor brain tissues from 4 patients. Microarray analysis identified 15 upregulated and 7 downregulated miRNAs from 960 analyzed miRNAs in glioma cells (Figure 1A), including upregulated miR-21, miR-10b, and miR-9/9*, which had been previously found to be associated with glioma invasiveness (37–39). Further real-time PCR analysis of 8 paired glioma and adjacent tissues demonstrated a previously unidentified alteration, namely, the consistent overexpression of miR-30e*, which is produced from the same miRNA precursor and imperfectly complementary to miR-30e. miR-30e* was found to be overexpressed in 10 samples microdissected from regions with glioma cells compared with those derived from the adjacent glial brain tissues and in all 17 tested glioma cell lines compared with primary normal human astrocytes (12) (Supplemental Figure 1, A–C; supplemental material available online with this article; doi: 10.1172/JCI58849DS1).
Figure 1. Upregulation of miR-30e* enhances invasiveness of glioma cells.
(A) miRNA array analysis showed that miRNAs were differentially expressed in GFAP+ cells isolated from clinical glioma and adjacent brain tissues. The pseudocolor represents the intensity scale of tumor versus adjacent brain tissue. (B) Correlation between miR-30e* expression assessed by real-time PCR and WHO grading of glioma and normal brain tissues (N). Transcript levels were normalized by U6 expression. The bounds of boxes represent the lower and upper quartiles; lines within boxes and whiskers denote median and extremum, respectively. (C) Correlation between miR-30e* levels and survival by Kaplan-Meier analysis of patients with high (greater than the median; n = 64) or low miR-30e* (less than the median; n = 63) expression. (D) Northern blot analysis of miR-30e* expression in glioma cells transfected with negative control (NC) and hsa-miR-30e* mimic oligonucleotides, as well as 4 clinical WHO grade IV glioma tissues. The expression levels of miR-30e* in the transfected gliomas cells were within the range of the endogenously expressed miR-30e* levels in human gliomas (see Supplemental Methods). Numbers below the panels are quantifications of the signals obtained, determined by comparing the miR-30e*/U6 ratio in U87MG-NC cells. The miR-30e*/U6 ratio in U87MG-NC cells was set at 1.0. (E) Representative micrographs of indicated cells cultured in a 3D spheroid invasion assay. (F) Representative images and quantification of indicated invaded cells analyzed in a TMPA with Matrigel. Experiments in B–F were repeated at least 3 times, with similar results. **P < 0.01. Original magnification, ×400 (E); ×200 (F).
For evaluation of the clinical relevance of the upregulated miR-30e*, paraffin-embedded specimens of 5 normal brain tissues and 127 archived clinical gliomas classified as grades I–IV according to the WHO definition were microdissected and comparatively examined for miR-30e* expression using real-time PCR and in situ hybridization (Supplemental Table 1). miR-30e* levels remained low in tumors of grades I and II but became markedly higher in those at grade III and further elevated in grade IV tumors (Figure 1B). Moreover, miR-30e* levels also significantly correlated with patient survival (P < 0.001) (Figure 1C, Supplemental Figure 1, G and H, and Supplemental Table 2). High miR-30e* expression was closely associated with shorter overall survival time (P < 0.001) (Supplemental Table 3), which suggests a possible link between high-level miR-30e* expression and progression of human gliomas and highlights the potential value of the molecule as a predictive biomarker for disease outcome.
miR-30e* enhances the invasiveness of glioma cells.
To understand the biological function of miR-30e* in glioma cells, we then transfected glioma cell lines U87MG, LN444, and SNB19 with hsa-miR-30e* mimic oligonucleotides and examined the effect of upregulated miR-30e* on the expression of genes related to cell invasion. Northern blot analysis confirmed that a high level of miR-30e* expression was achieved in transfected cells compared with the negative control–transfected cells. Furthermore, the miR-30e* expression in transfected cells was higher than that in one, but lower than those in three, WHO grade IV glioma samples, indicating that the expression levels of miR-30e* in the experimentally modified glioma cells were within the range of those endogenously expressed in human gliomas (Figure 1D). Subsequent microarray and gene ontology (GO) enrichment analysis showed that genes upregulated in miR-30e*–transfected cells with GO biological process terms “extracellular matrix organization,” “response to wounding,” “immune response,” “inflammatory response,” and “chemotaxis” were enriched; meanwhile, the downregulated genes with GO terms “cell adhesion” and “biological adhesion” were enriched in these cells (at enrichment cutoff P ≤ 0.001; Supplemental Figure 2, A and B), predicting that miR-30e* may be involved in the development of the migration/invasion phenotype of glioma cells.
We next tested the effect of miR-30e* on the migration and invasiveness of all three glioma cell lines. Wound healing and Transwell (without Matrigel) assays demonstrated that ectopic expression of miR-30e* accelerated migration of glioma cells, while inhibiting endogenous miR-30e* using complementary oligonucleotides dramatically slowed down the migration (Supplemental Figure 2, C and D). Strikingly, in a 3D spheroid invasion assay, miR-30e*–transfected glioma cells displayed morphologies typical of highly aggressive/invasive cells, presenting more outward projections compared with the control cells; conversely, suppression of miR-30e* caused the cells to be immotile and to display spheroid morphologies (Figure 1E). The Transwell matrix penetration assay (TMPA) with Matrigel showed that overexpression of miR-30e* increased, while inhibition of miR-30e* reduced, the number of invaded glioma cells (Figure 1F).
MMP-9 mediates miR-30e*–induced glioma invasion.
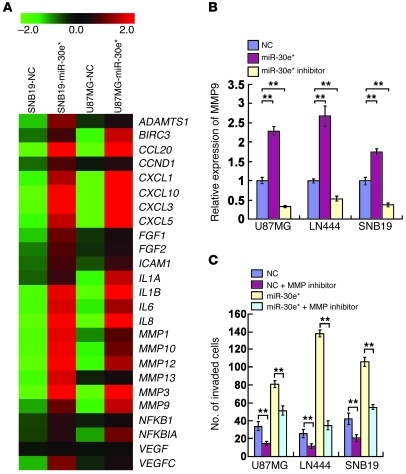
GO enrichment analysis of miR-30e*–regulated genes found several transcripts with known functions related to regulation of the ECM (Supplemental Figure 2, A and B). Among these, the MMP family members, including MMP-1, -3, -9, -10, -12, and -13, were of particular interest (Figure 2A). The transcripts of these MMPs were upregulated in miR-30e*–transfected and downregulated in miR-30e*–inhibited glioma cells (Supplemental Figure 3A). Moreover, higher MMP9 production and proteolytic activities were found in miR-30e*–transfected glioma cells (Figure 2B and Supplemental Figure 3B). When activity of the MMPs was restrained by an inhibitor, however, the enhancing effect of miR-30e* on glioma cell invasiveness was blocked (Figure 2C and Supplemental Figure 3C), suggesting the importance of MMPs in mediating miR-30e*–induced glioma invasion.
Figure 2. miR-30e* induces invasion of glioma cells through MMP activation.
(A) Genes regulated by miR-30e* as identified by microarray profiling. (B) Quantification of MMP9 secreted from the indicated cells by ELISA. (C) Quantification of the indicated invaded cells in a Transwell assay. Experiments in B and C were repeated at least 3 times, with similar results. **P < 0.01.
miR-30e* activates NF-κB.
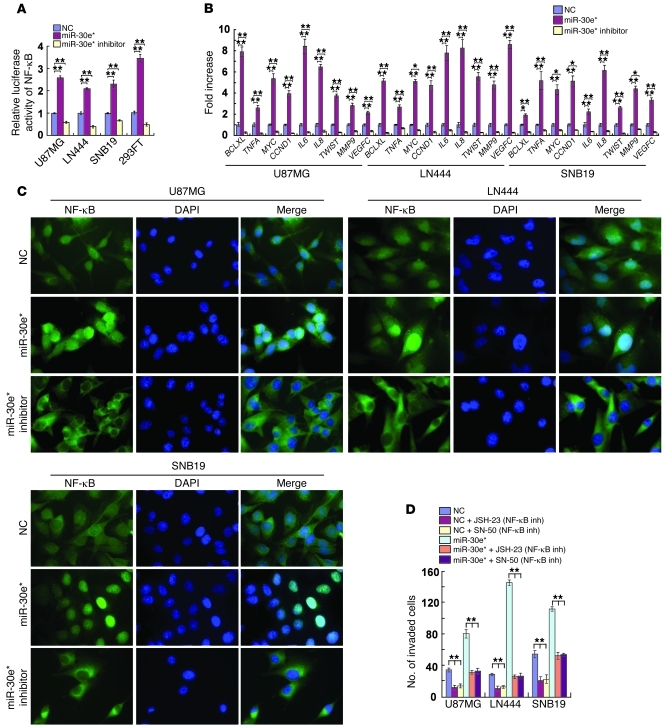
Gene set enrichment analysis (GSEA) showed an apparent overlap between NF-κB–dependent and miR-30e*–upregulated gene sets, suggesting that miR-30e* may activate NF-κB signaling. Indeed, ectopic expression of miR-30e* significantly increased, and miR-30e* downregulation attenuated, the NF-κB–driven luciferase reporter activity and expression of 9 classically recognized NF-κB target genes (Figure 3, A and B). Furthermore, the abundance of nuclear p65 was significantly increased in miR-30e*–overexpressing cells and decreased when miR-30e* was suppressed (Figure 3C). Moreover, luciferase activity driven by the MYC, TNFA or MMP9 promoter was enhanced in miR-30e*–overexpressing cells and reduced in miR-30e*–suppressed cells (Supplemental Figure 4A). EMSA showed that the endogenous NF-κB activity in miR-30e*–overexpressing glioma cells was dramatically increased as compared with that in control cells (Supplemental Figure 4B). In agreement with results obtained from the glioma cell lines, inhibition of miR-30e* in two collections of primary glioma cells (PGCs), which exhibited normal levels of genomic IκBα and high levels of miR-30e* expression, significantly inhibited the NF-κB luciferase activity, decreased expression of 9 classical NF-κB target genes and reduced the invasiveness of PGCs (Supplemental Figure 5, A–D). Collectively, our results suggest that miR-30e* plays important roles in activation of the NF-κB pathway.
Figure 3. miR-30e* activates NF-κB.
(A) Luciferase-reported NF-κB activity in indicated cells. (B) Changes in mRNA expression of NF-κB–regulated genes in the indicated cells assessed by real-time PCR. (C) Subcellular localization of NF-κB p65 in the indicated cells. Original magnification, ×1,000. (D) TMPA analysis of the indicated invaded cells with or without treatment with an NF-κB inhibitor (inh; JSH-23 or SN-50). Experiments in A–D were repeated at least 3 times, with similar results. *P < 0.05, **P < 0.01.
NF-κB activation mediates miR-30e*–induced invasiveness.
The invasiveness of miR-30e*–overexpressing glioma cells was dramatically reversed upon treatment with an inhibitor, JSH-23 or SN-50, that could block NF-κB nuclear translocation (Figure 3D), accompanied by a robust reduction of the general transcriptional activity of NF-κB (Supplemental Figure 4C), suggesting that functional NF-κB activation is key to the development of the invasive phenotype of glioma cells induced by miR-30e*. Meanwhile, the transcriptional activity of AP-1, a factor also known to activate MMP transcription, was not enhanced by miR-30e* (Supplemental Figure 4D), indicating a specific role of NF-κB activation in mediating miR-30e*–induced upregulation of MMPs.
Consistent with the results obtained from the glioma cell lines tested above, ectopic expression of miR-30e* in PGCs significantly decreased the expression of IκBα and increased NF-κB–driven luciferase activity and expression of 9 classically established NF-κB target genes (Supplemental Figure 5, A–C). Furthermore, TMPA showed that the invasive ability of PGCs dramatically increased upon transfection of the miR-30e* mimic but decreased in response to transfection of miR-30e* inhibitor (Supplemental Figure 5D). The invasive ability of PGCs induced with miR-30e* could be abrogated by treatment with an MMP inhibitor, further confirming the role of MMPs in the enhancing effect of miR-30e* on glioma invasion (Supplemental Figure 5D).
miR-30e* directly targets the IκBα 3′-UTR.
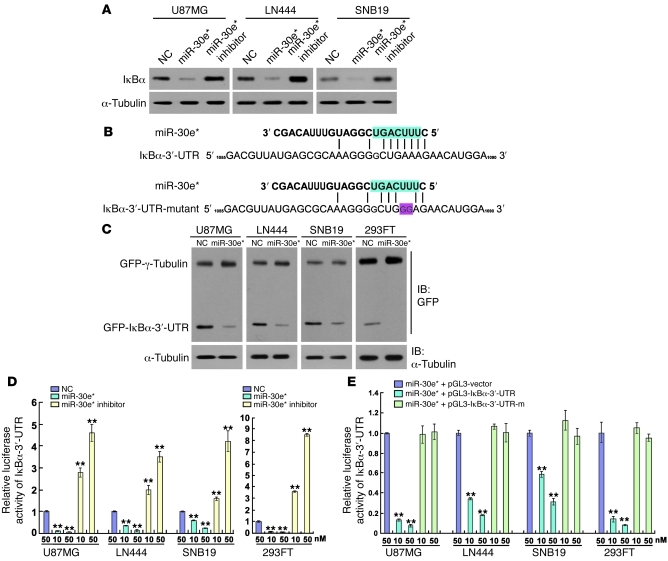
Interestingly, while IκBα mRNA was upregulated in miR-30e*–overexpressing cells and downregulated in miR-30e*–suppressed cells (Supplemental Figure 6A), its protein level displayed the reverse pattern relative to miR-30e* expression (Figure 4A). Together with the lack of alteration in expression of phosphorylated IKKs and IKK activity upon miR-30e* overexpression or downregulation (data not shown), these results indicate that miR-30e* may directly modulate IκBα expression at the translational level. Indeed, the 3′-UTR of IκBα contains conserved critical nucleotides that may serve as a legitimate target of miR-30e* (Figure 4B). When tested using the pEGFP-C3 and pGL3 dual luciferase reporter vectors containing a complete wild-type IκBα 3′-UTR, miR-30e* robustly inhibited the expression of GFP, but not the GFP–γ-tubulin control, in glioma as well as 293FT cells (Figure 4C). A consistent and dose-dependent reduction in luciferase activity upon miR-30e* transfection was observed, which could be reversed by transfection with the miR-30e* inhibitor (Figure 4D). Point mutations in the tentative miR-30e*–binding seed region in the IκBα 3′-UTR abrogated the aforementioned repressive effect of miR-30e*, demonstrating that IκBα is a bona fide target of miR-30e* (Figure 4, B and E).
Figure 4. miR-30e* directly targets the 3′-UTR of IκBα.
(A) Western blot analysis of IκBα expression in the indicated cells. (B) Predicted miR-30e* target sequence in the 3′-UTR of IκBα (IκBα-3′-UTR) and mutant containing two altered nucleotides in the 3′-UTR of IκBα (IκBα-3′-UTR-mutant). (C) Western blot analysis of GFP expression in the indicated cells. (D) Luciferase assay of the indicated cells transfected with the pGL3-IκBα-3′-UTR reporter with increasing amounts (10 and 50 nM) of miR-30e* mimic or miR-30e* inhibitor. (E) Luciferase assay of the indicated cells transfected with pGL3-IκBα-3′-UTR or pGL3-IκBα3′-UTR-mutant reporter with increasing amounts (10 and 50 nM) of miR-30e* mimic. Experiments in A and C–E were repeated at least 3 times, with similar results. **P < 0.01 versus control.
IκBα repression is essential for miR-30e*–induced invasiveness.
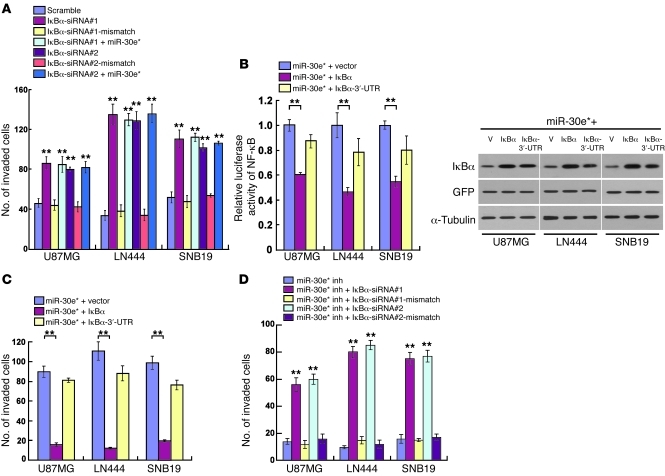
In order to understand the role of IκBα repression in miR-30e*–induced invasiveness, we studied the effect of knockdown of IκBα by two specific IκBα siRNAs and found that it enhanced the NF-κB activity and transcription of NF-κB–regulated genes, including MMPs, IL8, and VEGFC (Supplemental Figure 6, B–F). Concomitant overexpression of the IκBα ORF (without 3′-UTR) and miR-30e* in glioma cells robustly abrogated the enhancement of NF-κB activation and cell invasiveness by miR-30e*; meanwhile, when the IκBα ORF was replaced with the same amount of IκBα cDNA (with 3′-UTR) in the co-transfection experiment, the enhancing effects of miR-30e* were only partially compromised (Figure 5, B and C, and Supplemental Figure 7A). Notably, the invasiveness of miR-30e*–suppressed cells could be rescued by silencing IκBα (Figure 5D and Supplemental Figure 7B), but further ectopically expressing miR-30e* in IκBα-downregulated cells did not increase invasion (Figure 5A), suggesting that IκBα repression is essential for miR-30e*–induced invasiveness.
Figure 5. miR-30e* induces glioma invasiveness through direct targeting of IκBα.
(A) Quantification of the indicated invaded cells analyzed using the TMPA with Matrigel. (B) NF-κB reporter activity (left) and IκBα protein expression (right) in the indicated cells. Scramble, negative control for IκBα siRNA; V, vector. (C and D) Quantification of the indicated invaded cells analyzed using the TMPA with Matrigel. Experiments in A–D were repeated at least 3 times, with similar results. **P < 0.01 versus control.
Overexpression of miR-30e* induces invasiveness of glioma cells in vivo.
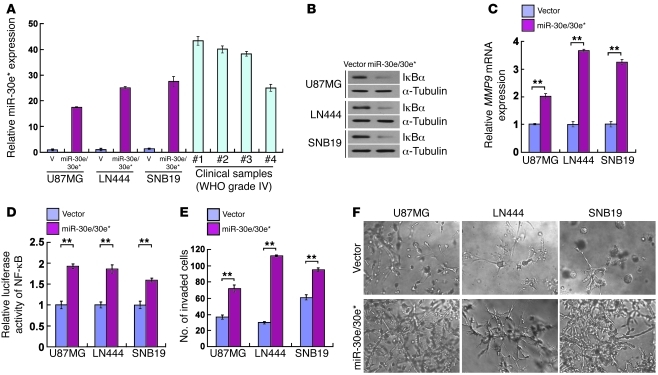
To test whether miR-30e* induces in vivo progression of glioma in an orthotopic tumor model, we engineered U87MG, LN444, and SNB19 glioma cells to stably overexpress miR-30e*/30e. As expected, the modified cells displayed upregulated miR-30e*, reduced IκBα, and increased MMP9 expression and NF-κB activity (Figure 6, A–D). Additionally, a highly invasive phenotype was shown by the TMPA and 3D spheroid invasion assay (Figure 6, E and F). Of note, oligonucleotides mimicking miR-30e had no effect on miR-30e* expression or the invasive/migratory ability of glioma cells (Supplemental Figure 8, A–D), nor on the expression of IκBα and MMP9 or NF-κB activity (data not shown). Furthermore, suppression of miR-30e* drastically reduced the number of invaded glioma cells and decreased the invasive ability of miR-30e/30e*–overexpressing glioma cells as compared with control gliomas cells (Supplemental Figure 8, E–G). Consistent with the observed effects of the miR-30e* inhibitor, co-transfection with mixed miR-30e and miR-30e* inhibitors also reduced the invasiveness of miR-30e/30e*–overexpressing glioma cells. However, inhibition of miR-30e alone had no effect on the invasion of miR-30e/30e*–overexpressing glioma cells (Supplemental Figure 8, E and F). Taken together, our results suggest that the observed molecular and phenotypic changes in the glioma cells stably transduced with the miR-30e/30e* expression cassette was caused by miR-30e* rather than miR-30e.
Figure 6. miR-30e/30e* induces invasiveness of glioma in vitro.
(A) Real-time PCR analysis of miR-30e* expression in the indicated cells and 4 WHO grade IV glioma samples compared with that in U87MG cells. Transcript levels were normalized by U6 expression. (B) Western blot analysis of IκBα protein in glioma cells transduced with a retroviral vector to express miR-30e/30e*. α-Tubulin was detected as the loading control. (C) Expression of MMP9 mRNA was upregulated in miR-30e/30e*–transduced cells. Expression levels were normalized by GAPDH. (D) The relative NF-κB reporter activity increased in miR-30e/30e*–transduced cells. (E) Quantification of indicated invaded cells in the TMPA with Matrigel. (F) Representative micrographs of indicated cells cultured in the 3D spheroid invasion assay. Original magnification, ×200. Experiments in A–F were repeated at least 3 times, with similar results. **P < 0.01.
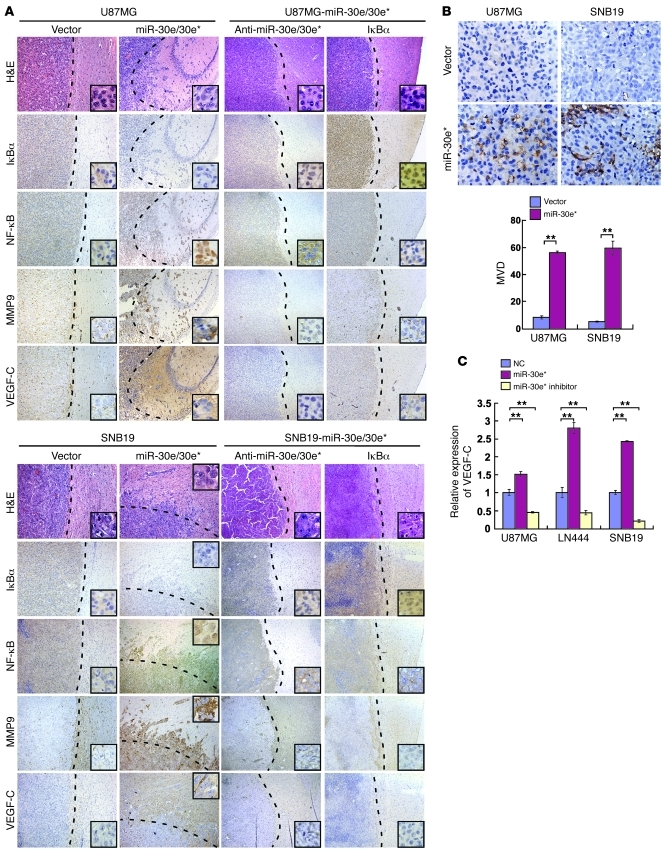
The above engineered and control glioma cells were implanted in the brains of nude mice. As shown in Figure 7A, the control cells generally formed oval-shaped intracranial tumors and exhibited sharp edges when expanding as spheroids. By contrast, tumors formed by the miR-30e/30e*–transduced glioma cells exhibited highly invasive morphology, with the borders displaying a palisading pattern of tumor cell distribution and forming spike-like structures invading into the surrounding regions. Notably, the pattern of MMP9 staining was highly diffusive at the invasion fronts as well as in the disseminated tumor clusters; meanwhile, MMP9 expression in the control tumors was low and mostly localized in the primary loci of the implanted tumors (Figure 7A).
Figure 7. miR-30e* induces invasiveness and angiogenesis of glioma in vivo.
(A) H&E and IHC staining, showing that overexpressing miR-30e* induced invasiveness of glioma in vivo, accompanied by downregulation of IκBα, nuclear translocation of NF-κB, and upregulation of MMP9 and VEGF-C; while suppression of miR-30e* or overexpression of IκBα inhibited the invasive ability of glioma cells via inactivation of the IκBα/NF-κB/MMP9/VEGF-C pathway. The insets are enlarged images derived from the tumor periphery. (B) Representative images (left) and quantification (right) of MVD in tumors indicated by CD31 staining. (C) VEGF-C secretion from the indicated cells quantified by ELISA. Experiments in B and C were repeated at least 3 times, with similar results. **P < 0.01. Original magnification, ×100 (A); ×400 (A, insets); ×400 (B).
When miR-30e* expression in the above engineered miR-30e/30e*–overexpressing glioma cells was inhibited by a retrovirus-mediated miR-30e* inhibitor, the IκBα levels recovered, accompanied by robustly decreased expression of MMP9, NF-κB activity, and invasiveness in vitro (Supplemental Figure 9, A–F). Strikingly, suppressing miR-30e* in these cells that had been initially engineered to overexpress miR-30e*/30e dramatically reduced the invasiveness, MMP9 expression, and nuclear NF-κB p65 in the tumors they formed (Figure 7A). It is particularly worth noting that retrovirally reintroducing IκBα cDNA into two miR-30e/30e*–overexpressing glioma cell lines substantially reversed tumor invasiveness (Figure 7A), strongly supporting IκBα as a key mediator for miR-30e*–induced invasion.
Overexpression of miR-30e* promotes glioma angiogenesis.
In parallel with the miR-30e*–induced invasive phenotype demonstrated in vivo by the above animal experiments, we also observed drastically enhanced microvascular outgrowth and increased MVD in miR-30e/30e*–transduced tumors (P < 0.01, Figure 7B), accompanied by an upregulation of VEGF-C, which was downregulated in tumors transduced with miR-30e* inhibitor or IκBα cDNA (Figure 7A). Secretion of VEGF-C was increased by miR-30e* overexpression, and decreased by miR-30e* suppression, in glioma cells (Figure 7C). When the clinical glioma samples were analyzed, MVD was found to correlate with not only the WHO grading and patient survival (P < 0.001, Supplemental Figure 10, A–C), but also with the miR-30e* levels (P < 0.01, Supplemental Figure 10D). Collectively, our data support a role for miR-30e* as an angiogenesis inducer in gliomas.
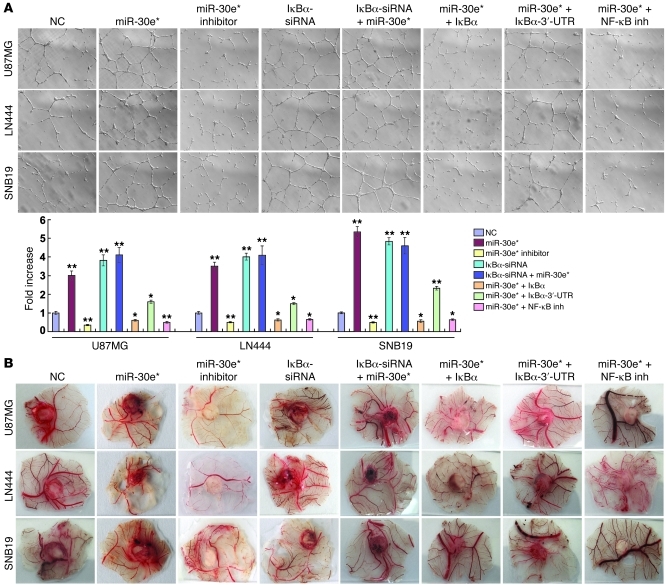
Ectopic expression of miR-30e* strongly provoked, while miR-30e* inhibition abrogated, the ability of glioma cells to induce tube formation and migration of HUVECs and the formation of second- and third-order vessels in chicken chorioallantoic membranes (CAMs) (Figure 8, A and B). Restoration of IκBα by co-transfecting the IκBα ORF (without 3′-UTR) into miR-30e*–overexpressing glioma cells hampered their ability to induce HUVEC tube formation to a level similar to that of the negative control cells. By contrast, IκBα cDNA with the 3′-UTR only mildly attenuated the tube formation ability induced by miR-30e* (Figure 8A). In addition, HUVEC tube formation and migration and CAM neovascularization induced by conditioned medium of miR-30e*–overexpressing glioma cells were markedly reduced when the cells were treated with an NF-κB inhibitor (Figure 8, A and B, and Supplemental Figure 11A). Notably, miR-30e* induction of VEGF-C in glioma cells could be prevented by re-introduction of the IκBα ORF (without 3′-UTR) (Supplemental Figure 11, B and C), indicating that VEGF-C is regulated by miR-30e* through modulation of IκBα. Moreover, the same phenomenon was also observed in the PGCs, in which overexpression of miR-30e* enhanced, but suppression of miR-30e* reduced, HUVEC tube formation (Supplemental Figure 5E), and the HUVEC tube formation ability induced by miR-30e* could be significantly reduced by treatment with a VEGF-C inhibitor (Supplemental Figure 5E). Taken together, our results suggest that miR-30e* exerts proangiogenic effects through suppression of IκBα expression, which in turn activates NF-κB signaling.
Figure 8. miR-30e* promotes glioma angiogenesis in vitro.
(A) Representative images and quantification of HUVECs cultured on Matrigel-coated plates with conditioned medium from the indicated cells. Original magnification, ×100. (B) Representative images of the CAM blood vessels stimulated with conditioned medium from the indicated cells. Experiments in A and B were repeated at least 3 times, with similar results. *P < 0.05, **P < 0.01 versus control.
Clinical relevance of miR-30e*–triggered NF-κB activation in human gliomas.
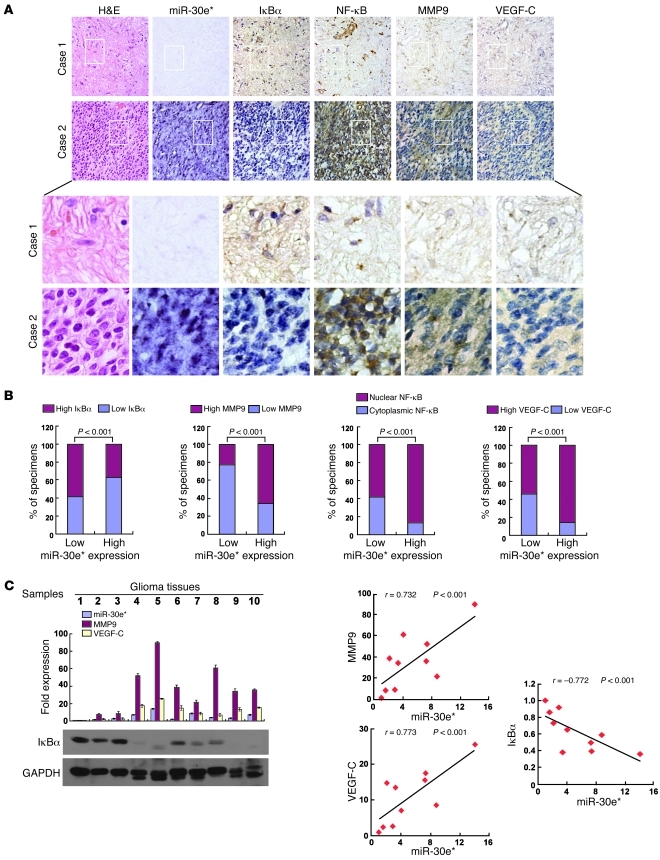
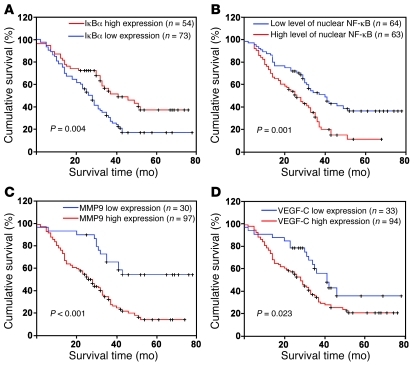
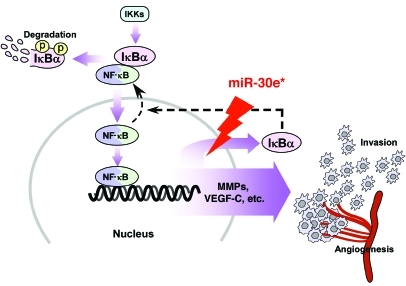
Finally, we examined whether the NF-κB–activating functions of miR-30e* in glioma cells identified in the in vitro experiments as well as animal studies are clinically relevant. As shown in Figure 9, A and B, correlation studies in 127 glioma specimens using IHC analysis showed that miR-30e* expression inversely correlated with IκBα expression (P < 0.001) but strongly positively correlated with MMP9 (P < 0.001) and VEGF-C levels (P < 0.001). Furthermore, 52 of 79 (65.8%) specimens with high miR-30e* expression exhibited increased nuclear localization of NF-κB p65, whereas cytoplasmic NF-κB p65 was found in 37 of 48 low-miR-30e* specimens (77.1%) in which nuclear NF-κB was absent or only marginally detectable. Thus, a statistically significant correlation between miR-30e* expression and NF-κB nuclear localization was found (Figure 9B, r = 0.541, P < 0.001). Moreover, in 10 freshly collected clinical glioma samples, miR-30e* expression was shown to be strongly correlated with MMP9 and VEGF-C (r = 0.732, P < 0.001; r = 0.773, P < 0.001) and inversely with IκBα levels (r = –0.722, P < 0.001; Figure 9C). In the cohort study, the IκBα levels were found to correlate with patient survival time (P = 0.004), which was also inversely associated with high MMP9 (P < 0.001) and VEGF-C (P = 0.0232) levels (Figure 10, A, C, and D). In addition, patients with cytoplasmic NF-κB had higher cumulative 3-year survival rates than those with NF-κB mainly present in the nucleus (P = 0.001) (Figure 10B). Interestingly, while genomic PCR analysis showed that 1 of the 10 glioma cases tested (tumor 3) may be IκBα monoallelic (data not shown), real-time PCR analysis demonstrated that the mRNA levels of IκBα in all 10 gliomas samples were upregulated compared with those in 2 normal brain tissues (Supplemental Figure 12), further supporting the notion that the upregulation of miR-30e* post-transcriptionally represses IκBα expression, activates NF-κB signaling, promotes MMP9 and VEGF-C production, and ultimately leads to poor clinical outcomes for human gliomas (Figure 11).
Figure 9. Clinical relevance of miR-30e* expression in human gliomas.
(A) miR-30e* levels associated with IκBα, NF-κB, MMP9, or VEGF-C expression in 127 primary human glioma specimens. Two representative cases are shown. Original magnification, ×200 (top 2 rows); ×1,000 (bottom 2 rows). (B) Percentages of specimens showing low or high miR-30e* expression relative to the levels of IκBα, MMP9, or VEGF-C and nuclear or cytoplasmic NF-κB p65 staining. (C) Expression (left) and correlation analyses (right) of miR-30e*, MMP9, VEGFC, and IκBα in 10 freshly prepared human glioma samples.
Figure 10. The prognostic significance of the NF-κB signaling pathway in gliomas.
Kaplan-Meier analysis of IκBα (A), nuclear NF-κB p65 (B), MMP9 (C), or VEGF-C (D) expression.
Figure 11. Model of miR-30e*–mediated constitutive activation of the NF-κB pathway via epigenetic disruption of IκBα negative feedback, leading to an aggressive glioma phenotype.
Discussion
An epigenetic mechanism mediating constitutive activation of NF-κB signaling.
Constitutive overactivation of NF-κB signaling is a common event in human cancers and acts as a key factor in cancer development and progression (3–7). However, the mechanism by which cancer cells overcome the NF-κB/IκB feedback loop, in which NF-κB promotes the expression of its own inhibitor IκB to prevent its overactivation under physiological conditions, has long been puzzling. Even though the presumed persistent phosphorylation and degradation of IκBα can be attributed to stimuli continuously causing activation of IKKs, it is likely that a more effective and efficient mechanism underlying the constitutive activation of NF-κB exists in cancer cells. Interestingly, consistent with our results, a published microarray-based, high-throughput assessment has shown that IκBα mRNA is elevated in glioma tissues (n = 157) compared with normal tissues (n = 23) (GEO DataSet record GDS1962), highlighting the importance of understanding the significance and molecular mechanism(s) of posttranscriptional regulation of IκBα in gliomas. Our finding that miR-30e* directly suppresses the IκBα 3′-UTR and translation reveals several significant aspects of such an epigenetic mechanism. First, miRNA-mediated translational suppression of IκBα represents what we believe to be a novel mode of action that abrogates the classical negative feedback loop of NF-κB. Second, such a direct suppression of IκBα expression featured in cancer cells is intrinsic, independent of the upstream IKKs that are usually activated by extrinsic stimuli. Third, the miRNA-mediated epigenetic regulation may lead to NF-κB activation in a more efficient and straightforward fashion than a presumed IKK-induced phosphorylation-ubiquitylation–mediated cascade.
A new molecular mechanism promoting cancer invasion and angiogenesis.
While our knowledge of glioma oncogenesis has improved over the last three decades due to the identification of activating mutations and amplification in oncogenic genes such as EGFR and PI3K and loss of function of tumor suppressor genes such as p53 and PTEN, the molecular mechanisms associated with glioma invasion and angiogenesis are not well understood (13, 15, 17, 40). Delineating the point of convergence of signaling pathways that mediate glioma invasion and angiogenesis may provide new insights into the aggressive nature of gliomas and facilitate identification of novel therapeutic targets. It is now widely accepted that the poor prognosis of individuals with gliomas is largely attributed to their highly invasive nature, which leads to destruction of surrounding brain tissue and to the formation of neovasculature. Among the tumor types, gliomas have the highest degree of revascularization, which also represents an independent prognostic factor (12–17). Suboptimal efficacies of current therapies against gliomas are largely due to the inability to effectively target invading cells. In this context, mounting evidence has demonstrated at the molecular level that MMP9 and VEGF-C are directly involved in augmenting the aggressiveness of gliomas and their expression levels correlate with the degree of histological malignancy as well as the prognosis of gliomas (20–24). On the other hand, while MMP9 and VEGF-C are well-studied molecules, regulation of both genes in many pathological scenarios, including in gliomas, remains incompletely understood. Because these molecules are potential therapeutic targets for cancers, a deeper understanding of the mechanisms by which their expression is driven and sustained is important. In our study, use of an orthotopically xenografted glioma model and statistical analysis of clinical tumors revealed significant correlations between miR-30e* and MMP9, as well as VEGF-C, providing key evidence supporting the notion that miR-30e* is functionally and clinically relevant to invasiveness and angiogenesis of gliomas. Thus, it is hoped that integration of these findings will provide new insights for developing therapeutic interventions against both tumor invasion and neovessel formation in gliomas by inhibition of miR-30e*.
Contribution of miR-30e/30e* to the progression of gliomas.
Results of our current study have highlighted the importance of upregulated miR-30e* for glioma cells to develop and/or sustain the invasive and proangiogenic phenotype. Previously, several lines of evidence have indicated that apoptosis is also suppressed during migration and invasion of glioma cells into surrounding normal brain tissue (41, 42), raising the question of whether miR-30e* might also function as an antiapoptotic factor. Indeed, several NF-κB–regulated apoptosis inhibitors, such as Bcl-xL and BIRC3, were shown to be upregulated by miR-30e* in our study, and upregulation of miR-30e* could markedly inhibit doxorubicin- or UV irradiation–induced apoptosis (data not shown). Interestingly, ectopic expression of miR-30e, the complementary strand of miR-30e*, led to significantly higher growth rates of glioma cells, rather than augmentation of the invasiveness. Our miRNA Chip assay also showed increased miR-30e levels in glioma cells. According to the “Target-Two-Sets-of-Genes-With-One-Pre-miRNA” model (33) of miRNA targeting, we hypothesize that mir-30e and miR-30e*, produced from one primary miRNA (pri-miRNA), may cooperate with each other to support the progression of glioma. In support of this hypothesis, mir-30e and miR-30e* produced from one pre-miRNA have been shown to target two sets of entirely different genes (33). Zhang et al. found miR-30e and miR-30e* to be significantly upregulated in the brain of B6C3F1 mice fed diets supplemented with hexahydro-1,3,5-trinitro-1,3,5 -triazine (RDX), a potential human carcinogen, causing neurotoxicity, immunotoxicity, and an increased likelihood of cancer development (35). Thus, it would be of great interest to further determine whether targeting the whole stem loop of the miR-30e/30e* pre-miRNA can be a potential strategy for inhibition of multiple aggressive features of gliomas.
Interestingly, increased miR-30e* expression has been found in p53–/– embryos, indicating that the tumor suppressor p53, which is frequently mutated in gliomas, may repress miR-30e* expression (43). Moreover, overexpression of miR-30e* in childhood acute lymphoblastic leukemia and hepatocellular carcinomas has been reported (44, 45). Due to the ubiquitous role of NF-κB signaling, the potential significance of miR-30e* in other biological processes, such as inflammation, innate and acquired immunity, and cell proliferation and death, will be explored in our future investigations.
In summary, great effort has been put toward clarifying the mechanisms underlying the aggressive nature of gliomas, and decades of research have focused on screening the effectors involved in tumor-related biological processes. In the current study, we identified miR-30e* as a major mediator of two hallmarks of aggressive gliomas, invasiveness and angiogenesis, possibly by means of a “one-hit/multiple-target” mechanism. These effects were significantly associated with repression of IκBα, resulting in constitutive activation of NF-κB in gliomas. Our results may provide new insights into the pathogenesis of gliomas, and targeting miR-30e* may serve as a promising focus of therapeutic intervention for this uniformly fatal disease.
Methods
Cells.
NHA cells (Sciencell) were cultured under the conditions specified by the manufacturer. Glioma cell lines LN382T, A172, T98G, LN18, LN229, LN464, SNB19, U373MG, U87MG, LN444, LN443, LN340, LN428, LN235, U118MG, D247MG, and LN319 were provided by Shi-Yuan Cheng (University of Pittsburgh, Pittsburgh, Pennsylvania, USA) and grown in the DMEM supplemented with 10% FBS.
Tissue specimens and patient information.
Paraffin-embedded, archived glioma specimens were histopathologically diagnosed at the First Affiliated Hospital of Sun Yat-sen University from 2000 to 2005. The clinical information is described in Supplemental Table 1. Normal brain tissues were obtained from individuals who died in traffic accidents and were confirmed to be free of any preexisting pathologically detectable conditions. Prior donors’ consent and approval from the Institutional Research Ethics Committee were obtained.
Western blot and immunofluorescence assays.
Western blot was performed as previously described (46), using anti-IκBα (Cell Signaling Technology) or anti–α-tubulin antibodies (Upstate). Immunofluorescence staining was carried out on cells grown on coverslips using anti–human p65 antibody (Santa Cruz Biotechnology Inc.) and FITC-conjugated goat anti-mouse secondary antibody (Jackson ImmunoResearch Laboratories Inc.). The images were captured using the AxioVision Rel.4.6 computerized image analysis system.
RNA extraction and real-time quantitative PCR.
Total miRNA from cultured cells and fresh surgical glioma tissues was extracted using the mirVana miRNA Isolation Kit (Ambion) according to the manufacturer’s instructions. cDNA was synthesized using the Taqman miRNA reverse transcription kit (Applied Biosystems), and expression levels of miR-30e* were quantified using miRNA-specific TaqMan MicroRNA Assay Kit (Applied Biosystems). Real-time PCR was performed using the Applied Biosystems 7500 Sequence Detection system. The expression of miRNA was defined based on the threshold cycle (Ct), and relative expression levels were calculated as 2–[(Ct of miR-30e*) – (Ct of U6)] after normalization with reference to expression of U6 small nuclear RNA.
Intracranial brain tumor xenografts, IHC, and H&E staining.
Indicated cells (5 × 10⁵) were stereotactically implanted into individual nude mouse brains (n = 6/group). The glioma-bearing mice were scarified after 5 weeks, whole brains were removed, and 6-μm sections were cut and subjected to immunohistochemical and H&E staining. After deparaffinization, sections were IHC analyzed using an anti-IκBα, anti–NF-κB p65, anti-MMP9, anti–VEGF-C (Cell Signaling Technology), or anti-CD31 antibody (Invitrogen) or H&E stained with Mayer’s hematoxylin solution. The images were captured using the AxioVision Rel.4.6 computerized image analysis system (Zeiss).
Plasmids, virus production, and infection of target cells.
To generate a miR-30e/miR-30e* expression vector, a 200-bp genomic fragment covering the region coding for pri-miR-30e/miR-30e* plus its up- and downstream regions was PCR amplified and cloned into the pMSCV-PURO vector. The IκBα construct was generated by subcloning PCR-amplified full-length human IκBα, purchased from Invitrogen (MGC3161686), into pMSCV-NEO. pNF-κB-luc and control plasmids (Clontech) were used to quantitatively examine NF-κB activity. The 800-bp human MMP9 promoter segment and 960-bp human TNFA promoter segment generated by PCR amplification from DNA of the U87MG cells were cloned into the KpnI/HindIII sites of the pGL3-basic luciferase reporter plasmid (Promega). The 520-bp human C-MYC promoter segment generated by PCR amplification from DNA of the U87MG cells was cloned into the XhoI/BglII sites of the pGL3-basic luciferase reporter plasmid. The IκBα 3′-UTR region was generated by subcloning PCR-amplified full-length human IκBα cDNA (MGC3161686, Invitrogen) into pEGFP-C3 and pGL3 vector. Transfection of siRNAs or plasmids was performed using the Lipofectamine 2000 reagent (Invitrogen) according to the manufacturer’s instructions. Retroviral production and infection were performed as previously described (47). Stable cell lines expressing miR-30e* or IκBα were selected by treatment for 10 days with 0.5 μg/ml puromycin beginning 48 hours after infection.
Pharmacological inhibitors.
Inhibitor compounds were dissolved in Me2SO (cell culture grade; Sigma-Aldrich) and used at the following concentrations: MMP Inhibitor, 50 μM; EMD), NF-κB Activation Inhibitor II JSH-23, 30 μM (EMD), VEGF-C inhibitor, 2.5 μg/ml (VEGF-C neutralizing antibody; Santa Cruz Biotechnology Inc.), or NF-κB Inhibitor SN-50, 50 μg/ml (EMD). The MMP inhibitor was used to treat cells for the indicated durations, and NF-κB Activation Inhibitor JSH-23 was used to treat cells for 11 hours (48).
EMSA.
EMSA was performed by using the LightShift Chemiluminescent EMSA Kit from Thermo Scientific according to the manufacturer’s standard protocol.
Gelatin zymography assay.
Cells (3 × 10⁴) were seeded in 48-well culture plates for 24 hours before the medium was changed to serum-free medium (Invitrogen). At 24 hours, the conditioned medium was collected and quantified for protein content. Samples containing equal amounts of protein mixed with 4× sample buffer (3:1) were run on 9% polyacrylamide gels containing 0.2% gelatin (Sigma-Aldrich). After electrophoresis, the gel was washed twice in wash buffer (2.5% Triton X-100, 50 mM Tris-HCl, 1 μM ZnCl2, pH 7.6) for 45 minutes each time, followed by 2 rinses with the wash buffer (without Triton X-100) and subsequent incubation at 37°C in 50 mM Tris-HCl (pH 7.6), 5 mM CaCl2, 1 μM ZnCl2, 0.02% Brij-35 for 16 hours. The gels were stained with 0.1% Coomassie brilliant blue R-250 and then destained with destaining solution (40% methanol, 10% acetic acid in distilled water).
In situ hybridization and data analysis.
In situ hybridization was performed as previously described (49). Briefly, thin sections (4-μm thickness) of paraffin-embedded specimens were deparaffinized with xylene and rehydrated with an ethanol dilution series from 100% to 25%. Sections were treated with 40 μg/ml proteinase K in 0.2% glycine at 37°C for 5 minutes and 30 seconds and refixed in 4% paraformaldehyde. Slides were prehybridized in a hybridization solution (50% formamide, 5× SSC, 0.1% Tween, 9.2 mM citric acid to adjust pH to 6.0, 50 μg/ml heparin, 500 μg/ml yeast RNA) at 49.5°C for 2 hours. Subsequently, 20 nM of a Locked Nucleic Acid–modified (LNA-modified), 5′-digoxigenin–labeled (DIG-labeled) oligonucleotide probe complementary to miR-30e* or a scrambled control probe was added to 100 μl of the hybridization solution and hybridized at 49.5°C overnight. Sections were rinsed twice in 5× SSC, followed by 3 washes of 20 minutes at 50°C in 50% formamide/2× SSC and subsequently 5 washes in PBS/0.1% Tween-20, and blocked in blocking solution (2% goat serum, 2 mg/ml BSA in PBST) at room temperature for 1 hour. An anti-DIG antibody (1:1,000, Roche) was applied, and the sections were incubated at 4°C overnight. After washing in a staining solution (10 mM Tris-HCl pH 9.0, 50 mM MgCl2, 100 mM NaCl, 0.1% Tween-20), the sections were incubated with NBT/BCIP developing solution (50 ml staining solution, 240 μl of 50 mg/ml NBT, 175 μl of 50 mg/ml BCIP) and rinsed in PBST followed by double distilled water. The sections were then dehydrated and mounted with Entellan. The specificity of the miR-30e* probe used was determined in normal human astrocytes transfected with miR-30e* mimic oligonucleotides or miRNA mimic negative control, during which a scramble probe was used as negative hybridization control.
HUVEC tube formation assay.
HUVEC tube formation and migration assay was performed as previously described (50). Briefly, 200 μl Matrigel (Collaborative Biomedical Products) was pipetted into each well of a 24-well plate and polymerized for 30 minutes at 37°C. HUVECs (2 × 10⁴) in 200 μl conditioned medium were added to each well and incubated at 37°C in 5% CO2 for 20 hours. Pictures were taken under a ×100 bright-field microscope, and the capillary tubes were quantified by determination of length. Each condition was assessed at least in triplicate.
CAM assay.
To evaluate the direct effect on angiogenesis, CAM assay was performed on the eighth day of development of fertilized chicken eggs according to a method previously described (51). A 1-cm-diameter window was opened in the shell of each egg with an 8-day-old chicken embryo (Yueqin Breeding Co.). The surface of the dermic sheet on the floor of the air sac was removed to expose the CAM. First a 0.5-cm-diameter filter paper was placed on top the CAM, and 100 μl conditioned medium harvested from transfected glioma cells was added onto the center of the paper. After the window was closed with sterile adhesive tape, the eggs were incubated at 37°C under 80%–90% relative humidity for 48 hours. Following fixation with stationary solution (methanol/acetone, 1:1) for 15 minutes, the CAMs were cut and harvested, and gross photos of each CAM were taken under a digital camera (Panasonic). The effect of conditioned media harvested from differently transfected or treated cells was evaluated by the number of second- and third-order vessels in comparison with that treated with medium harvested from the mock-transfected group. Statistical analysis of second- and third-order vessels was carried out using 2-tailed Student’s t test.
Microarray data processing and vitalization.
Paired PGCs and astrocytes, isolated from glioma tissues and peripheral glial brain tissues, respectively, with each pair prepared from a same patient, were established for primary culture according to a previously report and characterized with immunofluorescence using antibody against GFAP (52). Then total miRNA from cultured cells was extracted using the mirVana miRNA Isolation Kit (Ambion) according to the manufacturer’s instructions. Microarray hybridization, data generation, and normalization were performed by the Shanghai Biochip Corp. following standard Agilent protocols. Bioinformatics analysis, vitalization of microarray data, and GO enrichment analysis were performed with MeV 4.4 software (MultiExperiment Viewer; http://www.tm4.org/mev/) (53).
Accession numbers.
Microarray data described herein have been deposited in the National Center for Biotechnology Information Gene Expression Omnibus ( http://www.ncbi.nlm.nih.gov/geo/), with accession number GSE20293.
Statistics.
Statistical tests for data analysis included Fisher’s exact test, log-rank test, χ2 test, and Student’s 2-tailed t test. Multivariate statistical analysis was performed using a Cox regression model. Statistical analyses were performed using the SPSS 11.0 (IBM) statistical software package. Data represent mean ± SD. P values of 0.05 or less were considered statistically significant.
Study approval.
For the use of clinical materials for research purposes, prior patients’ consent and approval were obtained from the Sun Yat-sen University and Cancer Center Institutional Board. All animal studies were conducted with the approval of the Sun Yat-sen University Institutional Animal Care and Use Committee.
Supplementary Material
Acknowledgments
This work was supported by the Chinese Ministry of Science and Technology (no. 973-2011CB811305); the Natural Science Foundation of China (nos. 81071647, 81071762, 30872930, 81071780, 81030048, 30870963, 30831160517); and Fundamental Research Funds for the Central Universities (no. 10ykzd03).
Footnotes
Conflict of interest: The authors have declared that no conflict of interest exists.
Citation for this article: J Clin Invest. 2012;122(1):33–47. doi:10.1172/JCI58849.
References
- 1.Sen R, Baltimore D. Multiple nuclear factors interact with the immunoglobulin enhancer sequences. Cell. 1986;46(5):705–716. doi: 10.1016/0092-8674(86)90346-6. [DOI] [PubMed] [Google Scholar]
- 2.Baldwin AS., Jr The NF–kappa B and I kappa B proteins: new discoveries and insights. Annu Rev Immunol. 1996;14:649–683. doi: 10.1146/annurev.immunol.14.1.649. [DOI] [PubMed] [Google Scholar]
- 3.Chen LF, Greene WC. 2004. Shaping the nuclear action of NF-kappaB. Nat Rev Mol Cell Biol. 2004;5(5):392–401. doi: 10.1038/nrm1368. [DOI] [PubMed] [Google Scholar]
- 4.Naugler WE, Karin M. NF-kappaB and cancer-identifying targets and mechanisms. Curr Opin Genet Dev. 2008;18(1):19–26. doi: 10.1016/j.gde.2008.01.020. [DOI] [PMC free article] [PubMed] [Google Scholar]
- 5.Rayet B, Gelinas C. Aberrant rel/nfkb genes and activity in human cancer. Oncogene. 1999;18(49):6938–6947. doi: 10.1038/sj.onc.1203221. [DOI] [PubMed] [Google Scholar]
- 6.Ghosh S, Karin M. Missing pieces in the NF–kappaB puzzle. Cell. 2002;109(suppl):S81–S96. doi: 10.1016/S0092-8674(02)00703-1. [DOI] [PubMed] [Google Scholar]
- 7.Perkins ND. Integrating cell-signalling pathways with NF-kappaB and IKK function. Nat Rev Mol Cell Biol. 2007;8(1):49–62. doi: 10.1038/nrm2083. [DOI] [PubMed] [Google Scholar]
- 8.Hayden MS, Ghosh S. Signaling to NF-kappaB. Genes Dev. 2004;18(18):2195–2224. doi: 10.1101/gad.1228704. [DOI] [PubMed] [Google Scholar]
- 9.Sun SC, Ganchi PA, Ballard DW, Greene WC. NF-kappa B controls expression of inhibitor I kappa B alpha: evidence for an inducible autoregulatory pathway. Science. 1993;259(5103):1912–1915. doi: 10.1126/science.8096091. [DOI] [PubMed] [Google Scholar]
- 10.Johnson C, Van Antwerp D, Hope TJ. An N-terminal nuclear export signal is required for the nucleocytoplasmic shuttling of IkappaBalpha. Embo J. 1999;18(23):6682–6693. doi: 10.1093/emboj/18.23.6682. [DOI] [PMC free article] [PubMed] [Google Scholar]
- 11.Huang TT, Kudo N, Yoshida M, Miyamoto S. A nuclear export signal in the N-terminal regulatory domain of IkappaBalpha controls cytoplasmic localization of inactive NF-kappaB/IkappaBalpha complexes. Proc Natl Acad Sci U S A. 2000;97(3):1014–1019. doi: 10.1073/pnas.97.3.1014. [DOI] [PMC free article] [PubMed] [Google Scholar]
- 12.Stupp R, et al. Radiotherapy plus concomitant and adjuvant temozolomide for glioblastoma. N Engl J Med. 2005;352(10):987–996. doi: 10.1056/NEJMoa043330. [DOI] [PubMed] [Google Scholar]
- 13.Holland EC. Gliomagenesis: genetic alterations and mouse models. Nat Rev Genet. 2001;2(2):120–129. doi: 10.1038/35052535. [DOI] [PubMed] [Google Scholar]
- 14.Reardon DA, Rich JN, Friedman HS, Bigner DD. Recent advances in the treatment of malignant astrocytoma. J Clin Oncol. 2006;24(8):1253–1265. doi: 10.1200/JCO.2005.04.5302. [DOI] [PubMed] [Google Scholar]
- 15.Maher EA, et al. Malignant glioma: genetics and biology of a grave matter. Genes Dev. 2001;15(11):1311–1333. doi: 10.1101/gad.891601. [DOI] [PubMed] [Google Scholar]
- 16.Sanai N, Alvarez-Buylla A, Berger MS. Neural stem cells and the origin of gliomas. N Engl J Med. 2005;353(8):811–822. doi: 10.1056/NEJMra043666. [DOI] [PubMed] [Google Scholar]
- 17.Zhu Y, Parada LF. The molecular and genetic basis of neurological tumours. Nat Rev Cancer. 2002;2(8):616–626. doi: 10.1038/nrc866. [DOI] [PubMed] [Google Scholar]
- 18.Sherer HJ. The forms of growth in glioma and their practical significance. Brain. 1940;63(1):1–35. doi: 10.1093/brain/63.1.1. [DOI] [Google Scholar]
- 19.Hoelzinger DB, Demuth T, Berens ME. Autocrine factors that sustain glioma invasion and paracrine biology in the brain microenvironment. J Natl Cancer Inst. 2007;99(21):1583–1593. doi: 10.1093/jnci/djm187. [DOI] [PubMed] [Google Scholar]
- 20.Fischer I, Gagner JP, Law M, Newcomb EW, Zagzag D. Angiogenesis in gliomas: biology and molecular pathophysiology. Brain Pathol. 2005;15(4):297–310. doi: 10.1111/j.1750-3639.2005.tb00115.x. [DOI] [PMC free article] [PubMed] [Google Scholar]
- 21.Kargiotis O, Rao JS, Kyritsis AP. Mechanisms of angiogenesis in gliomas. J Neurooncol. 2006;78(3):281–293. doi: 10.1007/s11060-005-9097-6. [DOI] [PubMed] [Google Scholar]
- 22.Jain RK, di Tomaso E, Duda DG, Loeffler JS, Sorensen AG, Batchelor TT. Angiogenesis in brain tumours. Nat Rev Neurosci. 2007;8(8):610–622. doi: 10.1038/nrn2175. [DOI] [PubMed] [Google Scholar]
- 23.Gilbertson RJ, Rich JN. Making a tumour’s bed: glioblastoma stem cells and the vascular niche. Nat Rev Cancer. 2007;7(10):733–736. doi: 10.1038/nrc2246. [DOI] [PubMed] [Google Scholar]
- 24.Folkman J. Angiogenesis. Annu Rev Med. 2006;57:1–18. doi: 10.1146/annurev.med.57.121304.131306. [DOI] [PubMed] [Google Scholar]
- 25.Leon SP, Folkerth RD, Black PM. Microvessel density is a prognostic indicator for patients with astroglial brain tumors. Cancer. 1996;77(2):362–372. doi: 10.1002/(SICI)1097-0142(19960115)77:2<362::AID-CNCR20>3.0.CO;2-Z. [DOI] [PubMed] [Google Scholar]
- 26.Birlik B, Canda S, Ozer E. Tumour vascularity is of prognostic significance in adult, but not paediatric astrocytomas. Neuropathol Appl Neurobiol. 2006;32(5):532–538. doi: 10.1111/j.1365-2990.2006.00763.x. [DOI] [PubMed] [Google Scholar]
- 27.Ambros V. The functions of animal microRNAs. Nature. 2004;431(7006):350–355. doi: 10.1038/nature02871. [DOI] [PubMed] [Google Scholar]
- 28.Bartel DP. MicroRNAs: genomics, biogenesis, mechanism, and function. Cell. 2004;116(2):281–297. doi: 10.1016/S0092-8674(04)00045-5. [DOI] [PubMed] [Google Scholar]
- 29.Gregory RI, Shiekhattar R. MicroRNA biogenesis and cancer. Cancer Res. 2005;65(9):3509–3512. doi: 10.1158/0008-5472.CAN-05-0298. [DOI] [PubMed] [Google Scholar]
- 30.Calin GA, Croce CM. MicroRNA signatures in human cancers. Nat Rev Cancer. 2006;6(11):857–866. doi: 10.1038/nrc1997. [DOI] [PubMed] [Google Scholar]
- 31.Esquela-Kerscher A, Slack FJ. Oncomirs — microRNAs with a role in cancer. Nat Rev Cancer. 2006;6(4):259–269. doi: 10.1038/nrc1840. [DOI] [PubMed] [Google Scholar]
- 32.Ruvkun G. Clarifications on miRNA and cancer. Science. 2006;311(5757):36–37. doi: 10.1126/science.311.5757.36d. [DOI] [PubMed] [Google Scholar]
- 33.Ro S, Park C, Young D, Sanders KM, Yan W. Tissue-dependent paired expression of miRNAs. Nucleic Acids Res. 2007;35(17):5944–5953. doi: 10.1093/nar/gkm641. [DOI] [PMC free article] [PubMed] [Google Scholar]
- 34.Ghildiyal M, Xu J, Seitz H, Weng Z, Zamore PD. Sorting of Drosophila small silencing RNAs partitions microRNA* strands into the RNA interference pathway. Rna. 2010;16(1):43–56. doi: 10.1261/rna.1972910. [DOI] [PMC free article] [PubMed] [Google Scholar]
- 35.Zhang X, Ladd A, Dragoescu E, Budd WT, Ware JL, Zehner ZE. MicroRNA–17–3p is a prostate tumor suppressor in vitro and in vivo, and is decreased in high grade prostate tumors analyzed by laser capture microdissection. Clin Exp Metastasis. 2009;26(8):965–979. doi: 10.1007/s10585-009-9287-2. [DOI] [PubMed] [Google Scholar]
- 36.Epis MR, Giles KM, Barker A, Kendrick TS, Leedman PJ. miR-331-3p regulates ERBB-2 expression and androgen receptor signaling in prostate cancer. J Biol Chem. 2009;284(37):24696–24704. doi: 10.1074/jbc.M109.030098. [DOI] [PMC free article] [PubMed] [Google Scholar]
- 37.Gabriely G, et al. MicroRNA 21 promotes glioma invasion by targeting matrix metalloproteinase regulators. Mol Cell Biol. 2008;28(17):5369–5380. doi: 10.1128/MCB.00479-08. [DOI] [PMC free article] [PubMed] [Google Scholar]
- 38.Sasayama T, Nishihara M, Kondoh T, Hosoda K, Kohmura E. MicroRNA-10b is overexpressed in malignant glioma and associated with tumor invasive factors, uPAR and RhoC. Int J Cancer. 2009;125(6):1407–1413. doi: 10.1002/ijc.24522. [DOI] [PubMed] [Google Scholar]
- 39.Nass D, et al. MiR-92b and miR-9/9* are specifically expressed in brain primary tumors and can be used to differentiate primary from metastatic brain tumors. Brain Pathol. 2009;19(3):375–383. doi: 10.1111/j.1750-3639.2008.00184.x. [DOI] [PMC free article] [PubMed] [Google Scholar]
- 40.Cancer Genome Atlas Research Network Comprehensive genomic characterization defines human glioblastoma genes and core pathways. Nature. 2008;455(7216):1061–1068. doi: 10.1038/nature07385. [DOI] [PMC free article] [PubMed] [Google Scholar]
- 41.Mariani L, et al. Glioma cell motility is associated with reduced transcription of proapoptotic and proliferation genes: a cDNA microarray analysis. J Neurooncol. 2001;53(2):161–176. doi: 10.1023/A:1012253317934. [DOI] [PubMed] [Google Scholar]
- 42.Hoelzinger DB, et al. Gene expression profile of glioblastoma multiforme invasive phenotype points to new therapeutic targets. Neoplasia. 2005;7(1):7–16. doi: 10.1593/neo.04535. [DOI] [PMC free article] [PubMed] [Google Scholar]
- 43.Hosako H, Martin GS, Barrier M, Chen YA, Ivanov IV, Mirkes PE. Gene and microRNA expression in p53-deficient day 8.5 mouse embryos. Birth Defects Res A Clin Mol Teratol. 2009;85(6):546–555. doi: 10.1002/bdra.20565. [DOI] [PubMed] [Google Scholar]
- 44.Schotte D, et al. Identification of new microRNA genes and aberrant microRNA profiles in childhood acute lymphoblastic leukemia. Leukemia. 2009;23(2):313–322. doi: 10.1038/leu.2008.286. [DOI] [PubMed] [Google Scholar]
- 45.Jiang J, et al. Association of MicroRNA expression in hepatocellular carcinomas with hepatitis infection, cirrhosis, and patient survival. Clin Cancer Res. 2008;14(2):419–427. doi: 10.1158/1078-0432.CCR-07-0523. [DOI] [PMC free article] [PubMed] [Google Scholar]
- 46.Li J, et al. Astrocyte elevated gene-1 is a novel prognostic marker for breast cancer progression and overall patient survival. Clin Cancer Res. 2008;14(11):3319–3326. doi: 10.1158/1078-0432.CCR-07-4054. [DOI] [PubMed] [Google Scholar]
- 47.Hahn WC, Weinberg RA. Modelling the molecular circuitry of cancer. Nat Rev Cancer. 2002;2(5):331–341. doi: 10.1038/nrc795. [DOI] [PubMed] [Google Scholar]
- 48.Shin HM, et al. Inhibitory action of novel aromatic diamine compound on lipopolysaccharide–induced nuclear translocation of NF–kappaB without affecting IkappaB degradation. FEBS Lett. 2004;571(1–3):50–54. doi: 10.1016/j.febslet.2004.06.056. [DOI] [PubMed] [Google Scholar]
- 49.Schetter AJ, et al. MicroRNA expression profiles associated with prognosis and therapeutic outcome in colon adenocarcinoma. Jama. 2008;299(4):425–436. doi: 10.1001/jama.299.4.425. [DOI] [PMC free article] [PubMed] [Google Scholar]
- 50.Célérier J, Cruz A, Lamandé N, Gasc JM, Corvol P. Angiotensinogen and its cleaved derivatives inhibit angiogenesis. Hypertension. 2002;39(2):224–228. doi: 10.1161/hy0202.103441. [DOI] [PubMed] [Google Scholar]
- 51.Zilberberg L, et al. Structure and inhibitory effects on angiogenesis and tumor development of a new vascular endothelial growth inhibitor. J Biol Chem. 2003;278(37):35564–35573. doi: 10.1074/jbc.M304435200. [DOI] [PubMed] [Google Scholar]
- 52.Soroceanu L, Manning TJ, Jr, Sontheimer H. Reduced expression of connexin-43 and functional gap junction coupling in human gliomas. Glia. 2001;33(2):107–117. doi: 10.1002/1098-1136(200102)33:2<107::AID-GLIA1010>3.0.CO;2-4. [DOI] [PubMed] [Google Scholar]
- 53.Saeed AI, et al. TM4: a free, open-source system for microarray data management and analysis. Biotechniques. 2003;34(2):374–378. doi: 10.2144/03342mt01. [DOI] [PubMed] [Google Scholar]
Associated Data
This section collects any data citations, data availability statements, or supplementary materials included in this article.


