Abstract
Current methods of monitoring insulin secretion lack the required spatial and temporal resolution to adequately map the dynamics of exocytosis of native insulin granules in intact cell populations in three dimensions. Exploiting the fact that insulin granules contain a high level of Zn2+, and that Zn2+ is coreleased with insulin during secretion, we have developed a fluorescent, cell surface-targeted zinc indicator for monitoring induced exocytotic release (ZIMIR). ZIMIR displayed a robust fluorescence enhancement on Zn2+ chelation and bound Zn2+ with high selectivity against Ca2+ and Mg2+. When added to cultured β cells or intact pancreatic islets at low micromolar concentrations, ZIMIR labeled cells rapidly, noninvasively, and stably, and it reliably reported changes in Zn2+ concentration near the sites of granule fusion with high sensitivity that correlated well with membrane capacitance measurement. Fluorescence imaging of ZIMIR-labeled β cells followed the dynamics of exocytotic activity at subcellular resolution, even when using simple epifluorescence microscopy, and located the chief sites of insulin release to intercellular junctions. Moreover, ZIMIR imaging of intact rat islets revealed that Zn2+/insulin release occurred largely in small groups of adjacent β cells, with each forming a “secretory unit.” Concurrent imaging of ZIMIR and Fura-2 showed that the amplitude of cytosolic Ca2+ elevation did not necessarily correlate with insulin secretion activity, suggesting that events downstream of Ca2+ signaling underlie the cell-cell heterogeneity in insulin release. In addition to studying stimulation-secretion coupling in cells with Zn2+-containing granules, ZIMIR may find applications in β-cell engineering and screening for molecules regulating insulin secretion on high-throughput platforms.
Keywords: probe development, zinc imaging, hormone secretion assay
The proper regulation of insulin secretion is essential for maintaining the normal homeostasis of blood glucose (1). To understand better how insulin secretion becomes impaired in pancreatic islet β cells in diabetes, there is increasing interest in studying how the mechanisms that govern insulin release are regulated (2). Techniques that can track the dynamics of regulated secretion with high sensitivity and high spatial and temporal resolution would be invaluable for such studies (3, 4).
Monitoring insulin release at the cellular level was made possible with the development of electrophysiological approaches, including amperometry (5) and measurement of membrane capacitance (6). Although these techniques provide remarkable temporal resolution, they are very limited in spatial aspects of insulin release, are applicable only to a single cell at a time, and can disrupt plasma membranes. To track the location, amplitude, duration, and frequency of insulin secretion at cellular and subcellular levels, fluorescence imaging offers numerous advantages, including high spatial and temporal resolution, superb sensitivity, and noninvasiveness, provided that fluorescent probes for monitoring the secretory activity of pancreatic β cells can be developed (3, 4). Ideally, such probes should be applicable to cultured cells, dissected tissues (islets), or even intact pancreas to track the dynamics of insulin release in three dimensions (3D) over time. In addition, it would be desirable to follow stimulus-secretion coupling by imaging the release of native granules or cargos without the requirement of expressing artificial reporters, because such expressions could potentially perturb the biogenesis, trafficking, and/or localization of native secretory granules (7, 8).
Pancreatic β cells contain high concentrations of Zn2+ in the secretory granules, much of it coordinated with insulin (9), which is coreleased with the hormone on stimulation (10). This phenomenon has been exploited to develop experiments using the fluorescent Zn2+ sensors Zinquin (11), FluoZin-3 (12), RhodZin-3 or Newport Green DCF (10), and ZnAF-2 (13) as a surrogate for measuring insulin release (14–16). However, because FluoZin-3 or other Zn2+ sensors are applied to the extracellular bath, the sensitivity of detecting local Zn2+ release near the plasma membrane is compromised by the background fluorescence from the bulk solution. Consequently, total internal reflection of fluorescence (TIRF) microscopy has been applied to FluoZin-3 or RhodZin-3 imaging to reject bulk fluorescence signal and to study secretion at the interface between a cell and the underlying glass coverslip (10, 16). More sensitive imaging probes that are compatible with wide-field epifluorescence detection or confocal laser scanning microscopy (CLSM) would be extremely valuable for following the pattern or the site of insulin release in 3D in cell populations over time.
Results
Design, Syntheses, and in Vitro Characterization of Zinc Indicator for Monitoring Induced Exocytotic Release.
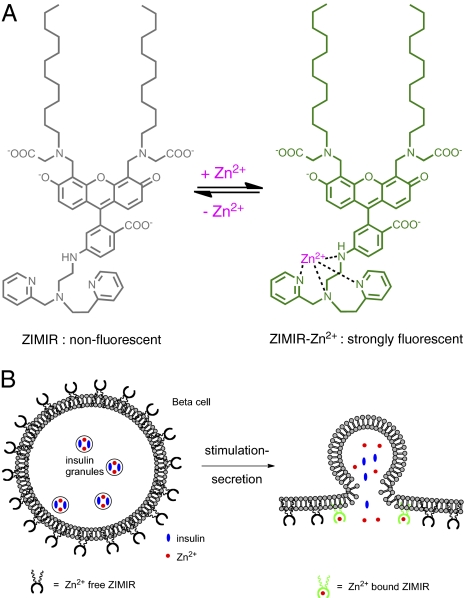
To develop a robust imaging assay for monitoring insulin secretion and to boost the sensitivity of Zn2+ detection near the plasma membrane, we designed a membrane-anchored fluorescent Zn2+ indicator, zinc indicator for monitoring induced exocytotic release (ZIMIR; Fig. 1). ZIMIR consists of three moieties: a fluorophore based on fluorescein, a Zn2+ binding motif derived from dipicolylamine (17–19), and a pair of dodecyl alkyl chains for membrane tethering. In the absence of Zn2+, the fluorescence of ZIMIR is quenched by the photo-induced electron transfer from the amino group to fluorescein. When ZIMIR binds Zn2+, the lone pair electrons of the nitrogen atom of 6-aminofluorescein coordinate around Zn2+, resulting in the dequenching of ZIMIR fluorescence. At physiological pH, ZIMIR is an amphiphilic molecule containing four negative charges, preventing its diffusion across hydrophobic cell membranes by itself. This restricts the probe to the outer leaflet of the lipid bilayer after the insertion of its two alkyl chains into the plasma membrane. During granule exocytosis and insulin secretion, the elevation of local Zn2+ concentration ([Zn2+]) is expected to be highest immediately adjacent to the plasma membrane where ZIMIR is localized. Thus, the fluorescence readout of ZIMIR should be highly sensitive to β cells’ secretory activity.
Fig. 1.
Design of ZIMIR. (A) Chemical structure of ZIMIR in the Zn2+-free (nonfluorescent) and Zn2+-bound (strongly fluorescent) states. (B) Mode of action of ZIMIR for reporting local Zn2+ elevation at the membrane surface during exocytotic insulin granule fusion. The two lipophilic alkyl chains (wavy lines) anchor ZIMIR to the outer leaflet of the membrane lipid bilayer.
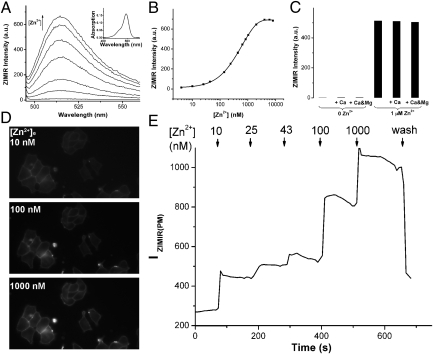
We synthesized ZIMIR in a total of eight steps (Fig. S1). To facilitate characterizing the fluorescent properties in aqueous solutions, we also prepared a highly soluble ZIMIR homolog in which two dodecyl alkyl chains were replaced by a pair of ethyl groups (ZIMIR-C2, Fig. S1). The absorption maximum of ZIMIR-C2 centered around 493 nm with an extinction coefficient of 73,000 M−1⋅cm−1. At low nanomolar [Zn2+], ZIMIR-C2 was nearly nonfluorescent [fluorescence quantum yield without Zn2+, or Qf (0 Zn2+) = 0.0032] (Fig. 2A). Its fluorescence intensity increased with [Zn2+] and reached a plateau at micromolar [Zn2+], with an overall fluorescence enhancement of 70-fold on Zn2+ complexation [Qf (Zn2+) = 0.225], providing a Zn2+ binding dissociation constant of 0.45 μM (Fig. 2B). To confirm that ZIMIR-C2 binds Zn2+ selectively against interfering divalent cations present in physiological salines, we measured its fluorescence in the presence of Ca2+ and Mg2+. At millimolar concentrations, neither Ca2+ nor Mg2+ affected ZIMIR-C2 fluorescence, nor did they affect [Zn2+]-dependent fluorescence enhancement displayed by ZIMIR-C2 (Fig. 2C).
Fig. 2.
Characterization of ZIMIR in vitro and in cells. (A) Zn2+-dependent fluorescence enhancement of ZIMIR-C2. Zn2+ concentrations were 0 nM, 43 nM, 140 nM, 440 nM, 840 nM, 1,640 nM, and 6,440 nM (from bottom to top). (Inset) Absorption spectrum of ZIMIR-C2 changed little with respect to [Zn2+]. (B) Zn2+ titration of ZIMIR-C2 as measured from its emission at 515 nm. The solid line represents the exponential fit. (C) ZIMIR-C2 binds Zn2+ selectively against Ca2+ (1 mM) and Mg2+ (1 mM). All measurements were performed in buffers containing 100 mM Hepes, pH 7.5, with 0.4 μM ZIMIR-C2. Membrane-anchored ZIMIR reports changes of [Zn2+]e. Example ZIMIR fluorescence images of labeled INS-1 cells (D) at different [Zn2+]es and quantification of the average ZIMIR fluorescence intensity along the plasma membrane [IZIMIR(PM)] (E).
ZIMIR Uptake and Zn2+ Response in Live Cells.
To examine the cellular uptake of ZIMIR, we used a mouse insulinoma cell line, MIN6 (20). When ZIMIR was incubated with cells at a concentration of 1 μM, it rapidly adhered to the cell surface of intact living cells (Movie S1). To test the specificity and stability of membrane labeling, we used CLSM to follow the cellular uptake and distribution of ZIMIR in MIN6 cells (Fig. S2). Within 5 min after probe addition, there was already a clear accumulation of ZIMIR along the plasma membrane (Fig. S2 A and B). By 20 min, the cellular uptake of ZIMIR appeared to reach completion (Fig. S2 C and D). Subsequent repetitive washings did not change membrane fluorescence intensity, suggesting strong association between ZIMIR and membrane lipids once ZIMIR was anchored to the plasma membrane (Fig. S2E). It is worth noting that another ZIMIR homolog containing a pair of nonyl alkyl chains, ZIMIR-C9, also showed membrane enrichment during loading but failed to adhere to cell membranes on washing, suggesting that a minimum of two decyl chains is required for ZIMIR to remain stably anchored in the plasma membrane. Once taken up by cells, there was a gradual internalization of ZIMIR into the intracellular compartments, yet a sizable portion of ZIMIR still remained on the cell membrane (Fig. S2F). The intracellular distribution of ZIMIR appeared to overlap extensively with that of rhodamine-transferrin, a marker of endocytic vesicles (21), suggesting that ZIMIR internalization may be at least partially mediated through endocytosis (Fig. S3). We routinely loaded cells with ZIMIR (0.5–1 μM) for ∼20 min before washing and imaging. Further testing of ZIMIR in other β cells, including the rat insulinoma cell line INS-1 and primary β cells isolated from mouse, rat, or human islets, as well as in other types of cell lines, such as HeLa, HEK-293, and COS cells, confirmed the same cellular uptake and membrane labeling properties, suggesting its high efficiency of membrane labeling to be general among cultured mammalian cells. Moreover, β cells labeled with ZIMIR showed the same growth rate (Fig. S4A), comparable apoptosis (Fig. S4B), and identical insulin secretion in response to different secretagogues compared with unlabeled cells (Fig. S4 C and D), suggesting that ZIMIR labeling caused very little cytotoxicity or perturbation toward cell functions.
Membrane-anchored ZIMIR reliably reports fluctuations of [Zn2+] in the extracellular medium. After labeling cells with ZIMIR, we varied extracellular [Zn2+] ([Zn2+]e) from nanomolar to micromolar levels. Intensity of ZIMIR fluorescence along the plasma membrane displayed a stepwise increase with incremental level of [Zn2+]e (Fig. 2 D and E). After washing out Zn2+, membrane ZIMIR intensity declined as expected from the reversibility of Zn2+ binding.
Epifluorescence ZIMIR Imaging of Insulin/Zn2+ Release and Correlation with Membrane Capacitance.
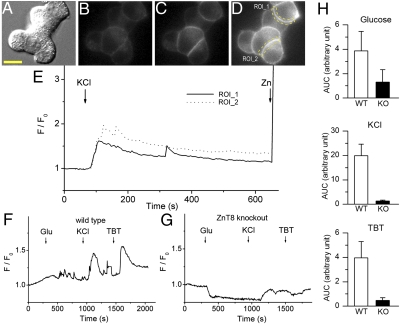
To image insulin/Zn2+ secretion, we used wide-field epifluorescence microscopy and stimulated MIN6 cells with a high KCl concentration (40 mM) to depolarize the cell membrane and to activate the voltage-operated Ca2+ channels. Subsequent Ca2+ influxes triggered insulin release and, as expected, caused a robust enhancement in ZIMIR fluorescence (Fig. 3 A–E and Movie S2). During the experiment, a small amount of EDTA (10 μM) was included in the solution to chelate the residual Zn2+ present in the physiological saline and to reduce the baseline signal. In β cells isolated from WT animals (C57BL/6 mouse), successive stimulation with high glucose (17 mM), KCl (30 mM), and the ATP-sensitive K+ channel blocker tolbutamide (0.2 mM) caused repetitive ZIMIR fluorescence increases (Fig. 3F and Movie S3). In the case of stimulation with the physiological secretagogue glucose, the fluctuations were frequently highly localized at specific regions of the plasma membrane and are likely to reflect individual (or a small number of) exocytotic events, given the relative infrequency of these events under these conditions (22). In contrast, β cells extracted from mice lacking the granular zinc transporter ZnT8 (coded by the Slc30a8 gene) (23) failed to display similar enhancements in ZIMIR fluorescence signal following the same set of stimulations (Fig. 3 G and H and Movie S4). ZnT8 is highly expressed on the granular membrane of islet β cells (24), and ZnT8 KO mice showed defects in cellular Zn2+ transport, insulin crystallization, and the formation of dense core granules, suggesting that ZnT8 represents a key Zn2+ transporter responsible for accumulating the ion in insulin granules (25). Consistent with these studies, the drastically reduced ZIMIR fluorescence in response to stimuli observed in the ZnT8 KO β cells likely reflected a much decreased level of granular Zn2+ content in these cells.
Fig. 3.
ZIMIR imaging of insulin/Zn2+ release. KCl-stimulated insulin/Zn2+ release in MIN6 cells. Example images of MIN6 cells (A, Nomarski) before (B) and after (C) KCl (40 mM) or Zn2+ (D) addition (1 μM). Scale bar, 10 μm. (E) Time courses of ZIMIR signal changes (F/F0) in two example regions of interest (ROIs, indicated in D by dashed lines) along the plasma membrane. F, fluorescence. Compared with WT β cells (F), ZIMIR responses were greatly reduced in Znt8 KO β cells (G). (H) Average ZIMIR responses [quantified as the area under the curve (AUC) from ZIMIR intensity changes over the averaged baseline signal] to different secretagogues are shown (n = 21 cells from 6 WT mice; n = 29 cells from 6 Znt8 KO mice). TBT, tolbutamide.
We next examined how the increase in ZIMIR fluorescence and [Zn2+] on the cell membrane is related to the granule exocytosis induced by direct membrane depolarization. To this end, we used standard whole-cell patch-clamp configuration and monitored changes in membrane capacitance simultaneously with respective changes in ZIMIR fluorescence. To ensure that “full-fusion” events dominated over partial events (“cavity recapture” or “kiss-and-run”) (26, 27), we imposed 10 pulses of 2.5-s depolarizations, which resulted in a dramatic increase in capacitance [Fig. S5; corresponding to the release of 109 ± 37 granules per 10-pulse train, assuming the single-granule capacitance of 3.5 fF (28)]. This was followed almost immediately by an increase in ZIMIR fluorescence. Judging from the proportional elevation in capacitance and membrane ZIMIR signal, we concluded that ZIMIR imaging provided sensitive and faithful readout of exocytotic activity of insulin granules in β cells over a wide dynamic range.
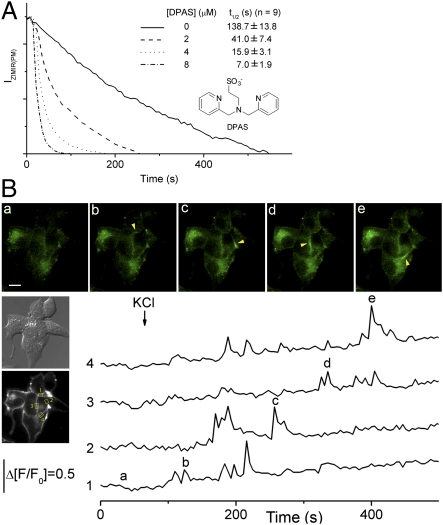
On membrane depolarization, the ZIMIR signal increased immediately and reached a plateau before it gradually declined (Fig. 3 E and F). Unexpectedly, however, the ZIMIR signal remained elevated even after we lowered KCl concentration to the resting level (5 mM) (Fig. S6). This prolonged elevation of fluorescence suggested that Zn2+, once released from the insulin granules and complexed by ZIMIR, only gradually dissociated from the membrane-anchored probe before it escaped into the bulk solution. Because such a slow membrane dissipation of Zn2+ could artificially lengthen the duration of the observed insulin/Zn2+ release, and could obscure resolving individual episodes of secretory bursts that occur in succession, we tested whether we could accelerate Zn2+ dissipation from ZIMIR-labeled membranes by applying a negatively charged Zn2+ chelator, dipicolylamine N-ethylsulfonate (DPAS; Fig. 4A). DPAS is not expected to diffuse across cell membranes by itself. Like other dipicolylamine-based chelators, DPAS binds Zn2+ with good selectivity against Ca2+ and Mg2+, and it chelates Zn2+ with much faster kinetics than EDTA in physiological salines (Fig. S7). In INS-1 β cells labeled with ZIMIR, after recording ZIMIR fluorescence in solutions containing ∼1 μM free Zn2+, we perfused cells with a nominally Zn2+-free solution containing only EDTA (10 μM) or with both EDTA (10 μM) and different concentrations of DPAS. In the absence of DPAS, membrane ZIMIR signal declined slowly on Zn2+ washout (decaying half-lifetime = 138.7 ± 13.8 s, Fig. 4A), likely because the EDTA–Ca2+/Mg2+ complex had to dissociate first (a slow process with an off rate ≤ 2.8 s−1) (29) before EDTA could complex with Zn2+. In contrast, DPAS, even at low micromolar concentrations, increased the rate of Zn2+ dissipation from the plasma membrane by about one order of magnitude (Fig. 4A).
Fig. 4.
DPAS accelerates Zn2+ dissipation from membranes and facilitates revealing oscillatory activity of insulin/Zn2+ release. (A) Time courses of ZIMIR fluorescence intensity along the plasma membrane [IZIMIR(PM)] decay after washing INS-1 cells (initially bathed in HBS containing 1 μM Zn2+) with HBS containing EDTA (10 μM) and DPAS (0–8 μM). (B) ZIMIR imaging of insulin/Zn2+ release of MIN6 cells bathed in SAB containing EDTA (10 μM) and DPAS (4 μM). Time courses of IZIMIR(PM) fluctuation of four separate regions of interest (ROIs) and example ZIMIR images at different time points are shown (a–e; arrowheads highlight local ZIMIR increases in separate ROIs at different times). F, fluorescence. Scale bar, 10 μm.
Consistent with the role of DPAS in accelerating Zn2+ dissipation into the bulk solution, ZIMIR imaging in the presence of DPAS displayed a more dynamic picture of insulin release activity, revealing repetitive fluorescence spikes along the plasma membranes in both cultured MIN6 cells (Fig. 4B and Movie S5) and primary human β cells (Movie S6). Interestingly, there appeared to be preferred sites of insulin release along the cell-cell contacts, where pulses of insulin release were observed repeatedly. Whether those sites correspond to subcellular domains that favor the formation of readily releasable pools of insulin granules remains an interesting question for future investigation.
Confocal imaging of ZIMIR uptake and insulin/Zn2+ release in pancreatic islets.
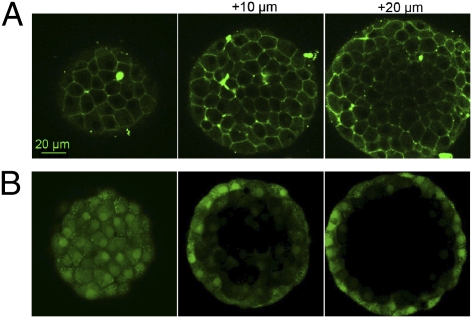
In addition to cultured cells, ZIMIR rapidly and noninvasively labels cells in such preparations as dissected pancreatic islets. After loading islets with ZIMIR for 25 min, we used CLSM to track the distribution of ZIMIR in 3D. We observed that ZIMIR was taken up by cells throughout the islets, from the mantle to the core [Fig. 5A (mouse islets) and Fig. S8 (human islets)]. In contrast, loading cells with cytosolic dyes, such as calcein acetoxymethyl ester (calcein/AM), only labeled cells of the superficial layers (Fig. 5B). The result confirmed that ZIMIR readily diffused through the interstitial space to reach interior cells, whereas calcein/AM was trapped by cells in the outer layer and unable to penetrate any deeper. After labeling, we depolarized cells with high concentration of KCl. A robust and synchronized enhancement of ZIMIR fluorescence was detected in many cells within the islet (Fig. S9 and Movie S7), demonstrating ZIMIR's ability to capture the dynamics of insulin granule release in physiological preparations or tissues.
Fig. 5.
ZIMIR labels cells throughout islets. Confocal images of mouse islets labeled with ZIMIR (A) or calcein/AM (B). Scale bar, 20 μm.
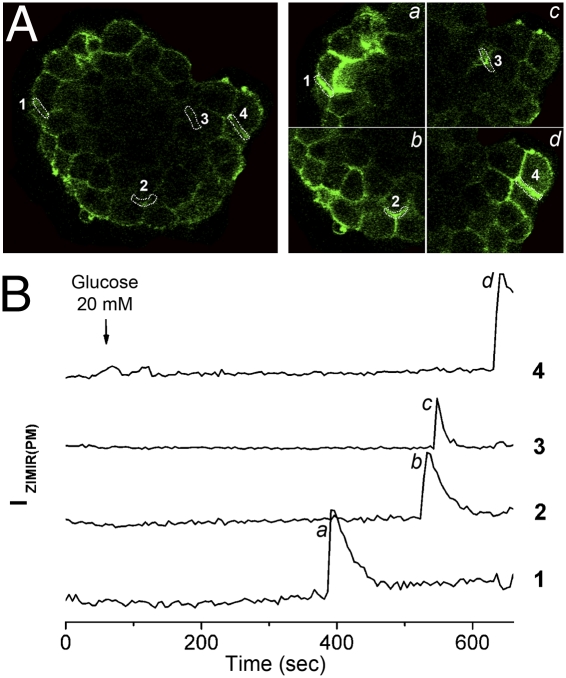
To examine the pattern and the timing of glucose-stimulated insulin secretion (GSIS) at cellular and subcellular resolution in intact islets, we monitored ZIMIR response by CLSM at multiple confocal sections. Following glucose (20 mM) stimulation, ZIMIR fluorescence displayed a robust enhancement in small clusters of β cells (Fig. 6, Movie S8 showing one confocal section and the corresponding time courses of four regions of interest, and Movie S9 showing ZIMIR response of the same islet in 3 confocal sections 10 μm apart). These clusters of glucose-responsive β cells were scattered throughout islets and were surrounded by β cells that showed little insulin secretory activity (Movies S8 and S9). The onset of insulin/Zn2+ release among β cells within the same cluster was synchronized; however, the onsets of GSIS of separate responsive cell clusters of the same islet were frequently out of sync (e.g., Fig. 6 and Movies S8 and S9). Of the 14 rat islets examined, 10 of them displayed a response similar to the one shown in Fig. 6 and the remaining 4 islets displayed a more synchronized ZIMIR response among separate cell clusters (Fig. S10 and Movie S10).
Fig. 6.
ZIMIR imaging of GSIS in intact islets. (A) Confocal ZIMIR images of an islet before (Left) and at different time points (B, a–d) after (Right) stimulation with 20 mM glucose. (Right) Images are enlarged views of four subareas containing four example regions of interest (ROIs) along cell membranes that showed strong ZIMIR response. (B) Time courses of ZIMIR fluorescence of ROI-1 through ROI-4.
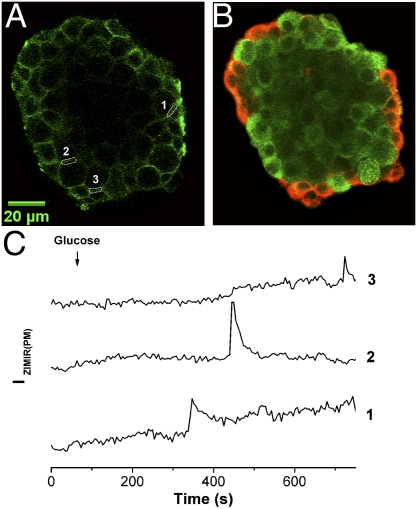
In rodent islets, most β cells cluster in the islet core, which is shelled by a mantle of other types of endocrine cells, including α, δ, and PP cells (30). Our ZIMIR imaging thus far in isolated islets has revealed that insulin secretion could occur both near the mantle and in the interior of islets (Movies S7–S10). It is not clear, however, whether β cells release insulin exclusively at the homologous cell-cell contact (β-β) or if they can also secrete hormone at the heterologous cell-cell contact (e.g., β-α). Answers to this question may become important in investigating the cellular organization of secretory machinery in islets and in understanding paracrine and/or autocrine signaling among islet cells (31). As the initial step to address this question, we performed immunohistochemistry after ZIMIR imaging to identify α and β cells. Correlation of glucose-stimulated ZIMIR responses with immunohistochemical images confirmed that GSIS occurred at both homologous and heterologous cell-cell contacts in islets (Fig. 7).
Fig. 7.
Islet β cells secreted insulin at both homologous and heterologous cell-cell contacts. (A) Confocal ZIMIR image of an islet before glucose stimulation. Three regions of interest (ROIs) along intercellular contacts are shown. (B) Confocal immunohistochemical image (red, glucagon; green, insulin) of the same focal plane of the same islet as in A. ROI-1 and ROI-3 correspond to α-β contacts, and ROI-2 corresponds to a β-β contact. (C) Time courses of ZIMIR fluorescence of ROI-1 through ROI-3. Scale bar, 20 μm.
Discussion
We describe here a unique fluorescent Zn2+ sensor, ZIMIR, that possesses a number of salient features for imaging the dynamics of granular Zn2+ release in intact cell populations with high spatiotemporal resolution. Importantly, the probe can be imaged on a simple epifluorescence microscope without the requirement for sophisticated optical devices (e.g., TIRF microscope, multiphoton microscope). Further, because the use of ZIMIR does not rely on cell transfection to express a fusion protein and does not affect cell viability or the release of the endogenous hormone (Fig. S4), it is ideally suited for studying insulin secretion in freshly isolated primary β cells, intact islets, and possibly even in the intact pancreas.
In addition to pancreatic β cells, a variety of mammalian cells, including submandibular salivary gland, prostate epithelial cells, mast cells, and certain excitatory neurons, contain a high level of Zn2+ in their secretory granules. On stimulation, these cells likewise corelease Zn2+, together with other secretory granules’ contents, into the extracellular medium (32). These different biological systems may also represent fertile areas to apply ZIMIR or its homologs to study stimulus-secretion coupling and Zn2+ homeostasis (33). Depending on the cell type and/or the biological preparation, local [Zn2+] fluctuations near the cell surface likely vary over a wide range during secretion. Developing and using ZIMIR derivatives with appropriate Zn2+ affinities will certainly improve the sensitivity and the resolution for imaging Zn2+ release in different biological systems.
We demonstrate here that ZIMIR can be used to image the exocytotic activity of a variety of insulin-secreting cell preparations, ranging from dispersed cells to the intact islet, reporting changes across the entire cell surface in each case (in contrast to TIRF microscopy) (10, 16). Each approach revealed interesting features of the organization and timing of GSIS at both the cellular and subcellular levels. First, we show that within intact rat islets, β cells are heterogenous in their exocytotic activity following glucose stimulation, such that only a subpopulation of β cells displays robust secretion at any one time. The above findings may reflect the metabolic heterogeneity of individual β cells (34), possibly attributable to differences in the expression of “glucose-sensing” enzymes, notably glucokinase (35), and the heterogeneity in glucose-induced cytosolic Ca2+ ([Ca2+]i) increases previously observed in 11% of WT mouse islets (36). Interestingly, our results showed that rat β cells manifesting robust GSIS tended to aggregate in small clusters and that cells within individual clusters appeared to act together as a “secretory unit” to release insulin in synchrony. These secretory units are scattered throughout islets among other β cells that show much weaker secretory activity; following glucose challenge, the onset of exocytosis between individual secretory units is frequently desynchronized. This “short-range synchronization” in exocytotic activity contrasts with the “long-range synchronization” in [Ca2+]i that has been reported to occur among β cells throughout the islet in mice and humans (37, 38). The difference suggests a disconnection between [Ca2+]i elevation and insulin release in at least some islet β cells and further highlights the complexity of mechanisms underlying the heterogeneity of cellular exocytotic activity.
Second, we demonstrate that the sites of insulin/Zn2+ release at the subcellular level include both homologous cell-cell contacts (β-β) and heterologous (β-α) cell-cell contacts. By contrast, Zn2+/insulin release was rarely observed (in cell clusters) at other sites. In this context, our earlier use of a highly pH-sensitive granule-targeted probe (NPY-Venus) (39), capable of reporting “all” exocytotic event types [including rapid kiss-and-run events in which only small molecules, such as ATP, γ-aminobutyric acid, or H+, are released (40)], did not provide any evidence for the localization of such transient events at cell-cell contact points in MIN6 cell clusters. These findings lead us to speculate that more “complete” fusion events, leading to insulin dissolution and Zn2+ release (27), occur at different sites on the plasma membrane from those leading to kiss-and-run (41).
To uncover further mechanisms and factors governing regulated granule release, it would be desirable to establish a moment-to-moment correlation between cellular signaling and exocytotic activity. Combining ZIMIR with other biochemical fluorescent probes would enable a multicolor imaging approach to determine their spatiotemporal relationship. Our initial attempts at integrating ZIMIR and Fura-2 imaging revealed heterogeneity in exocytotic activity when cells were depolarized to produce a fairly uniform [Ca2+]i rise (Fig. S11 and Movie S11), suggesting that more proximal events downstream of Ca2+ signaling may contribute to variations in insulin release between cells.
Finally, recent progress in ES cell research has generated new hope and excitement in engineering insulin-releasing β cells for cell replacement therapy in the case of diabetes (42). Because ZIMIR imaging can easily be applied to a population of primary β cells to screen their insulin release activity without the requirement of cell transfection, it offers an efficient and convenient assay to screen for cell clones manifesting robust secretory response or to identify compounds or genes of therapeutic potential for treating diabetes using high-throughput platforms.
Materials and Methods
Details of synthesis and Zn2+ titration of ZIMIR, islet isolation, electrophysiology, and imaging are provided in SI Materials and Methods.
Cell Culture and ZIMIR Imaging by Wide-Field Fluorescence Microscopy.
For cell imaging, we cultured cells in 35-mm Petri dishes with glass bottoms (MatTek). To label cells with ZIMIR, cells were washed with a secretion assay buffer (SAB, SI Materials and Methods). The DMSO stock solution of ZIMIR (1–2 mM) diluted in a small volume of SAB was added to cells to a final concentration of 1 μM. Cells were then incubated at ∼25 °C for 20 min and washed with SAB before imaging.
To image insulin/Zn2+ secretion, we routinely included 10 μM EDTA in SAB to chelate the residual Zn2+. In addition, DPAS (2 μM) was added to SAB in most experiments to resolve the dynamics of oscillatory insulin release better. To image [Ca2+]i and Zn2+ release concurrently, we loaded cells with both ZIMIR and Fura-2/AM (2 μM) in the presence of pluronic F-127 (1 g in 10 mL DMSO) (43). During loading, DMSO was kept below 0.5% and pluronic F-127 was less than 0.05%. Wide-field fluorescence microscopy was carried out on inverted fluorescence microscopes as described elsewhere (44).
Islet Labeling and ZIMIR Imaging by CLSM.
Rodent islets were isolated from Sprague–Dawley rats or C57BL/6 mice after digesting exocrine tissues of pancreas using collagenase as described in SI Materials and Methods. Isolated islets were hand-picked and transferred to an imaging dish coated with polylysine (15–30 kDa, 25 μg/mL for 5 min) and cultured overnight in RPMI 1640 medium containing 10% (vol/vol) heat-inactivated FBS. Cells were then incubated for another 2 h in serum-free medium and for an additional 2 h in serum-free and glucose-free medium. To image insulin release in islets, we labeled islets with ZIMIR (2 μM) in SAB buffer (3 mM glucose) for 20 min. Islets were then washed and imaged in SAB solution (with 10 μM forskolin) by CLSM using an LSM510 imaging system (Carl Zeiss) and a 40× oil immersion objective as described elsewhere (43).
Supplementary Material
Acknowledgments
We thank Jun-ichi Miyazaki (Osaka University) and Christopher Newgard (Duke University) for MIN6 and INS-1 β cells, respectively. Confocal imaging of islets was performed at the Live Cell Imaging Core Facility at the University of Texas Southwestern. Human islets were acquired through the Integrated Islet Distribution Program sponsored by the National Institute of Diabetes and Digestive and Kidney Diseases and the Juvenile Diabetes Research Foundation. Financial support was provided by Juvenile Diabetes Research Foundation International Grant JDRF 37-2011-21 (to W.-h.L.) and a postdoctoral fellowship (to A.I.T.), National Institutes of Health Grant R01-GM077593 (to W.-h.L.), and Wellcome Trust Programme Grant 081958/Z/07/Z (to G.A.R.). G.A.R. is a Royal Society Wolfson Research Merit Award Fellow.
Footnotes
The authors declare no conflict of interest.
This article is a PNAS Direct Submission.
This article contains supporting information online at www.pnas.org/lookup/suppl/doi:10.1073/pnas.1109773109/-/DCSupplemental.
References
- 1.Kahn SE, Zraika S, Utzschneider KM, Hull RL. The beta cell lesion in type 2 diabetes: There has to be a primary functional abnormality. Diabetologia. 2009;52:1003–1012. doi: 10.1007/s00125-009-1321-z. [DOI] [PMC free article] [PubMed] [Google Scholar]
- 2.Eliasson L, et al. Novel aspects of the molecular mechanisms controlling insulin secretion. J Physiol. 2008;586:3313–3324. doi: 10.1113/jphysiol.2008.155317. [DOI] [PMC free article] [PubMed] [Google Scholar]
- 3.Rutter GA. Visualising insulin secretion. The Minkowski Lecture 2004. Diabetologia. 2004;47:1861–1872. doi: 10.1007/s00125-004-1541-1. [DOI] [PubMed] [Google Scholar]
- 4.Kasai H, Hatakeyama H, Ohno M, Takahashi N. Exocytosis in islet beta-cells. Adv Exp Med Biol. 2010;654:305–338. doi: 10.1007/978-90-481-3271-3_14. [DOI] [PubMed] [Google Scholar]
- 5.Huang L, Shen H, Atkinson MA, Kennedy RT. Detection of exocytosis at individual pancreatic beta cells by amperometry at a chemically modified microelectrode. Proc Natl Acad Sci USA. 1995;92:9608–9612. doi: 10.1073/pnas.92.21.9608. [DOI] [PMC free article] [PubMed] [Google Scholar]
- 6.Rorsman P. The pancreatic beta-cell as a fuel sensor: An electrophysiologist's viewpoint. Diabetologia. 1997;40:487–495. doi: 10.1007/s001250050706. [DOI] [PubMed] [Google Scholar]
- 7.Michael DJ, et al. Fluorescent cargo proteins in pancreatic beta-cells: Design determines secretion kinetics at exocytosis. Biophys J. 2004;87:L03–L05. doi: 10.1529/biophysj.104.052175. [DOI] [PMC free article] [PubMed] [Google Scholar]
- 8.Michael DJ, Tapechum S, Rohan JG, Johnson JM, Chow RH. Fluorescent cargo proteins in peptidergic endocrine cells: Cell type determines secretion kinetics at exocytosis. Ann N Y Acad Sci. 2009;1152:7–17. doi: 10.1111/j.1749-6632.2008.04006.x. [DOI] [PubMed] [Google Scholar]
- 9.Dodson G, Steiner D. The role of assembly in insulin's biosynthesis. Curr Opin Struct Biol. 1998;8:189–194. doi: 10.1016/s0959-440x(98)80037-7. [DOI] [PubMed] [Google Scholar]
- 10.Michael DJ, Ritzel RA, Haataja L, Chow RH. Pancreatic beta-cells secrete insulin in fast- and slow-release forms. Diabetes. 2006;55:600–607. doi: 10.2337/diabetes.55.03.06.db05-1054. [DOI] [PubMed] [Google Scholar]
- 11.Qian WJ, Aspinwall CA, Battiste MA, Kennedy RT. Detection of secretion from single pancreatic beta-cells using extracellular fluorogenic reactions and confocal fluorescence microscopy. Anal Chem. 2000;72:711–717. doi: 10.1021/ac991085t. [DOI] [PubMed] [Google Scholar]
- 12.Gee KR, Zhou ZL, Qian WJ, Kennedy R. Detection and imaging of zinc secretion from pancreatic beta-cells using a new fluorescent zinc indicator. J Am Chem Soc. 2002;124:776–778. doi: 10.1021/ja011774y. [DOI] [PubMed] [Google Scholar]
- 13.Crivat G, et al. Fluorescence-based zinc ion sensor for zinc ion release from pancreatic cells. Anal Chem. 2006;78:5799–5804. doi: 10.1021/ac060764i. [DOI] [PubMed] [Google Scholar]
- 14.Qian WJ, Peters JL, Dahlgren GM, Gee KR, Kennedy RT. Simultaneous monitoring of Zn2+ secretion and intracellular Ca2+ from islets and islet cells by fluorescence microscopy. Biotechniques. 2004;37:922–924, 926, 928–930 passim. doi: 10.2144/04376BI01. [DOI] [PubMed] [Google Scholar]
- 15.Qian WJ, Gee KR, Kennedy RT. Imaging of Zn2+ release from pancreatic beta-cells at the level of single exocytotic events. Anal Chem. 2003;75:3468–3475. doi: 10.1021/ac0341057. [DOI] [PubMed] [Google Scholar]
- 16.Lemaire K, et al. Insulin crystallization depends on zinc transporter ZnT8 expression, but is not required for normal glucose homeostasis in mice. Proc Natl Acad Sci USA. 2009;106:14872–14877. doi: 10.1073/pnas.0906587106. [DOI] [PMC free article] [PubMed] [Google Scholar]
- 17.Hirano T, et al. Highly zinc-selective fluorescent sensor molecules suitable for biological applications. J Am Chem Soc. 2000;122:12399–12400. [Google Scholar]
- 18.Komatsu K, Kikuchi K, Kojima H, Urano Y, Nagano T. Selective zinc sensor molecules with various affinities for Zn2+, revealing dynamics and regional distribution of synaptically released Zn2+ in hippocampal slices. J Am Chem Soc. 2005;127:10197–10204. doi: 10.1021/ja050301e. [DOI] [PubMed] [Google Scholar]
- 19.Nolan EM, Lippard SJ. Small-molecule fluorescent sensors for investigating zinc metalloneurochemistry. Acc Chem Res. 2009;42:193–203. doi: 10.1021/ar8001409. [DOI] [PMC free article] [PubMed] [Google Scholar]
- 20.Miyazaki J, et al. Establishment of a pancreatic beta cell line that retains glucose-inducible insulin secretion: Special reference to expression of glucose transporter isoforms. Endocrinology. 1990;127:126–132. doi: 10.1210/endo-127-1-126. [DOI] [PubMed] [Google Scholar]
- 21.Grant BD, Donaldson JG. Pathways and mechanisms of endocytic recycling. Nat Rev Mol Cell Biol. 2009;10:597–608. doi: 10.1038/nrm2755. [DOI] [PMC free article] [PubMed] [Google Scholar]
- 22.Rorsman P, Renström E. Insulin granule dynamics in pancreatic beta cells. Diabetologia. 2003;46:1029–1045. doi: 10.1007/s00125-003-1153-1. [DOI] [PubMed] [Google Scholar]
- 23.Nicolson TJ, et al. Insulin storage and glucose homeostasis in mice null for the granule zinc transporter ZnT8 and studies of the type 2 diabetes-associated variants. Diabetes. 2009;58:2070–2083. doi: 10.2337/db09-0551. [DOI] [PMC free article] [PubMed] [Google Scholar]
- 24.Chimienti F, Devergnas S, Favier A, Seve M. Identification and cloning of a beta-cell-specific zinc transporter, ZnT-8, localized into insulin secretory granules. Diabetes. 2004;53:2330–2337. doi: 10.2337/diabetes.53.9.2330. [DOI] [PubMed] [Google Scholar]
- 25.Rungby J. Zinc, zinc transporters and diabetes. Diabetologia. 2010;53:1549–1551. doi: 10.1007/s00125-010-1793-x. [DOI] [PubMed] [Google Scholar]
- 26.Elhamdani A, Azizi F, Artalejo CR. Double patch clamp reveals that transient fusion (kiss-and-run) is a major mechanism of secretion in calf adrenal chromaffin cells: High calcium shifts the mechanism from kiss-and-run to complete fusion. J Neurosci. 2006;26:3030–3036. doi: 10.1523/JNEUROSCI.5275-05.2006. [DOI] [PMC free article] [PubMed] [Google Scholar]
- 27.Tsuboi T, Rutter GA. Multiple forms of “kiss-and-run” exocytosis revealed by evanescent wave microscopy. Curr Biol. 2003;13:563–567. doi: 10.1016/s0960-9822(03)00176-3. [DOI] [PubMed] [Google Scholar]
- 28.Kanno T, et al. Large dense-core vesicle exocytosis in pancreatic beta-cells monitored by capacitance measurements. Methods. 2004;33:302–311. doi: 10.1016/j.ymeth.2004.01.003. [DOI] [PubMed] [Google Scholar]
- 29.Davis JP, Tikunova SB, Walsh MP, Johnson JD. Characterizing the response of calcium signal transducers to generated calcium transients. Biochemistry. 1999;38:4235–4244. doi: 10.1021/bi982495z. [DOI] [PubMed] [Google Scholar]
- 30.Orci L, Unger RH. Functional subdivision of islets of Langerhans and possible role of D cells. Lancet. 1975;2:1243–1244. doi: 10.1016/s0140-6736(75)92078-4. [DOI] [PubMed] [Google Scholar]
- 31.Unger RH, Orci L. Paracrinology of islets and the paracrinopathy of diabetes. Proc Natl Acad Sci USA. 2010;107:16009–16012. doi: 10.1073/pnas.1006639107. [DOI] [PMC free article] [PubMed] [Google Scholar]
- 32.Frederickson CJ, Koh JY, Bush AI. The neurobiology of zinc in health and disease. Nat Rev Neurosci. 2005;6:449–462. doi: 10.1038/nrn1671. [DOI] [PubMed] [Google Scholar]
- 33.Tomat E, Lippard SJ. Imaging mobile zinc in biology. Curr Opin Chem Biol. 2010;14:225–230. doi: 10.1016/j.cbpa.2009.12.010. [DOI] [PMC free article] [PubMed] [Google Scholar]
- 34.Kiekens R, et al. Differences in glucose recognition by individual rat pancreatic B cells are associated with intercellular differences in glucose-induced biosynthetic activity. J Clin Invest. 1992;89:117–125. doi: 10.1172/JCI115551. [DOI] [PMC free article] [PubMed] [Google Scholar]
- 35.Jetton TL, Magnuson MA. Heterogeneous expression of glucokinase among pancreatic beta cells. Proc Natl Acad Sci USA. 1992;89:2619–2623. doi: 10.1073/pnas.89.7.2619. [DOI] [PMC free article] [PubMed] [Google Scholar]
- 36.Ravier MA, Sehlin J, Henquin JC. Disorganization of cytoplasmic Ca(2+) oscillations and pulsatile insulin secretion in islets from ob/ob mice. Diabetologia. 2002;45:1154–1163. doi: 10.1007/s00125-002-0883-9. [DOI] [PubMed] [Google Scholar]
- 37.Martín F, Soria B. Glucose-induced [Ca2+]i oscillations in single human pancreatic islets. Cell Calcium. 1996;20:409–414. doi: 10.1016/s0143-4160(96)90003-2. [DOI] [PubMed] [Google Scholar]
- 38.Ravier MA, et al. Loss of connexin36 channels alters beta-cell coupling, islet synchronization of glucose-induced Ca2+ and insulin oscillations, and basal insulin release. Diabetes. 2005;54:1798–1807. doi: 10.2337/diabetes.54.6.1798. [DOI] [PubMed] [Google Scholar]
- 39.Rutter GA, Loder MK, Ravier MA. Rapid three-dimensional imaging of individual insulin release events by Nipkow disc confocal microscopy. Biochem Soc Trans. 2006;34:675–678. doi: 10.1042/BST0340675. [DOI] [PubMed] [Google Scholar]
- 40.Barg S, et al. Delay between fusion pore opening and peptide release from large dense-core vesicles in neuroendocrine cells. Neuron. 2002;33:287–299. doi: 10.1016/s0896-6273(02)00563-9. [DOI] [PubMed] [Google Scholar]
- 41.MacDonald PE, Braun M, Galvanovskis J, Rorsman P. Release of small transmitters through kiss-and-run fusion pores in rat pancreatic beta cells. Cell Metab. 2006;4:283–290. doi: 10.1016/j.cmet.2006.08.011. [DOI] [PubMed] [Google Scholar]
- 42.Aguayo-Mazzucato C, Bonner-Weir S. Stem cell therapy for type 1 diabetes mellitus. Nat Rev Endocrinol. 2010;6:139–148. doi: 10.1038/nrendo.2009.274. [DOI] [PubMed] [Google Scholar]
- 43.Dakin K, Li WH. Cell membrane permeable esters of D-myo-inositol 1,4,5-trisphosphate. Cell Calcium. 2007;42:291–301. doi: 10.1016/j.ceca.2006.12.003. [DOI] [PubMed] [Google Scholar]
- 44.Guo YM, et al. Imaging dynamic cell-cell junctional coupling in vivo using Trojan-LAMP. Nat Methods. 2008;5:835–841. doi: 10.1038/nmeth.1238. [DOI] [PubMed] [Google Scholar]
Associated Data
This section collects any data citations, data availability statements, or supplementary materials included in this article.


