

Abstract
Advancing the field of physical activity (PA) monitoring requires the development of innovative multi-sensor measurement systems that are feasible in the free-living environment. The use of novel analytical techniques to combine and process these multiple sensor signals is equally important. This paper, describes a novel multi-sensor ‘Integrated PA Measurement System’ (IMS), the lab-based methodology used to calibrate the IMS, techniques used to predict multiple variables from the sensor signals, and proposes design changes to improve the feasibility of deploying the IMS in the free-living environment. The IMS consists of hip and wrist acceleration sensors, two piezoelectric respiration sensors on the torso, and an ultraviolet radiation sensor to obtain contextual information (indoors vs. outdoors) of PA. During lab-based calibration of the IMS, data were collected on participants performing a PA routine consisting of seven different ambulatory and free-living activities while wearing a portable metabolic unit (criterion measure) and the IMS. Data analyses on the first 50 adult participants are presented. These analyses were used to determine if the IMS can be used to predict the variables of interest. Finally, physical modifications for the IMS that could enhance feasibility of free-living use are proposed and refinement of the prediction techniques is discussed.
Keywords: Physical activity, Multi-sensor measurement system, Accelerometer, Objective activity monitor
1. Introduction
Obtaining a complete picture of free-living physical activity (PA) requires information on activity intensity, duration, type, and the context of PA (e.g., indoors vs. outdoors, PA domain). Commonly used PA criterion measures are doubly labeled water and indirect calorimetry. However, the doubly labeled water technique does not provide comprehensive information about free-living PA and it is not practical to use portable indirect calorimeters for long durations. The advent of small sensor-based (e.g., acceleration, respiration, and heart rate sensors) monitors with large storage capacity has advanced the field of PA measurement. Sensor-based activity monitors are both feasible and provide reasonably accurate estimates of PA (Troiano et al., 2008, Staudenmayer et al., 2009). It has been suggested that integrating physiological variables with measures of dynamic motion may improve the prediction of PA (Haskell et al., 1993). Comprehensive and accurate information about PA may be obtained if signals from sensors detecting physiological variables and motion are combined with signals from sensors that provide information on the environmental context of PA.
The ‘Physical Activity Guidelines Advisory Committee Report’ (2008) emphasized the need to develop and evaluate new motion sensor and physiological monitoring technologies to measure PA. The report suggested that such technologies may improve the accuracy and reliability of free-living PA assessment and could lead to a better understanding of the dose-response between PA and health among different populations. In an effort to improve sensor-based objective measures of PA, the National Institutes of Health supported the development of new sensor-based objective monitors that are valid and reliable and can be deployed in the free-living environment. This support came through the Exposure Biology Program of the Genes and Environment Initiative (GEI).The program funded the development of the multi-sensor ‘Integrated Measurement System’ (IMS) (Figure 1) at the University of Massachusetts, Amherst (Kinesiology Dept.). The IMS simultaneously measures body movement (acceleration) at two locations, respiration (breathing frequency and volume), and the environmental context of an activity (indoors vs. outdoors). Measuring body motion provides quantitative knowledge of the force acting on the human body during dynamic movement (Cavagna et al., 1961). This knowledge is indicative of the physiological responses during whole body movement (Cavagna et al., 1961). Accurate measures of respiration variables can be used to refine PA predictions and quantify the user’s internal exposure to environmental pollutants and particles. Internal exposure to pollutants was an area of particular interest to the Exposure Biology Program.
Figure 1.
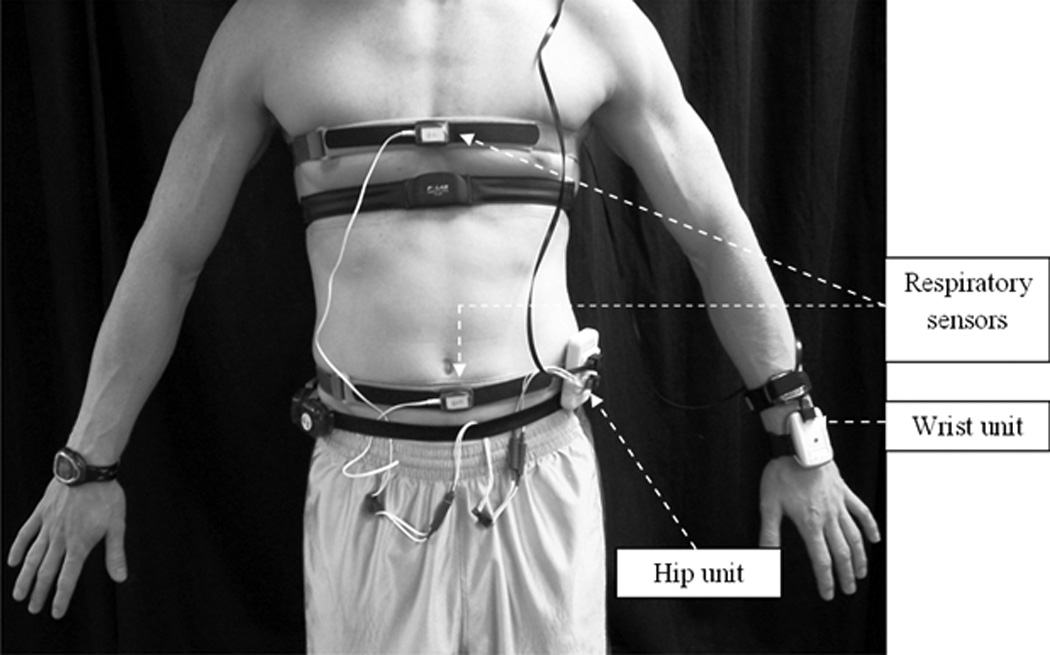
The IMS and its various components
Free-living PA is variable at both an inter- and intra-individual level. PA researchers are now interested in information on both activity type and intensity. Information on these variables could be gleaned through combined analysis of features contained in the ‘raw’ signals from the IMS sensors. Complex modeling methods like ‘machine learning’ techniques may be required to completely describe the information contained within the various signals. Prediction performance of such techniques mainly depends on the identification of optimal features or predictor variables that are input into the prediction model and the number of activities on which the model is trained. Input features are typically a combination of time- (e.g., mean and median) and frequency-domain (e.g., spectral energy) attributes of the sensor signals, and characteristics that are fundamentally representative of a specific movement or posture (e.g., static vs. dynamic acceleration) (Preece et al., 2009). Machine learning techniques are rapidly gaining prominence in the field of PA monitoring (Lau et al., 2008, Staudenmayer et al., 2009, Rothney et al., 2007). These techniques employ a ‘learning-augmented’ approach and have immense potential to improve PA measurement. Researchers can improve prediction performance of these models by manipulating the number and type of features input into the model and training the model against newer examples of PA.
This paper describes (a) the IMS and its various sensors (section 2), (b) the methodology used to calibrate the IMS (section 3), (c) preliminary calibration analyses of the IMS using machine learning techniques that employ few simple signal characteristics as input features (sections 4 and 5), d) proposed physical modifications for the IMS device (section 6) and, (e) the refinement process of machine learning prediction models by increasing the complexity and number of input features (section 6).
2. IMS description
The IMS (See Figure 1) consists of: a) two tri-axial accelerometers that detect motion of the hip and arm, b) two piezoelectric sensors that measure chest and abdominal expansion to estimate breathing volume and frequency, and c) an ultraviolet selective thin film sensor providing information about environmental context (indoors vs. outdoors). The hip accelerometer is housed within an 8.5 × 5 × 1.5 cm plastic case (hip unit) that also contains an 8-bit microcontroller and a 3.7 V Lithium-Polymer rechargeable battery. Power supply from the battery is controlled by a small on/off switch. The wrist accelerometer and the ultraviolet sensor are contained within a 7 × 4.5 × 1.5 cm plastic case (wrist unit). Data from the wrist unit is transmitted to the hip unit using a 5-ft long ethernet cable. The piezoelectric respiration sensor is encased within a molded box (3.5 × 2.5 × .5 cm) with black plastic Velcro bands attached to either side of the sensor. The black Velcro bands are secured to reusable elastic Velcro belts worn around the chest and abdomen. The respiration sensors are connected to the waist unit using two conductor wires. The microcontroller in the hip unit receives and processes information from all the sensors and stores data on a 2 GB non-volatile, flash memory Secure Digital (SD) card that is inserted into a spring-loaded slot in the waist unit. Additional information about the IMS design can be found elsewhere (Liu S, 2010). Raw output from the IMS is processed and viewed using a software application code written in Matlab (MathWorks, Natick, MA).
2.1. IMS Sensors
2.1.1 Motion sensing accelerometers
The two accelerometers (hip and wrist) in the IMS are MMA7260QT (6 × 6 × 1.45 mm) (Freescale Semiconductor, Austin, TX) capacitive acceleration sensors. This low current consumption accelerometer can detect accelerations between ± 6 g. Accelerations are sampled at a frequency of 30 Hz using a 12 bit analog-to-digital converter. Acceleration output is displayed in units of milli-Gs. Signals from all three axes of both the hip and wrist accelerometers are shown in Figure 2, panels A and B.
Figure 2.


Individual responses from the various sensors of the IMS and corresponding metabolic equivalent (MET) values for 6 different activities. (A) Acceleration response from the hip accelerometer. (B) Acceleration response from the wrist accelerometer. (C) Respiratory sensor response. (D) Light sensor response to 5 different testing conditions.
2.1.2. Piezoelectric respiratory sensors
The two respiratory sensors (Sleepmate Respiratory Effort Monitoring System, Sleepmate Technologies, Glen Burnie, MD) contain a piezoelectric sensor that produces a voltage signal in response to shear stress from chest and abdominal expansion. This system does not require any external interface or power source. The analog signals from the respiratory sensors are digitized using a 12-bit analog-to-digital convertor at a sampling rate of 30 Hz. The digitized signal is then filtered using a 15 Hz high pass filter. Output from the ventilation sensor is displayed as volts. Individual signals from both respiratory sensors can be seen in Figure 2 C.
2.1.3. Ultraviolet selective thin film sensor
The ultraviolet sensor in the wrist unit is the TW30SX (sglux SolGel Technologies GmbH, Berlin, Germany). This sensor is a titanium dioxide photodiode that captures UVA, UVB, and UVC rays. This sensor has a large active sensing area of 4.18 mm2, which makes it highly sensitive even when the radiation is low. The high sensitivity of the sensor improves the ability of the IMS to distinguish between indoor and outdoor light. The radiation detected by the photodiode is converted to an electrical signal and output is displayed in volts. The sensor response to varying levels of light exposure can be seen in Figure 2 D.
3. IMS calibration methodology
Since their inception, sensor-based PA monitors have been successfully calibrated in laboratory settings (Arvidsson et al., 2007, Freedson et al., 1998). We used a similar approach in calibrating the IMS. Laboratory-based calibration techniques involve subjects performing a variety of activities (ambulatory and free-living) while simultaneously recording responses from a sensor-based monitor and a criterion measure (usually oxygen consumption) for comparison. The criterion measure is then estimated from monitor output using prediction techniques.
3.1. Visit 1
Data collection for IMS calibration was conducted in the Physical Activity and Health Lab at the University of Massachusetts, Amherst. During the first visit, volunteers were provided information about the study, completed a health history questionnaire, and their seated blood pressure was measured. Participants were considered to be ineligible if the health history questionnaire determined the prevalence or symptoms of any cardiovascular, pulmonary, metabolic, and joint or musculoskeletal disorders, or if they were taking any medications known to affect metabolism or heart-rate. Additionally, adult volunteers were deemed ineligible if their resting systolic or diastolic blood pressure measures were above 140 and 90 mm Hg, respectively. All eligible volunteers signed a written informed consent form approved by the institutional human subjects review committee and were scheduled for a second visit. Volunteers were instructed to fast for at least four hours prior to coming into the lab for visit two.
3.2. Visit 2
3.2.1. Pre-testing protocol
Participants rested for 15 min by lying still on a bed in a climate controlled area of the laboratory. Researchers then measured each participant’s resting metabolic rate using a validated (Nieman et al., 2005, Stewart et al., 2005) hand held portable metabolic measurement unit (MedGem, MicroLife, Golden, CO).
3.2.2. Testing protocol
Male participants wore the reusable chest respiration sensor attached to a Velcro belt secured above the line of the nipple. Female participants wore this belt at the level of the bra strap line. The abdominal respiration sensor belt was worn above the line of the iliac crest for all subjects. The hip unit was clipped to the abdominal respiration sensor belt in line with the anterior axillary line of the dominant hip. The dominant hip was defined as the one that was ipsilateral to the hand used for writing (dominant hand). The wrist unit was secured at the most distal part of the dominant wrist using a Velcro strap. The wrist unit and respiration sensors were connected to the hip unit using conductor wires. After being instrumented with the IMS, participants wore a face mask and a calibrated portable metabolic unit (Oxycon Mobile, Cardinal Health, Yorba Linda, CA) that was secured to the upper back in a harness unit. This metabolic unit is an open circuit indirect calorimeter that collects breath-by-breath metabolic and respiratory data.
A researcher monitored metabolic data collection and recorded all start-stop times to ensure synchronization of the metabolic data with the IMS sensor signals. Commencement of data collection was marked when the IMS power button was switched to the ‘on’ position.
The PA routine was randomly selected from one of two different routines:
Routine 1- a) computer work, b) level treadmill walking at 3 mph, c) stationary cycling at 300 kilopond-meters/min (kpm/min), d) moving a box with a 10 lb weight, e) inclined treadmill walking at 3 mph and a 5% grade, f) inclined treadmill walking at 4 mph and a 5% grade, and g) playing tennis against a practice wall.
During ‘moving the box with a 10 lb weight,’ the participant carried the box and walked a distance of 8 m between point ‘A’ and point ‘B. At each point, the participant placed the box down and paused for a few seconds before bending down to pick the box again. This activity was repeated for 7 min.
Routine 2- a) filing journal articles alphabetically in a cabinet, b) carpet vacuuming, c) self-paced walking, d) level treadmill walking at 4 mph, e) stationary cycling at 600 kpm/min, f) solo basketball, and g) level treadmill running at 6mph.
After completing the PA routine, participants were taken outdoors to test the wrist unit light sensor. Researchers recorded current weather conditions (sunny vs. cloudy) at this point. Participants stood for 30 s in an open area devoid of any obstruction to sunlight exposure (light condition). This was followed by standing under a tree (shade condition). Additionally, to determine the sensitivity of the light sensor when exposed to diffused light, participants stood indoors next to a large glass window (window condition) with the wrist unit facing the window. Clear plain glass partially filters out (approximately 30%) ultra violet radiation (Tuchinda et al., 2006). It was important to determine the response of the wrist unit light sensor to diffused light because most people spend their time indoors or in an environment not exposed to direct sunlight (e.g., travelling in an automobile) (McCurdy and Graham, 2003). Participants then completed a wearability questionnaire, which was used to determine the comfort level while wearing the IMS during the testing session.
4. Data analyses
Preliminary analyses were conducted to determine if the IMS could be used to predict the variables of interest, i.e., ventilatory and PA variables. Data from 50 adult participants (Mean ± SD: age= 32.6 ± 9.0 yrs; body mass index= 24.7 ± 4.9 kg˙m−2) were used in the following preliminary analyses
4.1. Ventilation Analyses
Minute ventilation volume and breathing rate (breaths/min) were estimated using the techniques developed by Liu et al. (Liu et al., 2009, Liu et al., 2008). All ventilation estimations were made after tissue artifact was minimized from the two respiration sensor signals using the Empirical Mode Decomposition technique (EMD) (Liu et al., 2008). Briefly, EMD eliminates spurious harmonic frequencies, identifies true instantaneous frequencies within a given signal, and displays data in the form of a full energy-frequency-time spectrum. In this technique, signals from the respiratory sensors were decomposed into numerous Intrinsic Mode Functions (IMF). Each IMF corresponds to a specific frequency range within the sensor signal. Typically, higher frequency IMFs consist of tissue artifact and the lower frequency IMFs result from respiration. Breathing frequencies from both belts were calculated after spectral analyses were used to reconstruct the respiratory signal from the appropriate IMF. Liu et al. (2008) reported that the EMD technique performs better than two commonly used tissue artifact removal techniques (low-pass filtering and Independent Component Analysis). The average value of the breathing frequencies from the chest and abdominal sensors was used as the estimated breathing frequency for an activity (Liu et al., 2008). Minute ventilation was predicted using a previously validated multiple regression technique (Liu et al., 2009). The prediction variables included the 10th and the 90th percentiles of the abdominal and chest sensor signal distributions and the estimated breathing frequency (Liu et al., 2009).
The predicted ventilation volumes and breathing frequencies were compared to the criterion measures obtained from the ventilation sensor in the portable metabolic unit. Bland Altman analyses were used to examine agreement between the criterion and predicted ventilation variables for individual subjects.
4.2. PA Intensity and Type
We assessed the accuracy of four different pattern recognition or ‘machine learning’ techniques in identifying the activity type and intensity classification. Metabolic equivalents (METs) were used to define intensity classifications (light intensity= METs <3 METs, moderate intensity= METs ≥ 3 and <6 METs, and vigorous= ≥ 6 METs). Activity intensity was computed using the individual’s measured resting metabolic rate as the denominator for MET calculations. The pattern recognition techniques used were Support Vector Machine (SVM) with a Gaussian and a Linear kernel, k-Nearest Neighbor (kNN), and Linear Discriminant Analysis (LDA). Previous reports have shown that these types of pattern recognition techniques are useful in measuring PA (Brezmes et al., 2009, Lau et al., 2008). For example, Lau et al., (2008) demonstrated that an SVM technique using acceleration and gyroscope signals as input features correctly identified walking up and down stairs and walking up and downhill with approximately 80% accuracy. Another study by Brezmes et al., (2009) demonstrated that the kNN technique using cell phone-based triaxial acceleration signals correctly recognized ambulatory (90% accuracy) and postural changes (sitting vs. standing) (70% accuracy).
We also examined the performance of 4 different models per technique for predicting PA type and intensity. The models used were 1) triaxial hip acceleration signals only (M1), 2) triaxial hip acceleration and respiratory signals from the chest and abdomen sensors (M2), 3) triaxial acceleration from the hip and wrist accelerometers (M3), and 4) triaxial acceleration from the hip and wrist accelerometers and respiratory signals from the chest and abdomen sensors (M4). Since these were preliminary analyses, we used only two simple signal features to perform predictions; i.e., the mean and standard deviations of the output signals. The performance of these pattern recognition techniques was examined by computing the percent of activities correctly classified (intensity) or recognized (type) for each model as compared to the criterion measure obtained from the ventilation sensor in the portable metabolic unit or observed activity, respectively.
4.3. Light Sensor Response
Light sensor testing was performed on 10 of the 50 adult participants. This testing was conducted with no obstructions (e.g., clothing) to the sensor. The sensor responses for the three testing conditions were compared to previously established voltage response ranges derived from ‘in-house’ testing of the sensor by the researchers. These were as follows: (a) exposure to sunlight (under sunny, cloudy, or shady conditions) = 2.5 to 4 volts, (b) exposure to diffused sunlight through a glass window = 0.8 to 1.2 volts, and (c) no exposure to sunlight (indoors) = 0 to 0.2 volts. Testing of the sensor’s response to diffused light was conducted with the participant standing at a fixed distance of 2 ft away from the window. The performance of the light sensor was determined by computing the percent correct classification for the three testing condition. The light sensor response was 100% accurate for all 10 participants during all three testing conditions.
We also conducted testing in the above described conditions when the sensor was obstructed with clothing of different thickness and color. We found that the accurate differentiation between indoor and outdoor conditions requires the light sensor to be free from obstructions like clothing. Thick fabrics completely block any diffusion of UV light and the light sensor response is similar to the indoor condition. The sensor also has a higher signal response when covered by thin fabrics of lighter colors as compared to similar fabric of darker colors. There is a greater diffusion of UV light through light colored fabrics than dark colored fabrics (e.g., white vs. grey). Thus, it is advisable that researchers interested in determining the environmental context of free-living PA must ensure that the wrist unit is unobstructed by clothing and is exposed to the environment.
5. Results
5.1. Ventilation Prediction
Table 1 displays a comparison between the mean predicted ventilation volume obtained from the chest and abdomen sensors and the mean criterion measures obtained from the ventilation sensor in the portable metabolic unit for each activity. Overall, the average absolute percent difference between the estimated and the criterion was approximately 9% with a predicted root mean square error of 7.24 L˙min−1. This technique performed reasonably well during moderate intensity activities. However, predicted ventilation volumes during light and vigorous activities were overestimated and underestimated, respectively. Additionally, although Bland Altman analyses revealed a low overall prediction bias of 0.36 L˙min−1, the 95% limits of agreement were wide and ranged between −18.23 and 17.52 L˙min−1.
Table 1.
Estimated ventilatory volume and breathing frequency using the two respiratory sensor IMS. Values are Mean (SD).
| Activity Type | Ventilation (L˙min−1) | Breathing Frequency (breaths˙min−1) | ||
|---|---|---|---|---|
| Measured | Predicted | Measured | Predicted | |
| Computer Work | 10.5 (1.6) | 17.7 (6.5) | 19.2 (2.3) | 15.9(6.1) |
| Filing Papers | 12.6 (2.4) | 22.8 (10.5) | 20.6 (2.9) | 13.0 (6.8) |
| Vacuuming | 19.9 (4.4) | 24.2 (12.8) | 25.1 (3.3) | 18.7 (8.4) |
| Moving the Box | 27.5 (4.0) | 28.6 (10.5) | 25.4 (6.0) | 11.0 (6.6) |
| Self-paced walk | 22.4 (4.6) | 27.7 (9.9) | 23.1 (3.0) | 19.6 (6.6) |
| Cycling 300 kpm | 24.6 (3.0) | 24.0 (7.0) | 22.5 (4.0) | 20.9(6.6) |
| Cycling 600 kpm | 39.2 (5.2) | 34.4 (7.6) | 27.4 (5.3) | 24.1 (8.6) |
| Level treadmill walking (3 mph) | 21.5 (3.9) | 26.4 (7.9) | 22.0 (4.0) | 19.6 (7.0) |
| Treadmill walking (3 mph and 5% grade) | 30.7 (5.4) | 29.4 (6.7) | 25.7 (5.0) | 23.3 (6.4) |
| Level treadmill waking (4 mph) | 32.3 (5.6) | 32.2 (9.3) | 27.1 (3.6) | 24.0 (6.5) |
| Treadmill walking (4 mph and 5% grade) | 42.9 (7.1) | 36.1 (8.2) | 29.1 (5.0) | 26.3 (7.2) |
| Level treadmill running (6 mph) | 58.1 (10.1) | 47.5 (13.6) | 36.2 (5.9) | 26.3 (9.7) |
| Singles tennis against a practice wall | 47.3 (14.2) | 38.8 (11.7) | 38.7 (5.8) | 17.6 (10.0) |
| Basketball | 61.0 (8.6) | 45.2 (11.0) | 42.5 (4.9) | 14.3 (9.4) |
Table 1 also shows a comparison between average predicted breathing frequency and the average criterion measures obtained from the ventilation sensor in the portable metabolic unit for each activity. Overall, this technique underestimated breathing frequency (root mean square error= 7.7 breaths˙min−1). Bland Altman analyses revealed an overall bias of −4.46 breaths˙min−1 and wide limits of agreement ranging between −15.03 and 6.10 breaths˙min−1.
5.2. PA Type and Intensity Classification
Among the four prediction models, M4, which uses signals from the two accelerometers and two ventilation sensors, provided the best estimates of activity type and intensity classification. Among the four pattern recognition techniques examined, the SVM with a Gaussian kernel performed the best. This technique using M4 resulted in accuracy rates up to 73.7% ± 13.5% and 71.4% ± 14.7% for activity type and intensity classification, respectively. The performance the four prediction models and four pattern recognition techniques are shown in Table 2.
Table 2.
Percent accuracy for activity intensity (light, moderate, and vigorous) classification and activity type recognition from the two-belt IMS using four different pattern recognition techniques and four different prediction models. Values are Mean (SD). GK= Gaussian Kernel; LK= Linear Kernel;
| Prediction Technique |
Activity Intensity Classification (% accurate) | Activity Type Recognition (% accurate) | ||||||
|---|---|---|---|---|---|---|---|---|
| M1 | M2 | M3 | M4 | M1 | M2 | M3 | M4 | |
| SVM (GK) | 59.8 (18.7) | 65.7 (15.1) | 67.3 (18.6) | 73.7 (13.5) | 44.4 (18.6) | 58.8 (18.0) | 67.5 (17.0) | 74.3 (15.2) |
| SVM (LK) | 67.6 (17.3) | 68.9 (14.2) | 69.4 (16.6) | 70.3 (13.7) | 63.2 (19.1) | 66.6 (13.6) | 67.6 (16.0) | 71.4 (14.7) |
| KNN | 60.1 (17.3) | 62.2 (14.9) | 68.5 (16.8) | 66.4 (17.0) | 51.4 (17.2) | 59.1 (13.3) | 67.1 (16.7) | 67.6 (16.6) |
| LDA | 62.4 (18.5) | 66.0 (16.6) | 66.4 (19.9) | 68.6 (18.7) | 57.5 (20.4) | 64.6 (16.6) | 67.3 (17.6) | 70.3 (15.5) |
Since SVM with the Gaussian kernel provided the best estimates of PA, we further examined the performance of this technique in predicting the 14 individual activities. Among the 14 activities, computer work, filing papers, moving a box, stationary cycling at 300 kpm˙min−1, singles tennis against a practice wall, and treadmill running at 6 mph were correctly recognized at least 80% of the time. In contrast, the technique performed poorly (less than 60% accuracy) in predicting self-paced walking, and treadmill walking at 3 mph at 0 and 5% grade. Among these three poorly predicted ambulatory activities, the prediction technique incorrectly classified level treadmill walking at 3 mph as walking at 3 mph at a 5% grade (37% of the time) and vice versa (44% of the time). Similarly, self-paced walking was confused with level treadmill walking at 4 mph (27% of the time).
6. Discussion
6.1. Prediction Performance of Preliminary Analyses
6.1.1. Breathing Frequency and Ventilation Volume
In general, the ventilation volume prediction model performed reasonably well for moderate intensity activities, but overestimated and underestimated volumes for light and high intensity activities, respectively. Although there was a low overall bias of 0.36 L˙min−1, the prediction model lacked precision (95% limits of agreement= −18.23 to 17.52 L˙min−1). The bias in ventilation volume estimates using the IMS respiratory sensors are lower than that from a study (−0.71 L˙min−1) by Witt et al. where ventilation volumes were estimated by measuring abdomen and chest wall expansion (Witt et al., 2006). Similar to our study, the estimation technique used by Witt et al. was low on precision (Witt et al., 2006). In comparison, Gastinger et al. reported similar bias (−1.03 L˙min−1) but better precision (95% limits of agreement= −8.23 to 6.17 L˙min−1) in predicting ventilation volume (Gastinger et al., 2010). The activities performed in the studies by Witt et al. and Gastinger et al. were limited to rhythmic ambulatory activities and did not induce a lot of variability in respiration. In comparison, our exercise protocol consisted of several simulated free-living activities, which cause a higher variability in respiration than ambulatory activities. Additionally, a closer inspection of the respiratory signals suggests increased tissue artifact and background noise during light and vigorous activities, respectively. This may have caused the overestimation of ventilation volumes during light activity and underestimation during vigorous activity. Thus, introducing more independent variables into the prediction model and improving the EMD algorithm (enhanced artifact reduction from respiratory signals) may result in a better prediction of ventilation volume.
Unlike ventilation volume, breathing frequency estimates in the current study were more inaccurate than those from the study by Witt et al (2006). The breathing frequency estimation technique in our study consistently underestimated breathing frequency for all 14 activities. Similar to ventilation volume, the predictions were reasonably good for moderate intensity activities while estimates for light and vigorous activities revealed large underestimations. The breathing frequency estimation model solely relies on the ability of the EMD algorithm to eliminate tissue artifact and background noise from the respiratory sensor signals. Thus it is necessary to improve the EMD algorithm to obtain improved measures of breathing frequency.
6.1.2. PA Type and Intensity
Among the four PA (type and intensity classification) prediction techniques examined in this study, the SVM with a Gaussian kernel produced the most accurate results. Importantly, the M4 prediction model (acceleration from the two accelerometers and the two respiration sensors) performed the best in predicting both activity type and classifying activity intensity. This finding reinforces the advantages of using multi-sensor monitoring systems like the IMS over commonly available single-sensor activity monitors. Currently, most acceleration-based activity monitors are worn at the hip and predict PA using a single acceleration signal (vertical axis) (Staudenmayer et al., 2009). The added advantage of using a multi-sensor system like the IMS over uniaxial acceleration motion sensors is apparent when comparing the PA prediction performance between models M1 and M4. Since M1 uses only the hip accelerometer signals to predict PA, it is representative of commonly used accelerometer-based activity monitors. Using multiple sensors (hip plus wrist acceleration sensors and respiratory sensors) in M4 improves prediction performance by approximately 23% over M1 when using the SVM with a Gaussian kernel technique. In addition, including the signal from the wrist acceleration sensor in M4 may have improved the prediction of those activities involving increased hand and upper-body movement but minimal movement of the feet (e.g., filing papers, doing dishes, etc.). During such activities there is minimal generation of a signal from the hip acceleration sensor.
6.1.3. Light Sensor Response
The light sensor of the IMS may be able to provide valuable information about the context (indoors vs. outdoors) in which an activity was performed. Outdoor light conditions during the 10 sessions varied depending upon the time of testing and weather conditions (sunny vs. cloudy). It was interesting to note that irrespective of these varying conditions, the voltage response of the sensor fell within the range of 2.5 to 4 volts that is required for the response to be correctly classified as ‘exposure to sunlight.’ Thus, varying outdoor conditions during the day will not affect the ability of the IMS to distinguish whether an activity was performed outdoors or indoors.
6.1.4. Future Directions
The eventual goal of our project was to develop an activity monitoring system that is valid and reliable and can be deployed in the free-living environment. To achieve this, we are currently refining the IMS in two key areas. The first area of improvement is to increase the feasibility of using of the IMS for prolonged periods in the free-living environment. Although most participants reported that the IMS was comfortable to wear and did not hamper the performance of the activities, these opinions were based on approximately 90 minutes of wear time in a laboratory setting and is not representative of the free-living environment. In the free-living environment users will be required to wear the IMS for long duration during waking hours. Currently, the IMS is a prototype design that is a wired system and hampers wearability for extended periods of time in the free-living environment. In comparison to the abdominal respiratory sensor belt, the chest belt is cumbersome when wearing the IMS for a long time period (10 hrs) in the free-living condition (unpublished observations). Thus, there is a need for select design improvements that could increase the feasibility of using the IMS in the free-living environment. To this effect, we have secured a supplemental grant that will be used to convert the IMS into a wireless, one-belt (abdominal respiratory sensor) monitoring system. The proposed wireless IMS will use a ‘ZigBee’-based standardized wireless protocol. ‘ZigBee’ is a low power consumption, low data rate, and low cost data wireless transmission platform. These enhancements could greatly improve the feasibility of using the IMS in the free-living environment.
Our preliminary analyses with simple input features suggest that the IMS has the potential to provide reasonable estimates of ventilation and PA. The second area of improvement for the IMS is the refinement of the preliminary prediction models. Converting the IMS to a wireless system will not affect the PA and ventilation prediction models described earlier. However, eliminating the chest respiratory belt/sensor warrants substantial modifications to the prediction models to improve their accuracy. Herein lies the advantage of machine learning techniques. Decreased prediction performance due to complete elimination of a physiological signal (chest respiratory sensor) can be accounted for or even reversed by identifying additional optimal features and inputting those into the prediction model. The potential of improving performance of the machine learning techniques used in this study is demonstrated below.
6.1.5. Prediction Performance of the One-Belt Respiratory Sensor IMS
The first step adopted towards improving ventilation estimates was to obtain a more accurate prediction of breathing frequency. Breathing frequency estimates were improved by introducing an Intrinsic Mode Function (IMF) selection criterion called the ‘correlation criterion.’ As a reminder, IMFs are groups of respiratory signals that correspond to a specific frequency range obtained from the EMD technique. In this selection criterion the IMF with the highest correlation to the original respiration sensor signal was determined and used to compute breathing frequency. Figure 3 (A) displays the breathing frequency estimates obtained from the one-belt abdominal respiratory sensor system. Breathing frequency estimates improved by approximately 41% (root mean square error of 4.1 breaths˙min−1) over that obtained when using the previously described two-belt respiratory sensor IMS.
Figure 3.


Comparison between mean estimated and measured respiratory variables obtained using the one-belt abdominal respiratory sensor IMS (A) Breathing frequency using the correlation criteria and (B) ventilation volumes.
Minute ventilation volumes using the one belt respiratory system was predicted using multiple regression analyses. The independent variables in this analysis were the 10th, 25th, 50th, 75th, and 90th percentiles of the signal distribution from the abdomen respiratory sensor and the estimated breathing frequency from this signal. Estimated volumes using the one belt IMS system is shown in Figure 3 (B). This prediction model had a root mean square error of 8.59 L˙min−1 and a mean absolute percent error of 26.6% in predicting ventilation volume. Although the errors were higher than the two-belt respiratory sensor system, the regression equation for the mean predicted values returns a high R2 value (0.96). This suggests that the source of the error is systematic in nature and can potentially be reduced further by exploring other prediction models.
We also examined the effect of adding more predictor variables when estimating PA activity type and ventilation variables using the one-belt IMS. A different technique was used to estimate PA intensity in METs. PA intensity was predicted using the Support Vector Regression (SVR) technique. SVR is the regression version of the SVM and is a common application form of the latter.
A different approach was used to estimate PA intensity. Four activity type groups were first determined based on the standard deviations (SD) of the composite vector magnitude of the acceleration signals from the three axes of the hip accelerometer. The 14 activities were clustered into one of the following four groups: 1) sedentary activities (SD: 0 to 25 milli G), 2) household activities/other (SD: greater than 25 but < 250 milli G), 3) moderate locomotion (SD: greater than 250 but <475 milli G), 4) vigorous activity (SD: >475). Based on these criteria, computer work and filing papers were classified as sedentary activity. Vacuuming, moving the box, self-paced walking, and cycling at 300 and 600 kpm˙min−1 were classified as household activity/other. Level treadmill walking at 3 and 4 mph and treadmill walking at 3 mph and 5% grade were classified as moderate locomotion. Level treadmill running at 6 mph, treadmill walking at 4 mph and 5% grade, singles tennis against a practice wall, and basketball were classified as vigorous activity. PA intensity in METs was then predicted using the SVR pattern recognition technique. The features used were the 10th, 25th, 50th, 75th, and the 90th percentiles of the distribution of the two accelerometer signals, the estimated breathing frequency obtained from the abdomen respiration sensor, and the correlation between the vector magnitudes of the hip and wrist accelerometer signals. Breathing frequency was a feature that was used in predicting all PA and ventilation variables. Table 3A displays the confusion matrix for recognition accuracy among the four activity type groups. For comparison purposes, we have included the confusion matrix for recognition accuracy among the four activity type groups when using the-two belt IMS. The features used in the two-belt IMS prediction model were the mean and standard deviations of the two acceleration and estimated breathing frequency (Table 3B). The largest error observed using the SVM prediction technique for the one-belt IMS was in identifying moderate locomotor activities where 12.1% and 4.4% of the activities were incorrectly classified as household-activity/other and vigorous activity, respectively. The SVM technique had high correct classification rates for the different activity groups ranging between 84 and 94%. Figure 4 shows the comparison between mean predicted METs from the one-belt IMS system and actual METs obtained from the portable metabolic unit. The RMSE was 0.67 METs and the mean absolute percent error was very small at around 11%.
Table 3.
(A) Percent accuracy for activity type group recognition using the one-belt IMS and the SVM (Gaussian kernel) prediction technique. (B) Percent accuracy for activity type group recognition using the two-belt IMS and the SVM (Gaussian kernel) prediction technique.
| (A) | Truth (%) | |||
|---|---|---|---|---|
| Recognition | Sedentary activity |
Household activity/other |
Moderate locomotion |
Vigorous activity |
| Sedentary activity | 88.8 | 2.2 | 0.1 | 0.0 |
| Household activity/other | 11.2 | 93.9 | 12.1 | 7.3 |
| Moderate locomotion | 0.0 | 2.5 | 83.4 | 6.0 |
| Vigorous activity | 0.0 | 1.4 | 4.4 | 86.7 |
| (B) | Truth (%) | |||
|---|---|---|---|---|
| Recognition | Sedentary activity |
Household activity/other |
Moderate locomotion |
Vigorous activity |
| Sedentary activity | 86.1 | 4.3 | 0.3 | 0.7 |
| Household activity/other | 12.2 | 84.2 | 11.3 | 2.5 |
| Moderate locomotion | 1.4 | 7.8 | 83.0 | 9.2 |
| Vigorous activity | 0.2 | 3.7 | 5.5 | 87.5 |
Figure 4.

Comparison between mean predicted METS from the one-belt IMS system and actual METs obtained from the portable metabolic unit.
Similar to the preliminary analyses described earlier, activity type recognition was performed using the SVM with Gaussian kernel technique. However, in addition to the mean and SD of the sensor signals, we also included the correlation between the vector magnitudes of the hip and wrist accelerometer signals, and the breathing frequency obtained from the abdominal respiratory sensor into the prediction model. For comparison purposes, we predicted activity type by inputting the same four features in the k-NN technique. Once again, we compared the prediction performance of three models (1) M1 (features from the hip accelerometer signals), (2) M2 (features from the hip accelerometer and the abdominal respiratory sensor), (3) M3 (features from the hip and wrist acceleration sensors), and (4) M4 (features from the hip and wrist acceleration sensors and the abdominal respiratory sensor). The correlation between the vector magnitudes of the hip and wrist acceleration sensors was used as a prediction variable only for M3 and M4. Figure 5 shows that the M4 model using the SVM with a Gaussian kernel technique was the best predictor of activity type. In fact, the prediction accuracy increased from around 71% (two-belt respiratory system and fewer features) to around 79%. Additionally, the prediction accuracies of individual activities improved and are shown in Figure 6.
Figure 5.

Activity type recognition accuracy of two pattern recognition techniques and four prediction models using the one-belt abdominal respiratory sensor IMS. Values are mean and SD.
Figure 6.

Individual activity type prediction performance of the SVM with Gaussian kernel pattern recognition technique using the one-belt abdominal respiratory sensor IMS.
7. Conclusions
Data analyses of the first 50 participants demonstrate that the IMS holds promise in providing accurate estimates of respiratory and PA variables. Analyses of data from all participants will establish the validity of the current prediction techniques. These analyses may also help determine additional features for inputs into the existing prediction algorithms to improve prediction performance.
The proposed changes to the IMS design will greatly enhance its feasibility in measuring activity levels of free-living individuals over long periods of time. Increasing user comfort by eliminating the chest respiratory sensor belt may enhance user compliance and thus decrease instances of missing data during the measurement period. Similarly, converting the IMS to a wireless measurement system will not only increase user compliance, but will also minimize potential damage to the IMS arising from situations where wires could get tangled and disconnect from the hip unit.
Following redesign, we will examine the validity and feasibility of use of the IMS in free living conditions. For this purpose, we plan to conduct a free-living validation/feasibility study where participants will wear the IMS for at least two to four days during waking hours. During this period, the IMS will be validated against ‘direct observation’ as the criterion measure for activity type and intensity. The free-living data will be used to refine the existing prediction models to provide accurate estimates of sedentary and light intensity activities. Participants wearing the IMS in the free-living environment will also complete a wearability questionnaire. This information will help determine the participants’ comfort level when wearing the IMS during waking hours. The data from the free-living study will enable the refinement of both the accuracy and feasibility of the IMS and potentially enable the implementation of the IMS in ongoing free-living cohort studies to obtain a clearer and more accurate picture of PA at a population level. We also will explore other potential applications of the IMS sensors. For example, the light sensor can be used to gain a better understanding of the dose –response relationship between disease development and vitamin-D production whereas the respiratory sensors can be used to assess sleep apnea and determine the dose-response relationship between disease and internal exposure to environmental toxins.
Acknowledgment
This project was funded by NIH grant UO1 CA130783.
References
- U.S. Department of Health and Human Services. U.S. Department of Health and Human Services; 2008. [Accessed 10-9-2010 2010]. Physical Activity Guidelines Advisory Committee Report. [Online] Available: http://www.health.gov/paguidelines/committeereport.aspx. [Google Scholar]
- Arvidsson D, Slinde F, Larsson S, Hulthen L. Energy cost of physical activities in children: validation of SenseWear Armband. Med Sci Sports Exerc. 2007;39:2076–2084. doi: 10.1249/mss.0b013e31814fb439. [DOI] [PubMed] [Google Scholar]
- Brezmes T, Gorricho J, Cotrina J. Activity recognition from accelerometer data on a mobile phone. Distributed Computing, Artificial Intelligence, Bioinformatics, Soft Computing, and Ambient Assisted Living. 2009:796–799. [Google Scholar]
- Cavagna G, Saibene F, Margaria R. A three-directional accelerometer for analyzing body movements. J Appl Physiol. 1961;16:191. doi: 10.1152/jappl.1961.16.1.191. [DOI] [PubMed] [Google Scholar]
- Freedson PS, Melanson E, Sirard J. Calibration of the Computer Science and Applications, Inc. accelerometer. Med Sci Sports Exerc. 1998;30:777–781. doi: 10.1097/00005768-199805000-00021. [DOI] [PubMed] [Google Scholar]
- Gastinger S, Sefati H, Nicolas G, Sorel A, Gratas-Delamarche A, Prioux J. Estimates of ventilation from measurements of rib cage and abdominal distances: a portable device. Eur J Appl Physiol. 2010;109:1179–1189. doi: 10.1007/s00421-010-1463-1. [DOI] [PubMed] [Google Scholar]
- Haskell WL, Yee MC, Evans A, Irby PJ. Simultaneous measurement of heart rate and body motion to quantitate physical activity. Med Sci Sports Exerc. 1993;25:109–115. doi: 10.1249/00005768-199301000-00015. [DOI] [PubMed] [Google Scholar]
- Lau H, Tong K, Zhu H. Support vector machine for classification of walking conditions using miniature kinematic sensors. Medical and Biological Engineering and Computing. 2008;46:563–573. doi: 10.1007/s11517-008-0327-x. [DOI] [PubMed] [Google Scholar]
- Liu S, Gao RX, He Q, Staudenmayer J, Freedson P. Development of statistical regression models for ventilation estimation; Conf Proc IEEE Eng Med Biol Soc; 2009. pp. 1266–1269. [DOI] [PubMed] [Google Scholar]
- Liu SGR, Freedson P. Design of a Wearable Multi-Sensor System for Physical Activity Assessment. 2010 IEEE/ASME International Conference on Advanced Intelligent Mechatronics (AIM); July 6– 9 2010; Canada: Montreal; [Google Scholar]
- Liu S, He Q, Gao RX, Freedson P. Empirical mode decomposition applied to tissue artifact removal from respiratory signal; Conf Proc IEEE Eng Med Biol Soc; 2008. pp. 3624–3627. [DOI] [PubMed] [Google Scholar]
- Mccurdy T, Graham SE. Using human activity data in exposure models: analysis of discriminating factors. J Expo Anal Environ Epidemiol. 2003;13:294–317. doi: 10.1038/sj.jea.7500281. [DOI] [PubMed] [Google Scholar]
- Nieman DC, Austin MD, Chilcote SM, Benezra L. Validation of a new handheld device for measuring resting metabolic rate and oxygen consumption in children. Int J Sport Nutr Exerc Metab. 2005;15:186–194. doi: 10.1123/ijsnem.15.2.186. [DOI] [PubMed] [Google Scholar]
- Preece SJ, Goulermas JY, Kenney LP, Howard D, Meijer K, Crompton R. Activity identification using body-mounted sensors--a review of classification techniques. Physiol Meas. 2009;30:R1–R33. doi: 10.1088/0967-3334/30/4/R01. [DOI] [PubMed] [Google Scholar]
- Rothney MP, Neumann M, Beziat A, Chen KY. An artificial neural network model of energy expenditure using nonintegrated acceleration signals. J Appl Physiol. 2007;103:1419–1427. doi: 10.1152/japplphysiol.00429.2007. [DOI] [PubMed] [Google Scholar]
- Staudenmayer J, Pober D, Crouter S, Bassett D, Freedson P. An artificial neural network to estimate physical activity energy expenditure and identify physical activity type from an accelerometer. J Appl Physiol. 2009;107:1300–1307. doi: 10.1152/japplphysiol.00465.2009. [DOI] [PMC free article] [PubMed] [Google Scholar]
- Stewart CL, Goody CM, Branson R. Comparison of two systems of measuring energy expenditure. JPEN J Parenter Enteral Nutr. 2005;29:212–217. doi: 10.1177/0148607105029003212. [DOI] [PubMed] [Google Scholar]
- Troiano RP, Berrigan D, Dodd KW, Masse LC, Tilert T, Mcdowell M. Physical activity in the United States measured by accelerometer. Med Sci Sports Exerc. 2008;40:181–188. doi: 10.1249/mss.0b013e31815a51b3. [DOI] [PubMed] [Google Scholar]
- Tuchinda C, Srivannaboon S, Lim HW. Photoprotection by window glass, automobile glass, and sunglasses. J Am Acad Dermatol. 2006;54:845–854. doi: 10.1016/j.jaad.2005.11.1082. [DOI] [PubMed] [Google Scholar]
- Witt JD, Fisher JR, Guenette JA, Cheong KA, Wilson BJ, Sheel AW. Measurement of exercise ventilation by a portable respiratory inductive plethysmograph. Respir Physiol Neurobiol. 2006;154:389–395. doi: 10.1016/j.resp.2006.01.010. [DOI] [PubMed] [Google Scholar]