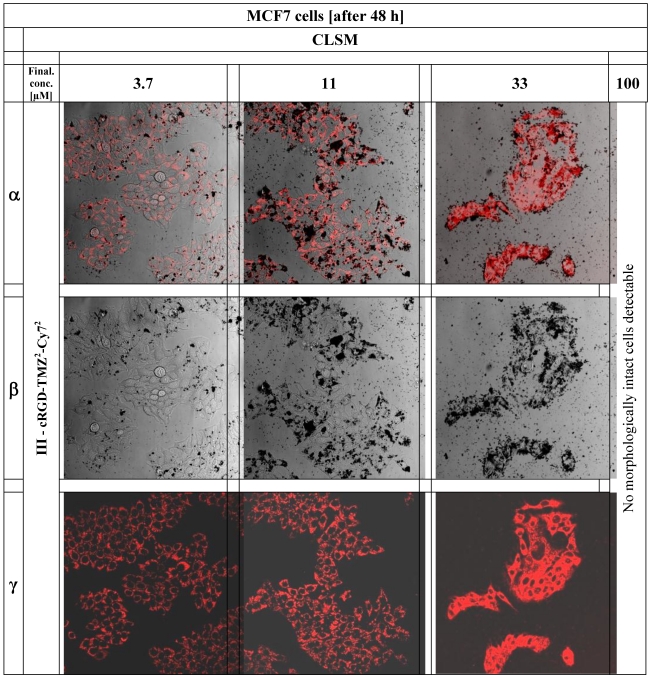
Figure 11.
The figure shows CLSM pictures of MCF7 breast cancer cells after application of cRGD-TMZ2-Cy72 (III, Table 1). The columns of the figure illustrate the increasing concentrations of cRGD-TMZ2-Cy72 from left to right: 3.7, 11, 33, and 100 µM.

