

Abstract
It is well established that bone is capable of adapting to changes in loading; however, little is known regarding how loading specifically affects the internal 3D microarchitecture of cortical bone. The aim of this study was to experimentally test the hypothesis that loading is a determinant of the 3D orientation of primary vascular canals in the rat tibial diaphysis. Left tibiae from 10 rats (30 weeks old) that had been immobilized (sciatic neurectomy) for 27 weeks, right SHAM-operated tibiae from these same rats (internal control) and right tibiae from 10 normal age-matched rats (external control) were scanned by micro-CT. Mean canal orientation (for the whole bone segment and by region), percent porosity, canal diameter and canal separation were quantitatively assessed in 3D. Canal orientation in the immobilized tibiae was significantly (P < 0.001) more radial (by 9.9°) compared to the external controls but did not differ from the internal controls (P = 0.310). Comparing the external and internal controls, orientation was significantly (P < 0.05) more radial in the internal control group (by 6.8°). No differences were found for percent porosity and canal separation. Canal diameter was significantly greater in the immobilized vs. internal (P < 0.001) and external control (P < 0.001) tibiae. The differences in orientation relative to the external controls indicated that the organization of cortical bone in the rat is affected by loading. Although the predicted difference in canal orientation was not detected between immobilized and internal control groups, the distributions of individual canal orientations, from which the mean values were derived, revealed distinctive patterns for all three groups. The internal controls exhibited an intermediate position between the immobilized and external controls, suggesting that paralysis on the contralateral side resulted in altered loading relative to the normal state represented by the external control. This was also evident in a regional analysis by quadrant. The loaded bones had the same cross-sectional shape; however, their internal structure differed. These results provide novel insights into the impact of loading on the 3D organization of primary cortical bone and have implications for understanding the relation between cortical bone adaptation, disease and mechanical properties.
Keywords: immobilization, micro-CT, orientation, rat cortical bone, vascular canals
Introduction
It has been over a century since it was first recognized that bone adapts its structure to the mechanical forces exerted upon it. In 1892, Wolff found that trabeculae within the femoral neck align in the direction of the principal stress. Since this discovery, loading has been shown to affect bone length (Howell, 1917; Steinberg & Trueta, 1981), mass (McDonald et al. 1986; Raab et al. 1991; Turner & Bell, 1986), shape (Rubin, 1984), cross-section (Bennell et al. 2002; Uhthoff & Jaworski, 1978) and strength (Järvinen et al. 2003b; Leppänen et al. 2008). Most recently, the focus of studies involving mechanical loading and bone adaptation has been on how secondary osteons are affected. Using in silico (Baca et al. 2007; Burger et al. 2003; Smit & Burger, 2000; Smit et al. 2002; van Oers et al. 2008b), histologic (Lanyon & Bourn, 1979) or ink-based (Hert et al. 1994; Petrtyl et al. 1996; Pazzaglia et al. 2008) techniques it has been found that osteons align themselves parallel to the loading direction. In regard to the effect of loading on osteon geometry, Young et al. (1986) found that an increase in strain resulted in a decrease in osteon size in monkeys. A similar finding was later reported in humans when Britz et al. (2009) showed osteon diameter to be reduced in heavier people.
Although most research in this area has focused on secondary osteons, the orientation of primary cortical structures has also been linked to loading. In 2002, de Margerie found that bones subjected to different loading patterns (strain mode) had different degrees of laminarity, where laminarity is a measure of vascular orientation and is found by dividing the area of circular (circumferential) canals by the total vascular area (de Margerie, 2002). More specifically, they found that torsional loading causes a higher degree of laminarity (more circumferential canals), whereas compression, tension or bending forces resulted in a lower degree of laminarity (more longitudinal canals). This pattern was further demonstrated in another study by de Margerie et al. (2005) where they examined how differences in torsional loading affect the vascular orientation within chicken humeri.
Most early studies in the fields of bone adaptation and bone strength focused on gross morphology, such as shape, size, mass and trabecular arrangement, due to the visualization techniques available. With the advancement of high resolution imaging technology the internal microarchitecture of cortical bone has become increasingly accessible. In 2003, Cooper et al. demonstrated that it was possible to visualize and quantify human cortical porosity in three dimensions (3D) using desktop micro-computed tomography (micro-CT). Recently, our lab found that it is possible to visualize and quantify intracortical porosity in rats using desktop micro-CT (Britz et al. 2010), which has previously only been achieved using synchrotron radiation (SR) micro-CT (Matsumoto et al. 2006, 2007). Desktop micro-CT is a far more accessible means by which to examine the effects of loading on bone adaptation from a different perspective – in 3D. To our knowledge there has not been an experimental study which has examined the effects of unloading on the 3D arrangement of the cortical canal network. Thus, the primary goal of this study was to employ desktop micro-CT technology to determine how loading affects the 3D orientation of cortical vascular canals (hereafter canals) in the rat using an immobilization (sciatic neurectomy) model.
Materials and methods
Specimens
The left tibiae from 10 Sprague–Dawley rats (30 weeks old) that had been immobilized (sciatic neurectomy) at 3 weeks of age for 27 weeks, right SHAM-operated tibiae from these same rats (internal control), and the right tibiae from 10 normal age-matched rats (external control) were utilized for this study. These specimens were derived from the same animals as a previous study conducted on the femora by one of the co-authors (T.J.) at the University of Tampere, Finland (Leppänen et al. 2010). Ethics approval for collection and study was granted by the Ethics Committee for Animal Experiments of the University of Tampere and the Provincial Government of Western Finland Department of Social Affairs and Health, Finland. For the current study, approval was also granted by the University of Saskatchewan Biomedical Research Ethics Board for this research (permit #20080050). The rats were housed in cages (16 × 27 × 42 cm), two animals per cage, at 20 °C with a light cycle of 12 h and had access to food and water ad libitum.
Micro-computed tomography
Subsamples of the tibiae were cut using an Isomet 1000 slow speed saw (Buehler, Lake Bluff, USA) at the tibia–fibula junction and immediately distal to the tibial crest. This segment of bone was soaked in 3% hydrogen peroxide for 3 days to clear the soft tissue and allowed to air dry. These samples were scanned using a SkyScan 1172 (Kontich, Belgium) x-ray microtomograph (< 5 μm x-ray source spot size; 8.83 camera pixel size). As previously described (Britz et al. 2010), the samples were rotated through 360° at rotation steps of 0.09°. The x-ray settings were standardized to 100 kV and 100 μA, with an exposure time of 0.2 s per frame. Two-frame averaging was used to improve the signal-to-noise ratio. A 1-mm-thick aluminum filter and a beam-hardening correction algorithm were employed to minimize beam-hardening artifacts. The scan time for each sample was approximately 3 h. Each scan produced 1124 contiguous slices with a nominal resolution (isotropic voxel size) of 3 μm. To reduce image noise and preserve detail in three dimensions, the image series were passed through a 3D median filter with a 3 × 3 × 3 cubic kernel. These images were analyzed using CT Analyzer 1.9.1.0 (SkyScan, Kontich, Belgium). The volume of interest contained the whole bone cross-section and was extended through 300 slices (0.9 mm). It should be mentioned that this is a small segment of bone and would not account for the possible longitudinal variation of loading along the diaphysis, which could affect the outcome of canal orientation. However, this is not a major concern in the current study as the same region of the diaphysis for each bone was analyzed, which controlled for possible variation in loading along the diaphysis. The canals were identified using a standardized global threshold and the binarized datasets were then ‘despeckled’, removing noise in the form of 3D objects that consisted of < 25 voxels. Percent porosity (canal volume fraction) and mean canal diameter were measured by methods described previously (Cooper et al. 2003). Briefly, canal diameter was measured using a model-independent distance transform based on Euclidean distance (see Jones et al. 2009; Mickel et al. 2008 for reviews) where the diameter at a specific point in the structure is the diameter of the largest sphere that can fit completely inside the 3D structure; this was first used to measure trabecular thickness in bone extensively (Hildebrand & Ruegsegger, 1997) and has since been used to measure canal diameter in cortical bone (Cooper et al. 2003). The measures of orientation were obtained by importing the micro-CT slices into amira 5.3 (Visage Imaging Inc., Berlin, Germany) where a volume render of the canals was made (Fig. 1A) and subsequently skeletonized (Fig. 1B). Each skeletonized canal was divided into 30 pixel lengths (Fig. 1C), which would be roughly comparable to a 100-μm-thick histologic section. To test whether a length of 30 pixels was adequate for measuring canal orientation, the analysis was run at 15, 30 and 45 pixel lengths for one specimen (Fig. 2). There were no differences between pixel lengths so we chose to use 30 pixels as this was roughly comparable to a 100-μm-thick histologic section. The use of smaller segments for measuring canal orientation provided a more robust procedure for considering the non-linear (curved) canals. The angle of each canal segment was measured with respect to the horizontal axis of the bone, where an angle of 0° represents a radial canal and angles approaching ± 90° are increasingly longitudinal. As we were interested in comparing radial and longitudinal orientations, the absolute value of the angle was used to calculate mean orientation. Mean canal orientation was represented by a weighted average (by canal length) to account for those canal segments shorter than 30 pixels. This length-weighted average for canal orientation also provided a more robust measure of canal orientation that was capable of compensating for cases where the canals were broken up due to imaging limitations of the micro-CT. Mean canal orientation by region was also calculated by using the imagej software platform (v1.40G, NIH; http://rsb.info.nih.gov/ij/). Built-in capabilities of imagej and a custom-written macro were employed. The middle slice from each bone scan was used to make a quadrant mask splitting each scan into anterior, lateral, medial and posterior regions (Fig. 3), using the centroid of the cross-section and anterior tibial crest as reference points. These quadrant-based subsets were employed to calculate the canal orientation for each region as described above. In addition to these measures of mean orientation, the orientations of the individual canal segments were used to calculate orientation distributions, binned in 5° intervals, for the whole sample. The plots of these distributions (Fig. 4) provided a more in-depth view of the differences underpinning the mean orientations. It should be noted that this study did not differentiate between primary and secondary vascular canals. It was assumed that the vascular canal network was dominated by primary canals, as rats have a very low rate of remodeling and a previous study from this lab (Britz et al. 2010) did not find any osteons in the ground sections.
Fig. 1.
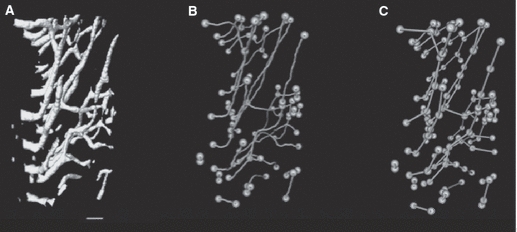
A block of bone (300 micro-CT slices) from an immobilized bone showing the canals (A), the skeletonized canals with canal endpoints and branches highlighted (B), and the sub-sampled skeletonized canal structure at 30-pixel intervals with endpoints and branches highlighted (C). Scale bar: 100 μm.
Fig. 2.
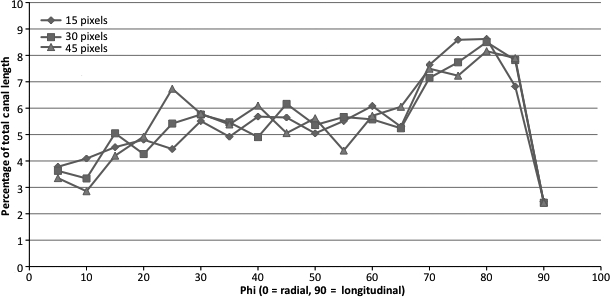
Line graph showing the percentage of total canals within 5° bins for the whole bone for segmentation done at three different pixel lengths. No significant differences were found between any of the segmentation lengths.
Fig. 3.
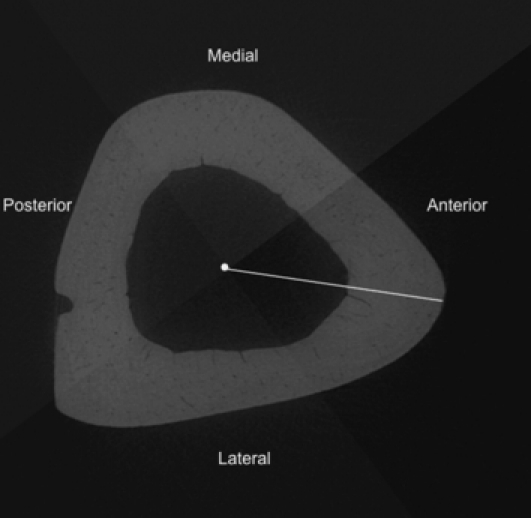
Grey scale mask applied to a micro-CT slice dividing it into anterior, lateral, medial and posterior quadrants for the regional analysis of canal orientation. The white dot represents the centroid and the line marks out the centroid to the anterior crest of the tibial cross-section.
Fig. 4.
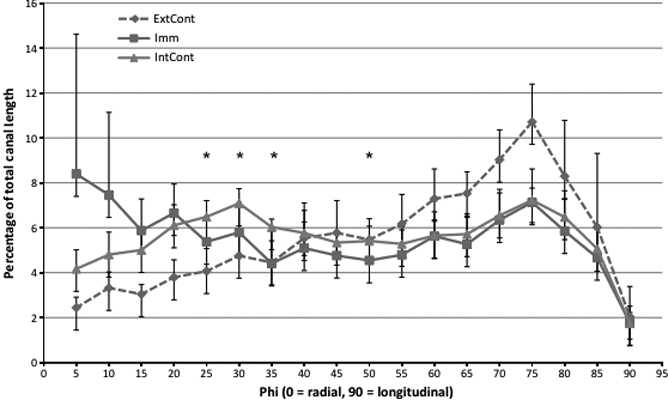
Line graph showing the percentage of total canals within 5° bins for the whole bone of each group (external control, internal control and immobilized). The average of each bin from 10 specimens from each group are presented in this graph, where *P < 0.05 for comparisons between the internal control and the immobilized. The external control line is present for a visual comparison between the three different loading conditions. Error bars signify the standard error of the mean.
Statistical analysis
All statistical analysis was performed using spss 16.0 (SPSS Inc., Chicago, IL, USA). Univariate analysis (general linear model) was employed to test for differences in canal orientation, percent porosity, canal diameter, canal separation and body weight across the three groups. This was followed by pairwise post-hoc (Bonferroni) comparisons in the event a significant difference was found among the groups. As the immobilized and internal groups were not truly independent, we also performed paired t-tests to compare all parameters for these two groups. Additionally, paired t-tests were performed on the 5° binned orientation results to further explore differences between the immobilized and internal control groups. Univariate analysis (general linear model) was employed to test for difference in canal orientation between the four regions for each of the three groups. This was followed by pairwise post-hoc (Bonferroni) comparisons in the event a significant difference was found.
Results
Qualitatively there was a readily apparent difference in the cross-sectional shape of the immobilized bones. They were more circular with a thinner cortex, whereas the external control and internal control bones were more triangular and had a thicker cortex (Fig. 5). Summary statistics can be visualized in Fig. 6. Mean canal orientation was found to be 51.3° in external control bones, 44.5° in internal control bones and 41.4° in immobilized bones. The general linear model revealed these values to be significantly different between external control and immobilized tibiae (P < 0.001) and between the external control and internal control tibiae (P < 0.05). In both cases the canals of the external control bones were oriented more longitudinally with mean differences of 9.9° and 6.8°, respectively. The difference between the immobilized and internal control tibiae was not significant using the general linear model or the paired t-test. When applied to the binned orientation data the paired t-tests showed significantly (P < 0.05) greater proportions of canals within 25°, 30°, 35° and 50° bins of the internal control tibiae (Fig. 4). In the external control the regional analysis found the canals within the posterior region had a more radial orientation than the lateral (P < 0.05) and medial (P < 0.05) regions. This held true for the internal controls as well; however, the posterior region had a significantly more radial orientation than the anterior region as well (P < 0.001). Differences between the lateral and medial regions were also found in the internal controls with the medial region having more longitudinal oriented canals (P < 0.001). No regional differences were found within the immobilized bones. The results from the regional analysis are summarized in Fig. 7 and Table 1.
Fig. 5.
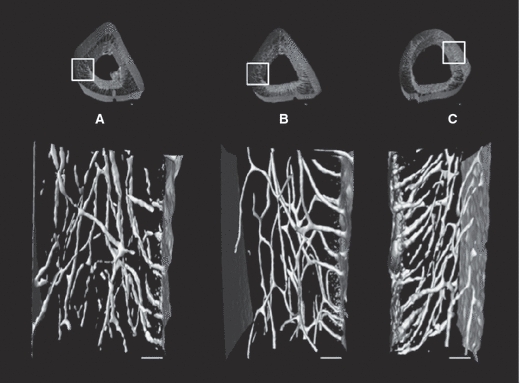
Three-dimensional renderings of 300 slices (900 microns) from longitudinal sections from the medial aspect of an external control bone (A), an internal control bone (B), and an immobilized bone (C). Bear in mind that both external and internal control bones are from the right limb (A,B) and the immobilized bone is from the left limb (C). Scale bar: 100 μm.
Fig. 6.
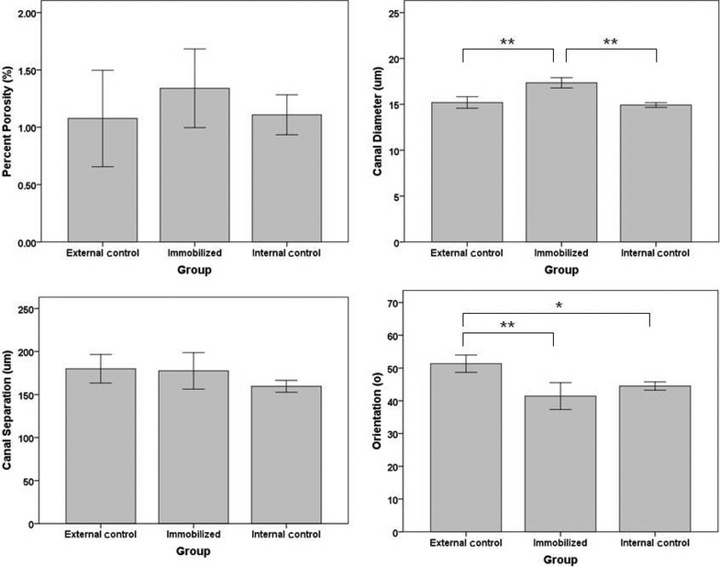
Bar graphs for percent porosity, canal diameter, canal separation and orientation are represented here. Ten bones were analyzed for each of the three groups (external control, internal control and immobilized). *P < 0.05 and **P < 0.001. Error bars represent the 95% confidence interval.
Fig. 7.
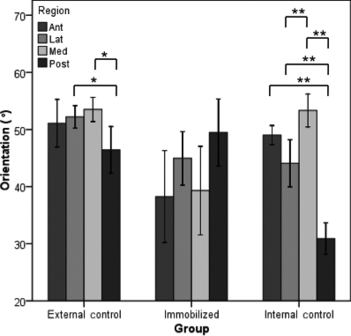
Bar graph of the mean orientation for each region (anterior, lateral, medial and posterior) of the three groups (external control, internal control and immobilized). *P < 0.05 and **P < 0.001. Error bars represent the 95% confidence interval.
Table 1.
Descriptive statistics for canal orientation (°) by region for each group where SD is the standard deviation
| Anterior | Lateral | Medial | Posterior | |||||
|---|---|---|---|---|---|---|---|---|
| Group | Mean | SD | Mean | SD | Mean | SD | Mean | SD |
| External control | 51.1 | 5.8 | 52.2 | 2.8 | 53.5 | 3.0 | 46.4 | 5.7 |
| Internal control | 49.0 | 2.3 | 44.1 | 5.8 | 53.3 | 4.0 | 30.9 | 3.8 |
| Immobilized | 38.3 | 11.2 | 45.0 | 6.6 | 39.3 | 10.9 | 49.5 | 8.2 |
The mean percent porosity was 1.3, 1.1 and 1.1% for immobilized, external control and internal control bones, respectively. Mean canal separation for these three groups was 178, 180 and 160 μm, respectively. Mean body weight was found to be 304, 305 and 304 g for these three groups, respectively. The general linear model found no differences between any of the groups for percent porosity, canal separation and body weight. With respect to canal diameter, the general linear model detected only one significant (P < 0.001) difference with the immobilized tibiae having larger canals (17 μm) when compared to external control tibia (15 μm) (Fig. 5). The canal diameter was 15 μm for both the internal control and external control tibiae.
Similarly, the paired t-test using mean results showed no significant difference between immobilized and internal control bones for percent porosity, canal separation, canal orientation or body weight. There were, however, significant differences found in canal diameter between these two groups (P < 0.001).
Discussion
There have been numerous studies that look at the effect loading has on cortical bone morphology. More specifically, how loading affects cross sectional area (Bennell et al. 2002; Uhthoff & Jaworski, 1978; Turner & Bell, 1986), cortical bone porosity (Skedros et al. 1994a,b; Steinberg & Trueta, 1981; Barth et al. 1992; Currey, 1988; Martin & Ishida, 1989; McCalden et al. 1993; Schaffler & Burr, 1988; Skedros et al. 1997; Yeni et al. 1997), the canal network (Matsumoto et al. 2006, 2007), osteon diameter (van Oers et al. 2008a,b; Britz et al. 2009; Young et al. 1986) and osteon orientation (Burger et al. 2003; Hert et al. 1994; Lanyon & Bourn, 1979; Petrtyl et al. 1996; Smit & Burger, 2000; Smit et al. 2002); however, to our knowledge none have experimentally examined how loading affects primary canal orientation in 3D. This study is thus the first of its kind to show in 3D that loading does affect cortical canal orientation during growth. Canals within the cortex of normally loaded bones (external controls) were oriented significantly more longitudinally (9.9° on average) than those found in immobilized bones (P < 0.001) (Fig. 5). Hert and Petrtyl's papers were the last to measure orientation; however, these measures were obtained using an India ink method with a focus on human secondary osteons (Hert et al. 1994; Petrtyl et al. 1996). They found that osteon orientation was relatively uniform, varying between 5° and 15° from the long axis of the bone (Hert et al. 1994). Hert et al. (1994) looked at vascular canals along with osteons, and described them as being ‘longitudinally elongated meshes’. Another study by Pazzaglia et al. (2010) found that vascular canals (both primary and secondary) had a prevailing longitudinal orientation. Similarly, we found that under normal loading conditions (external control group) primary vascular canals in the rat followed an oblique path which was significantly more longitudinal than both the immobilized and internal control limbs. While the mean orientation of the internal control limbs was not significantly different from the immobilized limbs, plots of the binned distributions of canal orientations (Fig. 4) revealed that loading was indeed having an impact. These plots had a peak at 70–75° in all groups, dominating the distribution of orientations for the external control group. In contrast, the immobilized group was characterized by higher numbers of more radially oriented canals, particularly those < 15°. The internal control group exhibited an intermediate position between these extremes, with a bimodal distribution with its second peak at 25–30°. As Fig. 4 demonstrates, this second peak resulted in significantly (P < 0.05) higher percentages of canals in the 20–35° range when compared against the immobilized group.
The intermediate position for the internal control group is likely the consequence of altered loading due to compensation for the paralysis of the contralateral limb – a phenomenon known as the ‘crutch effect’ (Dellon & Dellon, 1991; Malushte et al. 2004). Single limb nerve injury studies have found that the contralateral limb of rats undergoing this procedure encounter compensatory changes in the non-injured limb which are evident as a change in gait (Dellon & Dellon, 1991; Malushte et al. 2004) or dry bone weight (Cohen et al. 1999). This could explain both the difference we observed between the external and internal control groups as well as the lack of significance in mean orientation between the immobilized and internal control groups. The insignificant difference between the immobilized and internal control groups could be attributed to the systemic effects of the sympathetic nervous system. Sciatic neurectomy has been shown to induce bone loss in the neurectomized limb, but also in the non-neurectomized contralateral limb (Kingery et al. 2003). This study showed that cross-talk between the contralateral limbs does occur; however, whether it is attributed to the sympathetic nervous system is heavily debated. Other studies looking specifically at cortical bone have found that innervated and denervated limbs react identically to controlled loading (de Souza et al. 2005, Hert et al. 1971), indicating the sympathetic nervous system does not modulate cortical bone gain induced by loading.
It is very rare that loading results in a uniform strain mode (Cooper et al. 2008). An example of this would be, in bending, when one side of the bone is under compression the opposite side will be under tension (Petrtyl et al. 1996). This regional variation in strain mode has been found to affect canal orientation (de Margerie et al. 2002). As such, the regional differences seen in Fig. 5A,B may have been a result of the regional variation in strain mode. This may also explain why qualitatively there appeared to be less regional variation in canal orientation within the immobilized bones (Fig. 5C). We can make inferences in terms of what we would expect to see in terms of orientation by region in a loaded bone based on what we know about regional strains in other bones. The rat tibia is a curved bone with its anterior aspect being convex and posterior aspect being concave, similar to that of a sheep radius. Studies looking at sheep radii have found that convex surfaces are strained in longitudinal tension, whereas, concave surfaces are strained in longitudinal compression (Lanyon & Baggott, 1976). We would expect to see more longitudinal canals in the anterior aspect of the rat tibia since it is under tension and Hert et al. (1994) have found that compression results in more oblique osteons than tension does. We would also expect to find more radial canals in the medial and lateral aspects of the bone since the neutral axis should pass through these regions since it separates areas in compression from those in tension (Peterman et al. 2001; Sonoda et al. 2003). In our regional analysis we found that in loaded bones the posterior region was less longitudinally oriented than the anterior region which is in agreement with what was suggested by Hert et al. (1994); however this difference was only significant in the internal control bones (P < 0.001). Both groups of loaded bones (external and internal controls) have a similar cross sectional shape (Fig. 5); however, the regional analysis for each group is quite different (Fig. 7). This further suggests that the type of loading and therefore the different strains experienced around the diaphysis affected the canal orientations. Evidence of these differing strain modes around the diaphysis experienced in these two groups can be seen if you compare the posterior regions. The canals within the internal control bones seemed to have a more radial orientation in the posterior region than the canals within the external control bones (Fig. 7). One of the limitations of this study was that the strain modes were not measured around the diaphysis of the bones in each group which would have provided us with the information that altered loading causes different strain modes at differing regions around the diaphysis which in turn would be responsible for the differences seen between these two groups. A study looking at canal orientation by region including measurements of strain mode would confirm this as well as shed light on which strains are responsible for a more longitudinal vs. radial canal orientation. The findings from such a study would also provide a better understanding of how loading is affecting bone microarchitecture and may shed further light on the distributions of canal orientations depicted in Fig. 4.
Growth rate has been known to affect the primary microarchitecture of bone (Castanet et al. 1996, 2000); however, a more recent study has shown that canal orientation is quite independent of growth rate (de Margerie et al. 2002). It has since been speculated that changes in canal orientation are more likely to reflect the bone's need to resist specific loads (de Margerie, 2002; Swartz et al. 1992). This is supported by our finding of different canal orientations in loaded vs. unloaded bones. The predominant longitudinal orientation of the loaded bones in our study could be an adaptation to resist the shear stresses that are experienced by the tibia. The canals in the immobilized bones were more radial – suggesting this pattern arises in the absence of the stresses experienced during normal loading. The bones from the internal control group were significantly less longitudinal than the external control group but more longitudinal (difference not significant) than the immobilized bones. This may be due to a reduction in overall activity of the rats, causing the internal control limb as well as the immobilized limb to experience disuse. This coupled with the possibility of the internal control bone experiencing an altered loading condition due to the need to compensate for the loss of the contralateral limb's function (Dellon & Dellon, 1991; Malushte et al. 2004) could explain why there is a difference between the external and internal control bones but not between the internal control and immobilized bones. Figure 4 supports the interpretation that such compensation did indeed affect the internal controls since their distribution of orientations was intermediate between that of the external control and the immobilized group. Figure 7 shows differences in the regional variation in canal orientations between the two loaded groups (external and internal controls) which supports the notion of the internal control bones having an altered loading condition possibly due to compensating for the immobilized limb.
If the differences in orientation we observed do indeed reflect a functional adaptation it would suggest some means of mechanosensation is utilized to control the incorporation of vasculature within bone during growth. Several studies have looked at the potential role of mechanosensation (e.g. based upon strain and fluid flow) in determining secondary osteon orientation (Burger et al. 2003; Smit et al. 2002; van Oers et al. 2008a); however, orientation of secondary structures is based upon the paths of osteoclastic cutting cones and thus represents a very different phenomenon. To our knowledge no study has looked at whether or not mechanosensation is a driving force behind primary canal orientation which is established as a bone grows. Our experimental design did not allow us to look at the possible differences between growth rate and/or factors related to mechanosensation. Assessing the degree to which these factors do or do not contribute to canal orientation is worthy of further study.
Previously, it has been shown that loading has a positive effect on bone strength (Bagi et al. 1993; Verhaeghe et al. 2000; Bennell et al. 2002; Notomi et al. 2000; Raab et al. 1991). Experiments where the subjects were exercised found that exercise increased strength by changing bone geometry (cross sectional area), cortical bone thickness and area (Bell et al. 1980; Bennell et al. 2002; Woo et al. 1981; Järvinen et al. 2003a,b; Leppänen et al. 2008; Pajamaki et al. 2003). Microarchitectural changes within cortical bone such as, osteon area (Evans & Bang, 1967; Evans & Vincentelli, 1974), osteon density (Evans & Vincentelli, 1974; Vincentelli & Grigorov, 1985; Yeni et al. 1997) and intracortical porosity (Barth et al. 1992; Currey, 1988; Martin & Ishida, 1989; McCalden et al. 1993; Schaffler & Burr, 1988; Skedros et al. 1997; Yeni et al. 1997) were found to accompany these gross morphologic changes. More recently, canal orientation has been added to this list. Mullins et al. (2007) found that variation in canal orientation (Haversian and Volkmann canals) caused up to a 20% decrease in longitudinal shear modulus, and therefore bone strength. Bone strength testing was not within the scope of the present study; however, according to the aforementioned study by Mullins et al. (2007), we would expect that immobilized bones would be weaker than external control bones due to their differing canal orientations.
Our results revealed that loading affects the 3D orientation of vascular canals within rat cortical bone. This could contribute, at least in part, to the positive effect loading has on bone strength (Bagi et al. 1993; Verhaeghe et al. 2000; Bennell et al. 2002; Notomi et al. 2000; Raab et al. 1991). We also found there to be a significant difference in canal diameter between external control and immobilized bones and internal control and immobilized bones. The literature suggests that canal diameter may also affect bone strength (Sevostianov & Kachanov, 2000; Yeni et al. 1997). Whereby, larger canals cause the bone to be weaker. Our results indicate that cortical bone in the rat has a highly variable microarchitecture which is directly affected by mechanical stimuli. We hypothesize that the variation in cortical bone microarchitecture reflects a functional adaptation aimed at improving bone's ability to endure loading.
Concluding remarks
The finding that loading affects canal orientation has implications for studies focusing on the mechanical properties of bone, and will ultimately lead to advancements in the understanding of bone adaptation, aging and disease. Further studies are also needed to clarify whether mechanotransduction and/or growth rate is the primary determinant of canal orientation.
Acknowledgments
The primary financial support for this specific research project was from the Natural Science and Engineering Research Council of Canada in the form of a Discovery Grant (353618-2008) to DMLC and an Alexander Graham Bell Canada Graduate Scholarship (394626-2010) to HMB.
References
- Baca V, Kachlik D, Horak Z, et al. The course of osteons in the compact bone of the human proximal femur with clinical and biomechanical significance. Surg Radiol Anat. 2007;29:201–207. doi: 10.1007/s00276-007-0192-6. [DOI] [PubMed] [Google Scholar]
- Bagi CM, Mecham M, Weiss J, et al. Comparative morphometric changes in rat cortical bone following ovariectomy and/or immobilization. Bone. 1993;14:877–883. doi: 10.1016/8756-3282(93)90318-5. [DOI] [PubMed] [Google Scholar]
- Barth RW, Williams JL, Kaplan FS. Osteon morphometry in females with femoral neck fractures. Clin Orthop Relat Res. 1992;283:178–186. [PubMed] [Google Scholar]
- Bell RR, Tzeng DY, Draper HH. Long-term effects of calcium, phosphorus and forced exercise on the bones of mature mice. J Nutr. 1980;110:1161–1168. doi: 10.1093/jn/110.6.1161. [DOI] [PubMed] [Google Scholar]
- Bennell KL, Khan KM, Warmington S, et al. Age does not influence the bone response to treadmill exercise in female rats. Med Sci Sports Exerc. 2002;34:1958–1965. doi: 10.1097/00005768-200212000-00015. [DOI] [PubMed] [Google Scholar]
- Britz HM, Thomas CD, Clement JG, et al. The relation of femoral osteon geometry to age, sex, height and weight. Bone. 2009;45:77–83. doi: 10.1016/j.bone.2009.03.654. [DOI] [PubMed] [Google Scholar]
- Britz HM, Jokihaara J, Leppanen OV, et al. 3D visualization and quantification of rat cortical bone porosity using a desktop micro-CT system: a case study in the tibia. J Microsc. 2010;240:32–37. doi: 10.1111/j.1365-2818.2010.03381.x. [DOI] [PubMed] [Google Scholar]
- Burger EH, Klein-Nulend J, Smit TH. Strain-derived canalicular fluid flow regulates osteoclast activity in a remodelling osteon – a proposal. J Biomech. 2003;36:1453–1459. doi: 10.1016/s0021-9290(03)00126-x. [DOI] [PubMed] [Google Scholar]
- Castanet J, Grandin A, Abourachid A, et al. [Expression of growth dynamic in the structure of periosteal bone in Anas platyrhynchos] C R Acad Sci III. 1996;319:301–308. [PubMed] [Google Scholar]
- Castanet J, Rogers KC, Cubo J, et al. Periosteal bone growth rates in extant ratites (ostrich and emu). Implications for assessing growth in dinosaurs. C R Acad Sci III. 2000;323:543–550. doi: 10.1016/s0764-4469(00)00181-5. [DOI] [PubMed] [Google Scholar]
- Cohen I, Bogin E, Chechick A, et al. The effect of single hind-limb immobilization on the contralateral limb in the rat: a morphometric and biochemical study. Am J Orthop (Belle Mead NJ) 1999;28:706–708. [PubMed] [Google Scholar]
- Cooper DM, Turinsky AL, Sensen CW, et al. Quantitative 3D analysis of the canal network in cortical bone by micro-computed tomography. Anat Rec B New Anat. 2003;274:169–179. doi: 10.1002/ar.b.10024. [DOI] [PubMed] [Google Scholar]
- Cooper DM, Ahamed Y, Macdonald HM, et al. Characterising cortical density in the mid-tibia: intra-individual variation in adolescent girls and boys. Br J Sports Med. 2008;42:690–695. doi: 10.1136/bjsm.2008.049528. [DOI] [PubMed] [Google Scholar]
- Currey JD. The effect of porosity and mineral content on the Young's modulus of elasticity of compact bone. J Biomech. 1988;21:131–139. doi: 10.1016/0021-9290(88)90006-1. [DOI] [PubMed] [Google Scholar]
- Dellon ES, Dellon AL. Functional assessment of neurologic impairment: track analysis in diabetic and compression neuropathies. Plast Reconstr Surg. 1991;88:686–694. doi: 10.1097/00006534-199110000-00020. [DOI] [PubMed] [Google Scholar]
- Evans FG, Bang S. Differences and relationships between physical properties and microscopic structure of human femoral tibial and fibular cortical bone. Am J Anat. 1967;120:79–88. [Google Scholar]
- Evans FG, Vincentelli R. Relations of the compressive properties of human cortical bone to histological structure and calcification. J Biomech. 1974;7:1–10. doi: 10.1016/0021-9290(74)90064-5. [DOI] [PubMed] [Google Scholar]
- Hert J, Sklenska A, Liskova M. Reaction of bone to mechanical stimuli. 5. Effect of intermittent stress on the rabbit tibia after resection of the peripheral nerves. Folia Morphol (Praha) 1971;19:378–387. [PubMed] [Google Scholar]
- Hert J, Fiala P, Petrtyl M. Osteon orientation of the diaphysis of the long bones in man. Bone. 1994;15:269–277. doi: 10.1016/8756-3282(94)90288-7. [DOI] [PubMed] [Google Scholar]
- Hildebrand T, Ruegsegger P. A new method for the model-independent assessment of thickness in three-dimensional images. J Microsc-Oxford. 1997;185:67–75. [Google Scholar]
- Howell JA. An experimental study of the effect of stress and strain on bone development. Anat Rec. 1917;13:233–252. [Google Scholar]
- Järvinen TL, Kannus P, Pajamaki I, et al. Estrogen deposits extra mineral into bones of female rats in puberty, but simultaneously seems to suppress the responsiveness of female skeleton to mechanical loading. Bone. 2003a;32:642–651. doi: 10.1016/s8756-3282(03)00100-5. [DOI] [PubMed] [Google Scholar]
- Järvinen TL, Pajamaki I, Sievanen H, et al. Femoral neck response to exercise and subsequent deconditioning in young and adult rats. J Bone Miner Res. 2003b;18:1292–1299. doi: 10.1359/jbmr.2003.18.7.1292. [DOI] [PubMed] [Google Scholar]
- Jones AC, Arns CH, Hutmacher DW, et al. The correlation of pore morphology, interconnectivity and physical properties of 3D ceramic scaffolds with bone ingrowth. Biomaterials. 2009;30:1440–1451. doi: 10.1016/j.biomaterials.2008.10.056. [DOI] [PubMed] [Google Scholar]
- Kingery WS, Offley SC, Guo TZ, et al. A substance P receptor (NK1) antagonist enhances the widespread osteoporotic effects of sciatic nerve section. Bone. 2003;33:927–936. doi: 10.1016/j.bone.2003.07.003. [DOI] [PubMed] [Google Scholar]
- Lanyon LE, Baggott DG. Mechanical function as an influence on the structure and form of bone. J Bone Joint Surg Br. 1976;58-B:436–443. doi: 10.1302/0301-620X.58B4.1018029. [DOI] [PubMed] [Google Scholar]
- Lanyon LE, Bourn S. The influence of mechanical function on the development and remodeling of the tibia. An experimental study in sheep. J Bone Joint Surg Am. 1979;61:263–273. [PubMed] [Google Scholar]
- Leppänen OV, Sievanen H, Jokihaara J, et al. Pathogenesis of age-related osteoporosis: impaired mechano-responsiveness of bone is not the culprit. PLoS ONE. 2008;3:e2540. doi: 10.1371/journal.pone.0002540. [DOI] [PMC free article] [PubMed] [Google Scholar]
- Leppänen OV, Sievanen H, Jokihaara J, et al. The effects of loading and estrogen on rat bone growth. J Appl Physiol. 2010;108:1737–1744. doi: 10.1152/japplphysiol.00989.2009. [DOI] [PubMed] [Google Scholar]
- Malushte TS, Kerns JM, Huang CC, et al. Assessment of recovery following a novel partial nerve lesion in a rat model. Muscle Nerve. 2004;30:609–617. doi: 10.1002/mus.20152. [DOI] [PubMed] [Google Scholar]
- de Margerie E. Laminar bone as an adaptation to torsional loads in flapping flight. J Anat. 2002;201:521–526. doi: 10.1046/j.1469-7580.2002.00118.x. [DOI] [PMC free article] [PubMed] [Google Scholar]
- de Margerie E, Cubo J, Castanet J. Bone typology and growth rate: testing and quantifying ‘Amprino's rule’ in the mallard (Anas platyrhynchos) C R Biol. 2002;325:221–230. doi: 10.1016/s1631-0691(02)01429-4. [DOI] [PubMed] [Google Scholar]
- de Margerie E, Sanchez S, Cubo J, et al. Torsional resistance as a principal component of the structural design of long bones: comparative multivariate evidence in birds. Anat Rec A Discov Mol Cell Evol Biol. 2005;282:49–66. doi: 10.1002/ar.a.20141. [DOI] [PubMed] [Google Scholar]
- Martin RB, Ishida J. The relative effects of collagen fiber orientation, porosity, density, and mineralization on bone strength. J Biomech. 1989;22:419–426. doi: 10.1016/0021-9290(89)90202-9. [DOI] [PubMed] [Google Scholar]
- Matsumoto T, Yoshino M, Asano T, et al. Monochromatic synchrotron radiation muCT reveals disuse-mediated canal network rarefaction in cortical bone of growing rat tibiae. J Appl Physiol. 2006;100:274–280. doi: 10.1152/japplphysiol.00495.2005. [DOI] [PubMed] [Google Scholar]
- Matsumoto T, Yoshino M, Uesugi K, et al. Biphasic change and disuse-mediated regression of canal network structure in cortical bone of growing rats. Bone. 2007;41:239–246. doi: 10.1016/j.bone.2007.04.192. [DOI] [PubMed] [Google Scholar]
- McCalden RW, McGeough JA, Barker MB, et al. Age-related changes in the tensile properties of cortical bone. The relative importance of changes in porosity, mineralization, and microstructure. J Bone Joint Surg Am. 1993;75:1193–1205. doi: 10.2106/00004623-199308000-00009. [DOI] [PubMed] [Google Scholar]
- McDonald R, Hegenauer J, Saltman P. Age-related differences in the bone mineralization pattern of rats following exercise. J Gerontol. 1986;41:445–452. doi: 10.1093/geronj/41.4.445. [DOI] [PubMed] [Google Scholar]
- Mickel W, Munster S, Jawerth LM, et al. Robust pore size analysis of filamentous networks from three-dimensional confocal microscopy. Biophys J. 2008;95:6072–6080. doi: 10.1529/biophysj.108.135939. [DOI] [PMC free article] [PubMed] [Google Scholar]
- Mullins LP, McGarry JP, Bruzzi MS, et al. Micromechanical modelling of cortical bone. Comput Methods Biomech Biomed Engin. 2007;10:159–169. doi: 10.1080/10255840601110802. [DOI] [PubMed] [Google Scholar]
- Notomi T, Lee SJ, Okimoto N, et al. Effects of resistance exercise training on mass, strength, and turnover of bone in growing rats. Eur J Appl Physiol. 2000;82:268–274. doi: 10.1007/s004210000195. [DOI] [PubMed] [Google Scholar]
- van Oers RF, Ruimerman R, Tanck E, et al. A unified theory for osteonal and hemi-osteonal remodeling. Bone. 2008a;42:250–259. doi: 10.1016/j.bone.2007.10.009. [DOI] [PubMed] [Google Scholar]
- van Oers RF, Ruimerman R, van Rietbergen B, et al. Relating osteon diameter to strain. Bone. 2008b;43:476–482. doi: 10.1016/j.bone.2008.05.015. [DOI] [PubMed] [Google Scholar]
- Pajamaki I, Kannus P, Vuohelainen T, et al. The bone gain induced by exercise in puberty is not preserved through a virtually life-long deconditioning: a randomized controlled experimental study in male rats. J Bone Miner Res. 2003;18:544–552. doi: 10.1359/jbmr.2003.18.3.544. [DOI] [PubMed] [Google Scholar]
- Pazzaglia UE, Bonaspetti G, Ranchetti F, et al. A model of the intracortical vascular system of long bones and of its organization: an experimental study in rabbit femur and tibia. J Anat. 2008;213:183–193. doi: 10.1111/j.1469-7580.2008.00932.x. [DOI] [PMC free article] [PubMed] [Google Scholar]
- Pazzaglia UE, Zarattini G, Giacomini D, et al. Morphometric analysis of the canal system of cortical bone: an experimental study in the rabbit femur carried out with standard histology and micro-CT. Anat Histol Embryol. 2010;39:17–26. doi: 10.1111/j.1439-0264.2009.00973.x. [DOI] [PubMed] [Google Scholar]
- Peterman MM, Hamel AJ, Cavanagh PR, et al. In vitro modeling of human tibial strains during exercise in micro-gravity. J Biomech. 2001;34:693–698. doi: 10.1016/s0021-9290(01)00004-5. [DOI] [PubMed] [Google Scholar]
- Petrtyl M, Hert J, Fiala P. Spatial organization of the haversian bone in man. J Biomech. 1996;29:161–169. doi: 10.1016/0021-9290(94)00035-2. [DOI] [PubMed] [Google Scholar]
- Raab DM, Crenshaw TD, Kimmel DB, et al. A histomorphometric study of cortical bone activity during increased weight-bearing exercise. J Bone Miner Res. 1991;6:741–749. doi: 10.1002/jbmr.5650060712. [DOI] [PubMed] [Google Scholar]
- Rubin CT. Skeletal strain and the functional significance of bone architecture. Calcif Tissue Int. 1984;36(Suppl 1):S11–S18. doi: 10.1007/BF02406128. [DOI] [PubMed] [Google Scholar]
- Schaffler MB, Burr DB. Stiffness of compact bone: effects of porosity and density. J Biomech. 1988;21:13–16. doi: 10.1016/0021-9290(88)90186-8. [DOI] [PubMed] [Google Scholar]
- Sevostianov I, Kachanov M. Impact of the porous microstructure on the overall elastic properties of the osteonal cortical bone. J Biomech. 2000;33:881–888. doi: 10.1016/s0021-9290(00)00031-2. [DOI] [PubMed] [Google Scholar]
- Skedros JG, Bloebaum RD, Mason MW, et al. Analysis of a tension/compression skeletal system: possible strain-specific differences in the hierarchical organization of bone. Anat Rec. 1994a;239:396–404. doi: 10.1002/ar.1092390406. [DOI] [PubMed] [Google Scholar]
- Skedros JG, Mason MW, Bloebaum RD. Differences in osteonal micromorphology between tensile and compressive cortices of a bending skeletal system: indications of potential strain-specific differences in bone microstructure. Anat Rec. 1994b;239:405–413. doi: 10.1002/ar.1092390407. [DOI] [PubMed] [Google Scholar]
- Skedros JG, Su SC, Bloebaum RD. Biomechanical implications of mineral content and microstructural variations in cortical bone of horse, elk, and sheep calcanei. Anat Rec. 1997;249:297–316. doi: 10.1002/(SICI)1097-0185(199711)249:3<297::AID-AR1>3.0.CO;2-S. [DOI] [PubMed] [Google Scholar]
- Smit TH, Burger EH. Is BMU-coupling a strain-regulated phenomenon? A finite element analysis. J Bone Miner Res. 2000;15:301–307. doi: 10.1359/jbmr.2000.15.2.301. [DOI] [PubMed] [Google Scholar]
- Smit TH, Burger EH, Huyghe JM. A case for strain-induced fluid flow as a regulator of BMU-coupling and osteonal alignment. J Bone Miner Res. 2002;17:2021–2029. doi: 10.1359/jbmr.2002.17.11.2021. [DOI] [PubMed] [Google Scholar]
- Sonoda N, Chosa E, Totoribe K, et al. Biomechanical analysis for stress fractures of the anterior middle third of the tibia in athletes: nonlinear analysis using a three-dimensional finite element method. J Orthop Sci. 2003;8:505–513. doi: 10.1007/s00776-003-0671-5. [DOI] [PubMed] [Google Scholar]
- de Souza RL, Pitsillides AA, Lanyon LE, et al. Sympathetic nervous system does not mediate the load-induced cortical new bone formation. J Bone Miner Res. 2005;20:2159–2168. doi: 10.1359/JBMR.050812. [DOI] [PubMed] [Google Scholar]
- Steinberg ME, Trueta J. Effects of activity on bone growth and development in the rat. Clin Orthop Relat Res. 1981;156:52–60. [PubMed] [Google Scholar]
- Swartz SM, Bennett MB, Carrier DR. Wing bone stresses in free flying bats and the evolution of skeletal design for flight. Nature. 1992;359:726–729. doi: 10.1038/359726a0. [DOI] [PubMed] [Google Scholar]
- Turner RT, Bell NH. The effects of immobilization on bone histomorphometry in rats. J Bone Miner Res. 1986;1:399–407. doi: 10.1002/jbmr.5650010504. [DOI] [PubMed] [Google Scholar]
- Uhthoff HK, Jaworski ZF. Bone loss in response to long-term immobilisation. J Bone Joint Surg Br. 1978;60-B:420–429. doi: 10.1302/0301-620X.60B3.681422. [DOI] [PubMed] [Google Scholar]
- Verhaeghe J, Thomsen JS, van Bree R, et al. Effects of exercise and disuse on bone remodeling, bone mass, and biomechanical competence in spontaneously diabetic female rats. Bone. 2000;27:249–256. doi: 10.1016/s8756-3282(00)00308-2. [DOI] [PubMed] [Google Scholar]
- Vincentelli R, Grigorov M. The effect of Haversian remodeling on the tensile properties of human cortical bone. J Biomech. 1985;18:201–207. doi: 10.1016/0021-9290(85)90205-2. [DOI] [PubMed] [Google Scholar]
- Wolff J. Das Gesetz der Transformation der Knochen. Berlin: Springer Verlag; 1892. [Google Scholar]
- Woo SL, Kuei SC, Amiel D, et al. The effect of prolonged physical training on the properties of long bone: a study of Wolff's Law. J Bone Joint Surg Am. 1981;63:780–787. [PubMed] [Google Scholar]
- Yeni YN, Brown CU, Wang Z, et al. The influence of bone morphology on fracture toughness of the human femur and tibia. Bone. 1997;21:453–459. doi: 10.1016/s8756-3282(97)00173-7. [DOI] [PubMed] [Google Scholar]
- Young DR, Niklowitz WJ, Brown RJ, et al. Immobilization-associated osteoporosis in primates. Bone. 1986;7:109–117. doi: 10.1016/8756-3282(86)90682-4. [DOI] [PubMed] [Google Scholar]