

Abstract
Rubisco, the most abundant enzyme on the Earth and responsible for all photosynthetic carbon fixation, is often thought of as a highly conserved and sluggish enzyme. Yet, different algal Rubiscos demonstrate a range of kinetic properties hinting at a history of evolution and adaptation. Here, we show that algal Rubisco has indeed evolved adaptively during ancient and distinct geological periods. Using DNA sequences of extant marine algae of the red and Chromista lineage, we define positive selection within the large subunit of Rubisco, encoded by rbcL, to occur basal to the radiation of modern marine groups. This signal of positive selection appears to be responding to changing intracellular concentrations of carbon dioxide (CO2) triggered by physiological adaptations to declining atmospheric CO2. Within the ecologically important Haptophyta (including coccolithophores) and Bacillariophyta (diatoms), positive selection occurred consistently during periods of falling Phanerozoic CO2 and suggests emergence of carbon-concentrating mechanisms. During the Proterozoic, a strong signal of positive selection after secondary endosymbiosis occurs at the origin of the Chromista lineage (approx. 1.1 Ga), with further positive selection events until 0.41 Ga, implying a significant and continuous decrease in atmospheric CO2 encompassing the Cryogenian Snowball Earth events. We surmise that positive selection in Rubisco has been caused by declines in atmospheric CO2 and hence acts as a proxy for ancient atmospheric CO2.
Keywords: Rubisco, adaptive evolution, algae, palaeoclimate, carbon dioxide
1. Introduction
The living ecosystem and carbon dioxide (CO2) and oxygen (O2) levels in the atmosphere are inexorably linked through tight feedback mechanisms. The advent of oxygenic photosynthesis around 2.4 Ga increased atmospheric and surface ocean O2 levels and reduced atmospheric CO2. However, O2 levels remained low for the next billion years despite declining CO2 [1], partly attributed to anoxygenic photosynthesis preventing oxygenation of the deep ocean [2]. It was not until the Neoproterozoic when oxygenic photosynthesis became dominant, hypothesized to contribute to the second rise of O2 which paved the way for evolution of complex multi-cellular life [1].
Biological innovations certainly exert an influence on the atmosphere, but atmospheric composition also drives biological adaptations. The rate-limiting step of photosynthesis, CO2 fixation, is catalysed by the enzyme, ribulose-1,5-bisphosphate carboxylase/oxygenase (Rubisco, EC 4.1.1.39). During oxygenic photosynthesis, Rubisco catalyses the two competitive reactions: CO2 fixation for photosynthesis (carboxylation) and energy-wasting photorespiration using O2 (oxygenation). The ability of a particular Rubisco to discriminate between non-polar, structurally similar substrates of CO2 and O2 is determined by the kinetic properties of Rubisco and the CO2 and O2 concentrations at the catalytic site of the enzyme, denoted as the specificity factor (Ω) [3]:
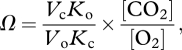 |
where Vc and Vo are maximal velocities of the carboxylase and oxygenase reactions and Kc and Ko are the Michaelis constants for CO2 and O2. Thermodynamic constraints dictate a trade-off between carboxylation velocity (Vc) and affinity for CO2 that has led to suggestions that despite being conserved and sluggish, Rubisco is optimized to its physical environment [4]. The variation in Rubisco catalytic properties found within photosynthetic eukaryotes hints that it has undergone adaptations to low CO2 [5–8], but little is known about the detailed timing of evolution of Rubisco and its relationship to the environmental change.
We aim to define the history of adaptation of Rubisco in red and Chromista algae. Our study focused on these oxygenic photosynthesizing algae because they all possess a red chloroplast containing the same Form 1D Rubisco [9]. Their chloroplast evolutionary history stemmed from a primary endosymbiotic event that resulted in the red algae (Rhodophyta and Cyanidiales), and subsequent secondary endosymbiosis to form the Chromalveolata [10]. Chromalveolata includes the Chromista (Haptophyta, Stramenopiles and Cryptophyta) [11] and the Alveolata. However, as there is debate on the plastid monophyly of the Chromalveolata (for review, see Keeling [12]), we focused only on the Chromista which have a well-supported single secondary endosymbiotic origin of their plastids [13]. Furthermore, many representatives of the Chromista algae, such as diatoms and Haptophyta, dominate the modern ocean and display an extensive fossil history [14,15], making it possible to date the periods of adaptive evolution in Rubisco. Form 1D Rubisco protein is made up of eight large and eight small subunits. The active sites of Rubisco are formed by large subunits which are encoded by the chloroplast gene rbcL.
To infer adaptation of Rubisco, we reconstructed the chloroplast evolutionary history of the red and Chromista algae as a template on which we identified positive selection in rbcL by applying phylogenetic analysis of maximum likelihood (PAML) [16]. PAML identifies positive selection by comparing the substitution rates of mutations that do and do not affect protein sequence (dN and dS, respectively) along a phylogeny. The former is likely to affect the survival of the organism, whereas the latter is neutral, or nearly neutral; so dN/dS > 1, dN/dS = 1 and dN/dS < 1 indicate positive, neutral and purifying selection, respectively. Bayesian tree reconstruction and dating were conducted using a number of fossil calibrations, allowing the timing of adaptive events to be constrained between branch nodes providing an evolutionary history to around 1.5 Ga.
2. Material and methods
(a). DNA extraction and amplification of rbcL
DNA was extracted from Haptophyta and diatom cultures maintained at Marine Biological Association, Plymouth, UK using previously published methods [17]. About 95 per cent length of the coding region of the chloroplast rbcL gene was PCR amplified using Biomix (Bioline, MA, USA) and primers (electronic supplementary material, table S1), and the following PCR conditions: initial cycle of 95°C for 2 min, 55°C for 30 s, 72°C for 30 s followed by 40 cycles of 92°C for 30 s, 53°C for 30 s and 72°C for 3 min, with final elongation of 72°C for 10 min. DNA sequencing was performed using ABI BigDye v. 3.1 and capillary sequencers 3700 and 3730xl (Applied Biosystems Inc., CA, USA). Sequences of the rbcL gene for 17 species were uploaded to NCBI GenBank under accession numbers HQ656822–HQ656838. The new rbcL sequences were combined with a further 227 rbcL sequences from NCBI GenBank (electronic supplementary material, table S2) and aligned using ClustalX [18], followed by minor manual editing of the alignment and assignment of coding region using ProSeq3 [19].
(b). Phylogenetic and molecular clock analysis
The phylogeny shown in figure 1 was reconstructed using four plastid protein-coding genes used by Yoon et al. [22] with a few changes: removal or replacement of species owing to short or poor quality rbcL sequences and additional sequences of heterokonts, Haptophyta and coralline red algae. The Haptophyta tree (electronic supplementary material, figure S1) was reconstructed only using rbcL sequences. The diatom tree (electronic supplementary material, figure S2) was constructed with the 18S rRNA and rbcL genes. Bayesian tree reconstruction and dating were conducted using BEAST software [23]. The calibration constraints used for each tree are summarized in electronic supplementary material, table S3 [13–15,24–26]. Phylogeny reconstruction assumed the general time-reversible substitution model [27] with gamma-distributed rate heterogeneity. For protein-coding genes, we assumed separate rates for the three codon positions. We conducted runs with chain lengths of 5 × 10⁷ to 108 steps assuming the Yule model of speciation process and both clock and uncorrelated lognormal-relaxed clock across the tree [28,29] with similar results. Given the standard deviation of the uncorrelated lognormal-relaxed clock (ucld.stdev parameter) was consistently below 1, the data appeared to fit the molecular clock model quite well, hence the latter was used for dating of individual nodes. The convergence of parameter estimates was checked using Tracer [30]. The data were saved every 103 steps and the first 5 × 10³ trees were ignored as a burn-in. TreeAnnotator v. 1.5.4 was used to summarize the post-burn-in trees, and the maximum credibility tree along with 95% probability density of ages was visualized in FigTree v. 1.3.1 [31].
Figure 1.

(a) RbcL phylogeny of red and Chromista algae with branches under positive selection (magenta) and those with no evidence for positive selection in Rubisco (black). Black italic numbers along branches are p-values for the probability of likelihood-ratio test values being as high as is seen by chance (see §2). Grey numbers are posterior probability values for individual nodes. Date estimates of nodes with grey bars denoting 95% probability density and yellow diamonds with corresponding letter are fossil calibration dates (electronic supplementary material, table S3). (b) Available measurements of Rubisco specificity factors (Ω; light blue bars) [4,6,20] and Kc (dark blue bars) [6,21] with standard error bars and number of species measured (n) are shown.
(c). Phylogenetic analysis of maximum likelihood
Detection of positive selection in the rbcL gene was conducted using nested maximum-likelihood models A and A1 allowing for variation in the ratio of non-synonymous to synonymous substitution rates (dN/dS) across codons and across branches implemented in PAML v. 4 [16]. The analysis was conducted assuming the phylogenies in figure 1 and electronic supplementary material, figures S1 and S2. The null model A1 allows dN/dS ratios to vary both among sites and among branches; it allows 0 < dN/dS < 1 and dN/dS = 1 for both foreground and background branches, and also two additional classes of codons with fixed dN/dS = 1 on foreground branches while restricted as 0 < dN/dS < 1 and dN/dS = 1 on background branches. The alternative A model allows 0 < dN/dS < 1 and dN/dS = 1 for both foreground and background branches, and also two additional classes of codons under positive selection with dN/dS > 1 on foreground branches while restricted as 0 < dN/dS < 1 and dN/dS = 1 on background branches. One branch at a time was labelled as a foreground branch with allowed positive selection, whereas all other branches were labelled as background branches with no positive selection allowed. Likelihood-ratio tests (LRTs) were repeated with a different branch labelled as a foreground branch until all branches had been tested [32,33]. The significance of the A/A1 LRTs was calculated assuming that twice the difference in the log of maximum likelihood between the two models was distributed as a chi-square distribution with one degree of freedom. The Bonferroni correction procedure implemented in SISA-Binomial [34] was used to correct the statistical significance for multiple comparisons.
These tests were applied to three datasets, red and Chromista algae, Haptophyta and diatoms, consisting of 39, 28 and 30 species, respectively (figure 1 and electronic supplementary material, figures S1 and S2).
Phylogenies shown in figure 1 and electronic supplementary material, figures S1 and S2 were also used to detect positive selection within a group using the site test M1a/M2a [35]. Four other red and Chromista algal groups were also tested using M1a/M2a LRTs consisting of 49 Rhodophyta, 45 Phaeophyceae, 28 Cryptophyta, 33 Chrysophyceae and Synurophyceae rbcL sequences (electronic supplementary material, figure S3 and table S2). Phylogenies of these groups were reconstructed using Bayesian method (MrBayes v. 3.1, GTR model with gamma-distributed rate variation across sites and a proportion of invariable sites with at least 106 runs) [33]. In M1a/M2a LRTs, the null model M1a (nearly neutral) that allows 0 ≤ dN/dS ≤ 1 was compared with the M2a model (same as the M1a model plus an extra class under positive selection with dN/dS ≥ 1). The significance of the M1a/M2a LRTs was calculated assuming that twice the difference in the log of maximum likelihood between the two models was distributed as a chi-square distribution with two degrees of freedom.
The Bayes empirical Bayes method [36] implemented in PAML was used to calculate the posterior probabilities that particular sites fall into classes with different dN/dS and to identify sites with a high probability of being under positive selection (having dN/dS > 1). Rubisco sites under positive selection were numbered against the spinach (Spinacia oleracea) sequence for comparison with other studies. Residue location in the tertiary structure was visualized using the structural data file of spinach Rubisco (1RBO) available on RCSB Protein Data Bank with DeepView-Swiss PdbViewer v. 3.7 [37].
(d). Geological history of atmospheric carbon dioxide and oxygen
Ranges of atmospheric CO2 during the Proterozoic were taken from the literature [38–41]. Phanerozoic CO2 was reconstructed from modelled (GEOCARBSULF, incorporating the full variability of basalt/granite ratios [42]) and proxy (CO2 estimates from δ13C values from phytoplankton, liverworts, boron and stomatal indices as compiled by Royer et al. [43] with revised δ13C palaeosol data [44], binned into 10 Ma and 1 s.d.) data. Proterozoic O2 levels were taken from Canfield [1]. Phanerozoic O2 was derived from models [45–47] and proxies ([48], showing 1 s.d.).
3. Results and discussion
(a). Positive selection of algal Rubisco occurred during distinct geological periods
The analysis of individual branches revealed that positive selection was restricted to branches basal to the radiation of the red and Chromista algae between 1.56 and 0.41 Ga (average ages of the nodes; for the range at each node see figure 1). Positive selection in rbcL was prior to the divergence of large algal taxonomic groups, but not within the groups. To further explore this pattern, we focused on two geochemically and ecologically important groups with relatively good fossil records: the Haptophyta (including coccolithophores) and Bacillariophyta (diatoms). Once again, positive selection was restricted to a few, deep branches. The Haptophyta (electronic supplementary material, figure S1) showed a strong signal of positive selection along the branch leading to, and basal to, the radiation of the Prymnesiophyceae (which includes the coccolithophores Emiliania huxleyi, Coccolithus pelagicus and colony-forming Phaeocystis spp.) between 375 and 285 Ma. Once this group diverged, there is little evidence of positive selection apart from the branch leading to the Phaeocystaceae. In the diatoms (electronic supplementary material, figure S2), adaptation also occurred in deep branches within radial centrics (including Aulacoseira and Coscinodiscus spp.) at 142–97 Ma and pennates (including Fragilariopsis, Phaeodactylum and Pinnularia spp.) at 73–56 Ma and in bipolar centrics (including Thalassiosira, Chaetocera and Skeletonema spp.) at 114–92 Ma.
Positive selection hints at changes of amino acids that would influence the catalytic activity of Rubisco. Indeed, positive selection does appear to explain the variation in known Rubisco specificity factors (figure 1b). However, specificity factors are only a ratio and are unable to reveal the true sensitivity of kinetic changes in Rubisco. There are few measurements of Kc and Vc in algae but the Kc for both diatoms and Haptophyta are higher than Rhodophyta, which is higher again when compared with the Cyanidiales (figure 1b).
Using a Bayesian approach [36], we identified positively selected amino acid positions in rbcL in the basal branches where selection occurred. Only a few domains have been identified to influence activity or kinetics [9] and our sites under positive selection do not fall within these domains. However, there is some commonality to the residues under positive selection between land plants [49] and algae (figure 2), suggesting that these additional residues outside known important protein domains may also significantly affect Rubisco performance.
Figure 2.

Location of codons identified under positive selection aligned to Spinacia oleracea amino acid sequence, with posterior probabilities greater than 95% detected with Bayes empirical Bayes methods [36]. (a) Frequency shows the number of times when a particular site was detected as being under positive selection in trees; figure 1 (blue), Haptophyta (electronic supplementary material, figure S1, red) and diatoms (electronic supplementary material, figure S2, green). This is compared with results found in land plants [49] shown in grey. (b) Three-dimensional tertiary structure of S. oleracea with algal positive selection sites highlighted (same colours as (a)). Loop 6 is denoted in yellow.
(b). Positive selection of Rubisco in algae contrasts to that of land plants
Our results of positive selection only in the deep branches of the algal phylogeny contrasts with the ubiquitous positive selection found throughout the land plant groups [49]. To test whether this result may be owing to differences in the analytical approaches between studies, we applied the methodology previously used for plants [49] to an expanded set of red and Chromista algal groups, including Rhodophyta, Phaeophyta, Cryptophyta, Chrysophyceae and Synurophyceae, along with Haptophyta and diatoms with phylogenies constructed using rbcL sequences (electronic supplementary material, figure S3). This analysis confirmed the absence of positive selection within algal taxonomic groups, with none of the expanded algal groups displaying a signal of positive selection using this test (table 1).
Table 1.
PAML results for models M0 and M1a/M2a.
| group | tree | M0 |
M1a/M2a |
|||||||||
|---|---|---|---|---|---|---|---|---|---|---|---|---|
| nF | nG | nS | nN | BL | κ | dS | dN | dN/dS | χ2 | p-value | ||
| Rhodophyta | electronic supplementary material, figure S4a | 31 | 37 | 50 | 1200 | 21.748 | 2.022 | 37.483 | 0.749 | 0.020 | 0 | 1 |
| Phaeophyceae | electronic supplementary material, figure S4b | 8 | 29 | 45 | 1362 | 2.732 | 3.170 | 3.905 | 0.179 | 0.046 | 0.01 | 0.99 |
| Chrysophyceaeand Synuophyceae | electronic supplementary material, figure S4c | 4 | 5 | 33 | 930 | 8.950 | 0.968 | 14.821 | 0.449 | 0.030 | 0 | 1 |
| Cryptophyta | electronic supplementary material, figure S4d | 4 | 8 | 28 | 972 | 9.227 | 1.778 | 0.312 | 13.086 | 0.024 | 0 | 1 |
| Haptophyta | electronic supplementary material, figure S1 | 10 | 21 | 32 | 1377 | 8.501 | 1.377 | 8.723 | 0.437 | 0.053 | 0 | 1 |
| diatoms | electronic supplementary material, figure S2 | 18 | 23 | 30 | 900 | 5.617 | 1.380 | 8.178 | 0.444 | 0.054 | 0 | 1 |
| red and brown algae | figure 1 | 28 | 39 | 40 | 1206 | 19.826 | 1.108 | 29.800 | 1.084 | 0.036 | 0 | 1 |
Using M0 model in PAML: nF, number of families; nG, number of genera; nS, number of sequences; nN, number of nucleotides; BL, branch length; κ, transition/transversion rate; dS, synonymous substitutions; dN, non-synonymous substitutions; dN/dS, average dN/dS across tree (using 1 class for dN/dS). Comparing M1a (nearly neutral) with M2a (positive selection) using likelihood-ratio test (LRT), where χ2 = 2 × (LRTM2a – LRTM1a) with degrees of freedom = 2 to calculate probability (p-value) for the LRT value being as high as is seen by chance.
(c). Carbon dioxide as a driver for Rubisco adaptation
There is evidence that Rubisco adaptation in land plants was driven by a number of environmental factors in addition to atmospheric composition, including aridity and high temperatures [50]. However, in the marine realm, we propose that it is the change in atmospheric CO2 equilibrated with surface waters which acts as the ultimate driver of positive selection in Rubisco. As Rubisco is packaged within the chloroplast, the adaptive response of Rubisco must be driven by changing intracellular conditions. Intracellular CO2 conditions are under physiological control, and as external CO2 becomes increasingly limited algae are known to induce carbon-concentrating mechanisms (CCMs) to boost the internal supply of CO2 to Rubisco [5]. However, this can also lead to an elevation in intracellular O2 of levels up to 6–6.5 times external concentrations [51], owing to reduced leakiness of both CO2 and O2 [52,53]. While both intracellular CO2 and O2 levels can change by induction of a CCM, the trigger for the employment of CCMs is driven by changes in external CO2. CCMs are regulated by external CO2, and on geological scales of eukaryotic evolution, changes of atmospheric CO2 are orders of magnitude greater than changes in O2. Additionally, the Form 1D Rubisco present in the studied algal species appears to have reduced oxygenase potential and therefore a reduced tendency to be inhibited by O2 [6]. Finally, optimization of Rubisco efficiency is driven by the trade-off between Vc and CO2 affinity, and therefore is in tune with intracellular CO2 concentrations [54].
In land plants, it has been established that positive selection in rbcL emerges coincident with the development of a C4 CCM which elevates CO2 to almost saturation at the site of Rubisco [55,56]. This relaxes pressure for Rubisco to have a high affinity for CO2 and therefore allows an increase in Vc, which results in increased photosynthetic efficiency as the plant requires less nitrogen to achieve a given CO2 fixation capacity [55,56]. By analogy, therefore, positive selection in Rubiscos of the Haptophyta and diatoms is likely to have occurred also in response to emergence of CCMs as both Haptophyta and diatoms are thought to possess them [57]. We can infer that, like in the C4 land plants, positive selection indicates a lowering of CO2 affinity and an increase in Vc in these algae after induction of CCMs. Indeed, modern day Haptophyta and diatoms do display lower specificities (Ω) and CO2 affinity (i.e. higher Kc) than their red algal counterparts (their ancestral endosymbionts; figure 1b). So, although atmospheric CO2 acts as the ultimate driver of Rubisco change, the mechanistic driver is the physiological innovation in boosting intracellular carbon (the CCMs) in response to declining CO2.
The term CCM encompasses a wide variety of poorly understood mechanisms that concentrate carbon to different degrees. While the pattern of positive selection in rbcL hints at a link between the presence of CCMs and positive selection within the Haptophyta and diatoms, there is insufficient knowledge to explain whether a simple relationship exists between gradational improvements in carbon concentration and positive selection in rbcL.
It does appear that the presence of positive selection certainly indicates elevated internal carbon. We have already outlined that positive selection in Haptophtya and diatoms suggest an increase in intracellular carbon concentrations above the Rhodophyta but many members of the Rhodophyta are also thought to possess CCMs [6], though their relative abilities to concentrate carbon are poorly documented [6]. Like the presence of positive selection that separates the Rhodophyta and Chromista (Haptophyta and diatoms), positive selection also occurs at the divergence of Rhodophyta and Cyanidiales, and again correlates with an increase in Kc (figure 1b). This suggests that positive selection of rbcL is linked to a gradual reduced affinity of Rubisco for CO2, most likely driven by development of a better functioning CCM.
On the other hand, absence of positive selection does not necessarily indicate a lack of CCMs. No positive selection is detected leading to the Phaeophyta (the branch leading to Pylaiella littoralis in figure 1). While there is no information on the carbon physiology of P. littoralis, Phaeophyta studied to date do appear to concentrate carbon, but to lower levels than their diatom counterparts. Furthermore, some orders are known to lack pyrenoids (Dicytotales, Sphacelariales, Laminariales and Fucales) although they do appear to be able to use  [5]. Even though we find no positive selection in groups which are established as lacking CCMs (table 1 and electronic supplementary material, figure S3; the Rhodophyta genera Batrachospermum, Caloglossa, Membranoptera, Nitophyllum, Phycodrys and Ptilota [58–60], and the Chrysophyceae and Synurophyceae [60,61]), the test used for this particular analysis is very conservative. This test averages positive selection across the group and was unable to detect positive selection, even within the Haptophyta and diatoms, in which positive selection is established when individual branches were tested.
(d). Rubisco adaptation correlates with declining carbon dioxide
The timing of events of positive selection in Rubisco further corroborates its relationship with atmospheric CO2. A comparison of the occurrence of positive selection within Haptophyta and diatoms during the Phanerozoic against the most recent compilation of proxy-derived reconstructions and geochemical models of CO2 and O2 show that positive selection always corresponds with falling CO2 (inset, figure 3). This correlation of Rubisco adaptation events with declining CO2 demonstrates the potential for use of adaptation of Rubisco as an indicator of past atmospheric CO2.
Figure 3.

Timing of adaptation of Rubisco in response to changing atmospheric CO2 and O2. Timing of positive selection in figure 1 (magenta) and within Haptophyta (electronic supplementary material, figure S1, orange) and diatoms (electronic supplementary material, figure S2, green), where boxed area denotes time between age of nodes and line encompasses 95% probability density of ages. This is compared with proxy-derived Proterozoic ranges of atmospheric CO2 (turquoise ovals [38–41]) and O2 (grey ovals [1]). A continuous record of Phanerozoic CO2 was reconstructed from proxies [43,44] binned into 10 Ma with 1 s.d. (light blue) and overlaid over modelled data (dark blue [42]). Phanerozoic O2 was reconstructed from proxies showing 1 s.d. (shaded grey) and modelled data (dark grey line [45], blue line [47] and green line [46]). Dark blue blocks denote possible snowball Earths, and light blue blocks denote periods of glaciations. Inset shows Phanerozoic data on a linear scale, where coloured bars represent the average age of nodes.
Our pattern of adaptation prior to radiation, which characterizes the history of algal Rubisco, is suggestive that adaptive change at the physiological and molecular level was associated with the enhancement of photosynthetic performance, and that this increased efficiency could be the foundation for the successful subsequent proliferation of the different algal groups in novel ecological niches. Adaptation in the Haptophyta between 375 and 285 Ga occurs over the lowest limit of CO2 of the Carboniferous and coincides with estimation of the emergence of calcification and switch to full autotrophy in this group [24]. Diatoms have carbon acquisition physiology that would suggest a CCM [62,63] and it has even been controversially suggested that some possess a C4 mechanism [57–60]. The three separate adaptation events within diatoms occur during falling CO2 of the Mesozoic and Cenozoic, which coincide with their dominance and diversification, in particular the Thalassiosirales, between 100 Ma and 30 Ma [61].
(e). Extending the carbon dioxide record into the Proterozoic
We can apply the Phanerozoic relationship between declining CO2 and positive selection to investigate possible CO2 change using the deeper branches in the tree of the whole red/Chromista algal lineage (figure 3). It is challenging to constrain timing of adaptation in the Proterozoic owing to long branches and the lack of a fossil record. Nonetheless, we find positive selection on the earliest divergence of the Cyanidiales (1.56–1.14 Ga). There is a cluster of signals of positive selection in a number of branches immediately after the event of secondary endosymbiosis, the origin of the Chromista algae, approximately 1.1 Ga. The environmental trigger for this symbiotic relationship between host and chloroplast is unknown but this relationship confirms that Rubisco evolves in response to changing intracellular conditions, plus there are certain advantages to an endosymbiotic habitat in a low CO2 environment. The continued positive selection, on two branches subsequent to those immediately after the secondary endosymbiosis, points to sustained declining CO2 (0.93–0.52 Ga). We present a continuous record suggesting decreasing CO2 encompassing periods when there are currently few or no constraints. Because advances in evolutionary innovation generally occurred at times of major environmental or geochemical change, the trend of declining CO2 during the Proterozoic suggests this billion years of time may not have been so ‘boring’. We suggest instead a backdrop of environmental change associated with the expansion of the eukaryotes during the very late Mesoproterozoic and Neoproterozoic [22]. Further, such a decrease in CO2 likely played a role in triggering the subsequent Snowball Earth events and at least contributed to dictating Proterozoic climates [64].
4. Conclusion
The wide adoption of photosynthesis by life, resulting in reduced atmospheric CO2–O2 ratios, created increased evolutionary pressure on Rubisco which has evolved its kinetic properties in response to declining atmospheric CO2 [8]. Determining the timing of adaptation of the CO2–O2 sensitive enzyme, Rubisco, presents a novel approach in understanding the biological response to changing atmosphere, and the periods of emergence of CCMs. It supports the current estimation of the periods of decreasing CO2 beyond the Phanerozoic and provides important additional constraints to the current scarcity of proxies available during these time periods, uniquely delivering a continuous record extending 1.5 Ga. The future challenge is to further document the physiological innovations responsible for driving the Rubisco change, and to discover other genetic signatures which can open a window on past major environmental change, such as the oxygenation of the planet.
Acknowledgements
We thank the Royal Society for hosting and funding, and David Beerling for the invitation to the meeting at the Kavli Royal Society International Centre from which this paper and the Theme Issue arose. This research was supported by an ERC Starting grant (SP2-GA-2008-200915) and the Leverhulme Trust to R.E.M.R. and NERC grant (NE/H007741/1) to D.A.F. J.N.Y. acknowledges financial support through the Clarendon Scholarship, Oxford. R.E.M.R. conceived the project and directed this work. J.N.Y. performed the bulk of the sequencing, and data analysis. M.V.K. helped with analysis of positive selection, D.A.F. conducted phylogenetic analyses and dating of the nodes. J.N.Y. led the writing and all authors contributed to discussions and the writing. RbcL sequences generated for this research have been deposited with the NCBI GenBank under accession codes HQ656822–HQ656838. The authors declare no competing financial interests. Correspondence and requests for materials should be addressed to R.E.M.R. (rosalind.rickaby@earth.ox.ac.uk).
References
- 1.Canfield D. E. 2005. The early history of atmospheric oxygen: homage to Robert M. Garrels. Annu. Rev. Earth Planet Sci. 33, 1–36 10.1146/annurev.earth.33.092203.122711 (doi:10.1146/annurev.earth.33.092203.122711) [DOI] [Google Scholar]
- 2.Johnston D. T., Wolfe-Simon F., Pearson A., Knoll A. H. 2009. Anoxygenic photosynthesis modulated Proterozoic oxygen and sustained Earth's middle age. Proc. Natl Acad. Sci. USA 106, 16 925–16 929 10.1073/pnas.0909248106 (doi:10.1073/pnas.0909248106) [DOI] [PMC free article] [PubMed] [Google Scholar]
- 3.Laing W. A., Ogren W. L., Hageman R. H. 1974. Regulation of soybean net photosynthetic CO2 fixation by the interaction of CO2, O2, and ribulose 1,5-diphosphate carboxylase. Plant Physiol. 54, 678–685 10.1104/pp.110.159855 (doi:10.1104/pp.110.159855) [DOI] [PMC free article] [PubMed] [Google Scholar]
- 4.Tcherkez G. G. B., Farquhar G. D., Andrews T. J. 2006. Despite slow catalysis and confused substrate specificity, all ribulose bisphosphate carboxylases may be nearly perfectly optimized. Proc. Natl Acad. Sci. USA 103, 7246–7251 10.1073/pnas.0600605103 (doi:10.1073/pnas.0600605103) [DOI] [PMC free article] [PubMed] [Google Scholar]
- 5.Badger M. R., Andrews T. J. 1987. Co-evolution of Rubisco and CO2 concentrating mechanisms. In Progress in photosynthesis research, vol. III (ed. Biggins J.), pp. 601–609 Dordrecht, The Netherlands: Martinus Nijhoff Publishers [Google Scholar]
- 6.Badger M. R. T., Andrews J., Whitney S. M., Ludwig M., Yellowlees D. C., Leggat W., Price G. D. 1998. The diversity and coevolution of Rubisco, plastids, pyrenoids, and chloroplast-based CO2-concentrating mechanisms in algae. Can. J. Bot. 76, 1052–1071 10.1139/b98-074 (doi:10.1139/b98-074) [DOI] [Google Scholar]
- 7.Badger M. R., Hanson D., Price G. D. 2002. Evolution and diversity of CO2 concentrating mechanisms in cyanobacteria. Funct. Plant Biol. 29, 161–173 10.1071/PP01213 (doi:10.1071/PP01213) [DOI] [PubMed] [Google Scholar]
- 8.Tortell P. D. 2000. Evolutionary and ecological perspectives on carbon acquisition in phytoplankton. Limnol. Oceanogr. 45, 744. 10.4319/lo.2000.45.3.0744 (doi:10.4319/lo.2000.45.3.0744) [DOI] [Google Scholar]
- 9.Spreitzer R. J., Salvucci M. E. 2002. Rubisco: structure, regulatory interactions, and possibilities for a better enzyme. Annu. Rev. Plant Biol. 53, 449–475 10.1146/annurev.arplant.53.100301.135233 (doi:10.1146/annurev.arplant.53.100301.135233) [DOI] [PubMed] [Google Scholar]
- 10.Cavalier-Smith T. 1999. Principles of protein and lipid targeting in secondary symbiogenesis: Euglenoid, dinoflagellate, and sporozoan plastid origins and the eukaryote family tree. J. Eukaryot. Microbiol. 46, 347–366 10.1111/j.1550-7408.1999.tb04614.x (doi:10.1111/j.1550-7408.1999.tb04614.x) [DOI] [PubMed] [Google Scholar]
- 11.Cavalier-Smith T. 1981. Eukaryote kingdoms: seven or nine? BioSystems 14, 461–481 10.1016/0303-2647(81)90050-2 (doi:10.1016/0303-2647(81)90050-2) [DOI] [PubMed] [Google Scholar]
- 12.Keeling P. J. 2009. Chromalveolates and the evolution of plastids by secondary endosymbiosis. J. Eukaryot. Microbiol. 56, 1–8 10.1111/j.1550-7408.2008.00371.x (doi:10.1111/j.1550-7408.2008.00371.x) [DOI] [PubMed] [Google Scholar]
- 13.Yoon H. S., Hackett J. D., Pinto G., Bhattacharya D. 2002. The single, ancient origin of chromist plastids. Proc. Natl Acad. Sci. USA 99, 15 507–15 512 10.1073/pnas.242379899 (doi:10.1073/pnas.242379899) [DOI] [PMC free article] [PubMed] [Google Scholar]
- 14.Sims P. A., Mann D. G., Medlin L. K. 2006. Evolution of the diatoms: insights from fossil, biological and molecular data. Phycologia 45, 361–402 10.2216/05-22.1 (doi:10.2216/05-22.1) [DOI] [Google Scholar]
- 15.Medlin L. K., Sáez A. G., Young J. R. 2008. A molecular clock for coccolithophores and implications for selectivity of phytoplankton extinctions across the K/T boundary. Mar. Micropaleontol. 67, 69–86 10.1016/j.marmicro.2007.08.007 (doi:10.1016/j.marmicro.2007.08.007) [DOI] [Google Scholar]
- 16.Yang Z. 2007. PAML 4: phylogenetic analysis by maximum likelihood. Mol. Biol. Evol. 24, 1586–1591 10.1093/molbev/msm088 (doi:10.1093/molbev/msm088) [DOI] [PubMed] [Google Scholar]
- 17.Richlen M., Barber P. H. 2005. A technique for the rapid extraction of microalgal DNA from single live and preserved cells. Mol. Ecol. Notes 4, 688–691 10.1111/j.1471-8286.2005.01032.x (doi:10.1111/j.1471-8286.2005.01032.x) [DOI] [Google Scholar]
- 18.Thompson J. D., Gibson T. J., Plewniak F., Jeanmougin F., Higgins D. G. 1997. The ClustalX Windows interface: flexible strategies for multiple sequence alignment aided by quality analysis tools. Nucleic Acids Res. 25, 4876–4882 10.1093/nar/25.24.4876 (doi:10.1093/nar/25.24.4876) [DOI] [PMC free article] [PubMed] [Google Scholar]
- 19.Filatov D. A. 2009. Processing population genetic analysis of multigenic datasets with ProSeq3 software. Bioinformatics 25, 3183–3189 10.1093/bioinformatics/btp572 (doi:10.1093/bioinformatics/btp572) [DOI] [PMC free article] [PubMed] [Google Scholar]
- 20.Haslam R. P., Keys A. J., Andralojc P. J., Madgwick P. J., Andersson I., Grimsrud A., Eilertsen H. C., Parry M. A. J. 2005. Specificity of diatom Rubisco. In Plant responses to air pollution and global change (eds Omasa K., Nouchi I., De Kok L. J.), pp. 157–164 Tokyo, Japan: Springer. [Google Scholar]
- 21.Webster R. J. 2009. The effects of light and CO2 on photosynthesis in Emiliania Huxleyi. PhD thesis, University of Essex, UK [Google Scholar]
- 22.Yoon H. S., Hackett J. D., Ciniglia C., Pinto G., Bhattacharya D. 2004. A molecular timeline for the origin of photosynthetic eukaryotes. Mol. Biol. Evol. 21, 809–818 10.1093/molbev/msh075 (doi:10.1093/molbev/msh075) [DOI] [PubMed] [Google Scholar]
- 23.Drummond A., Rambaut A. 2007. BEAST: Bayesian evolutionary analysis by sampling trees. BMC Evol. Biol. 7, 214. 10.1186/1471-2148-7-21 (doi:10.1186/1471-2148-7-21) [DOI] [PMC free article] [PubMed] [Google Scholar]
- 24.Liu H., Aris-Brosou S., Probert I., de Vargas C. 2010. A time line of the environmental genetics of the haptophytes. Mol. Biol. Evol. 27, 161–176 10.1093/molbev/msp222 (doi:10.1093/molbev/msp222) [DOI] [PubMed] [Google Scholar]
- 25.Saunders G. W., Hommersand M. H. 2004. Assessing red algal supraordinal diversity and taxonomy in the context of contemporary systematic data. Am. J. Bot. 91, 1494–1507 10.3732/ajb.91.10.1494 (doi:10.3732/ajb.91.10.1494) [DOI] [PubMed] [Google Scholar]
- 26.Rampen S. W., Schouten S., Hopmans E. C., Abbas B., Noordeloos A. A. M., van Bleijswijk J. D. L., Geenevasen J. A. J., Sinninghe Damsté J. S. 2009. Diatoms as a source for 4-desmethyl-23,24-dimethyl steroids in sediments and petroleum. Geochim. Cosmochim. Acta 73, 377–387 10.1016/j.gca.2008.10.024 (doi:10.1016/j.gca.2008.10.024) [DOI] [Google Scholar]
- 27.Rodríguez F., Oliver J. L., Marín A., Medina J. R. 1990. The general stochastic model of nucleotide substitution. J. Theor. Biol. 142, 485–501 10.1186/1471-2148-7-21 (doi:10.1186/1471-2148-7-21) [DOI] [PubMed] [Google Scholar]
- 28.Yule G. U. 1925. A mathematical theory of evolution, based on the conclusions of Dr. J. C. Willis, F.R.S. Phil. Trans. R. Soc. Lond. B 213, 21–87 10.1098/rstb.1925.0002 (doi:10.1098/rstb.1925.0002) [DOI] [Google Scholar]
- 29.Drummond A. J., Ho S. Y. W., Phillips M. J., Rambaut A. 2006. Relaxed phylogenetics and dating with confidence. PLoS Biol. 4, e88. 10.1371/journal.pbio.0040088 (doi:10.1371/journal.pbio.0040088) [DOI] [PMC free article] [PubMed] [Google Scholar]
- 30.Rambaut A., Drummond A. J. 2009. Tracer v. 1.5. See http://beast.bio.ed.ac.uk/Tracer (accessed 04 June 2010).
- 31.Rambaut A. 2009. FigTree. See http://tree.bio.ed.ac.uk/software/figtree/ (accessed 04 June 2010)
- 32.Zhang J., Nielsen R., Yang Z. 2005. Evaluation of an improved branch-site likelihood method for detecting positive selection at the molecular level. Mol. Biol. Evol. 22, 2472–2479 10.1093/molbev/msi237 (doi:10.1093/molbev/msi237) [DOI] [PubMed] [Google Scholar]
- 33.Ronquist F., Huelsenbeck J. P. 2003. MrBayes 3: Bayesian phylogenetic inference under mixed models. Bioinformatics 19, 1572–1574 10.1093/bioinformatics/btg180 (doi:10.1093/bioinformatics/btg180) [DOI] [PubMed] [Google Scholar]
- 34.Uitenbroek D. G. 1997. SISA-Binomial. See http://www.quantitativeskills.com/sisa/distributions/binomial.htm (accessed 20 June 2010)
- 35.Wong W. S. W., Yang Z., Goldman N., Nielsen R. 2004. Accuracy and power of statistical methods for detecting adaptive evolution in protein coding sequences and for identifying positively selected sites. Genetics 168, 1041–1051 10.1534/genetics.104.031153 (doi:10.1534/genetics.104.031153) [DOI] [PMC free article] [PubMed] [Google Scholar]
- 36.Yang Z., Wong W. S., Nielsen R. 2005. Bayes empirical Bayes inference of amino acid sites under positive selection. Mol. Biol. Evol. 22, 1107–1118 10.1093/molbev/msi097 (doi:10.1093/molbev/msi097) [DOI] [PubMed] [Google Scholar]
- 37.Guex N., Peitsch M. C. 1997. SWISS-MODEL and the Swiss-PdbViewer: an environment for comparative protein modeling. Electrophoresis 18, 2714–2723 10.1002/elps.1150181505 (doi:10.1002/elps.1150181505) [DOI] [PubMed] [Google Scholar]
- 38.Kasting J. F. 1993. Earth's early atmosphere. Science 5097, 920–926 10.1126/science.11536547 (doi:10.1126/science.11536547) [DOI] [PubMed] [Google Scholar]
- 39.Sheldon N. D. 2006. Precambrian paleosols and atmospheric CO2 levels. Precambrian Res. 147, 148–155 10.1016/j.precamres.2006.02.004 (doi:10.1016/j.precamres.2006.02.004) [DOI] [Google Scholar]
- 40.Kaufman A. J., Xiao S. 2003. High CO2 levels in the Proterozoic atmosphere estimated from analyses of individual microfossils. Nature 425, 279–282 10.1038/nature01902 (doi:10.1038/nature01902) [DOI] [PubMed] [Google Scholar]
- 41.Rosing M. T., Bird D. K., Sleep N. H., Bjerrum C. J. 2010. No climate paradox under the faint early Sun. Nature 464, 744–747 10.1038/nature08955 (doi:10.1038/nature08955) [DOI] [PubMed] [Google Scholar]
- 42.Berner R. A. 2008. Addendum to ‘Inclusion of the weathering of volcanic rocks in the GEOCARBSULF model’: (R. A. Berner, 2006, 306, pp. 295–302). Am. J. Sci. 308, 100–103 10.2475/01.2008.04 (doi:10.2475/01.2008.04) [DOI] [Google Scholar]
- 43.Royer D. L., Berner R. A., Park J. 2007. Climate sensitivity constrained by CO2 concentrations over the past 420 million years. Nature 446, 530–532 10.1038/nature05699 (doi:10.1038/nature05699) [DOI] [PubMed] [Google Scholar]
- 44.Breecker D. O., Sharp Z. D., McFadden L. D. 2010. Atmospheric CO2 concentrations during ancient greenhouse climates were similar to those predicted for A.D. 2100. Proc. Natl Acad. Sci. USA 107, 576–580 10.1073/pnas.0902323106 (doi:10.1073/pnas.0902323106) [DOI] [PMC free article] [PubMed] [Google Scholar]
- 45.Berner R. A. 2009. Phanerozoic atmospheric oxygen: new results using the GEOCARBSULF model. Am. J. Sci. 309, 603–606 10.2475/07.2009.03 (doi:10.2475/07.2009.03) [DOI] [Google Scholar]
- 46.Falkowski P. G., Katz M. E., Milligan A. J., Fennel K., Cramer B. S., Aubry M. P., Berner R. A., Novacek M. J., Zapol W. M. 2005. The rise of oxygen over the past 205 million years and the evolution of large placental mammals. Science 309, 2202–2204 10.1126/science.1116047 (doi:10.1126/science.1116047) [DOI] [PubMed] [Google Scholar]
- 47.Bergman N. M., Lenton T. M., Watson A. J. 2004. COPSE: a new model of biogeochemical cycling over Phanerozoic time. Am. J. Sci. 304, 397–437 10.2475/ajs.304.5.397 (doi:10.2475/ajs.304.5.397) [DOI] [Google Scholar]
- 48.Glasspool I. J., Scott A. C. 2010. Phanerozoic concentrations of atmospheric oxygen reconstructed from sedimentary charcoal. Nat. Geosci. 3, 627–630 10.1038/ngeo923 (doi:10.1038/ngeo923) [DOI] [Google Scholar]
- 49.Kapralov M., Filatov D. 2007. Widespread positive selection in the photosynthetic Rubisco enzyme. BMC Evol. Biol. 7, 73. 10.1186/1471-2148-7-73 (doi:10.1186/1471-2148-7-73) [DOI] [PMC free article] [PubMed] [Google Scholar]
- 50.Galmes J., Flexas J., Keys A. J., Cifre J., Mitchell R. A. C., Madgwick P. J., Haslam R. P., Medrano H. P., Parry M. A. J. 2005. Rubisco specificity factor tends to be larger in plant species from drier habitats and in species with persistent leaves. Plant, Cell Environ. 28, 571–579 10.1111/j.1365-3040.2005.01300.x (doi:10.1111/j.1365-3040.2005.01300.x) [DOI] [Google Scholar]
- 51.Raven J., Larkum A. 2007. Are there ecological implications for the proposed energetic restrictions on photosynthetic oxygen evolution at high oxygen concentrations? Photosynth. Res. 94, 31–42 10.1007/s11120-007-9211-z (doi:10.1007/s11120-007-9211-z) [DOI] [PubMed] [Google Scholar]
- 52.Hopkinson B. M., Dupont C. L., Allen A. E., Morel F. M. M. 2011. Efficiency of the CO2-concentrating mechanism of diatoms. Proc. Natl Acad. Sci. USA 108, 3830–3837 10.1073/pnas.1018062108 (doi:10.1073/pnas.1018062108) [DOI] [PMC free article] [PubMed] [Google Scholar]
- 53.Badger M. R., Bassett M., Comins H. N. 1985. A model for HCO3− accumulation and photosynthesis in the cyanobacterium Synechococcus sp. Theoretical predictions and experimental observations. Plant Physiol. 77, 465–471 10.1104/pp.77.2.465 (doi:10.1104/pp.77.2.465) [DOI] [PMC free article] [PubMed] [Google Scholar]
- 54.Savir Y., Noor E., Milo R., Tlusty T. 2010. Cross-species analysis traces adaptation of Rubisco toward optimality in a low-dimensional landscape. Proc. Natl Acad. Sci. USA 107, 3475–3480 10.1073/pnas.0911663107 (doi:10.1073/pnas.0911663107) [DOI] [PMC free article] [PubMed] [Google Scholar]
- 55.Christin P., Salamin N., Muasya A. M., Roalson E. H., Russier F., Besnard G. 2008. Evolutionary switch and genetic convergence on rbcL following the evolution of C4 photosynthesis. Mol. Biol. Evol. 25, 2361–2368 10.1093/molbev/msn178 (doi:10.1093/molbev/msn178) [DOI] [PubMed] [Google Scholar]
- 56.Kapralov M. V., Kubien D. S., Andersson I., Filatov D. A. 2011. Changes in Rubisco kinetics during the evolution of C4 photosynthesis in Flaveria (Asteraceae) are associated with positive selection on genes encoding the enzyme. Mol. Biol. Evol. 28, 1491–1503 10.1093/molbev/msq335 (doi:10.1093/molbev/msq335) [DOI] [PubMed] [Google Scholar]
- 57.Reinfelder J. R. 2011. Carbon concentrating mechanisms in eukaryotic marine phytoplankton. Annu. Rev. Mar. Sci. 3, 291–315 10.1146/annurev-marine-120709-142720 (doi:10.1146/annurev-marine-120709-142720) [DOI] [PubMed] [Google Scholar]
- 58.Reinfelder J. R., Kraepiel A. M., Morel F. M. 2000. Unicellular C4 photosynthesis in a marine diatom. Nature 407, 996–999 10.1038/35039612 (doi:10.1038/35039612) [DOI] [PubMed] [Google Scholar]
- 59.Roberts K., Granum E., Leegood R. C., Raven J. A. 2007. Carbon acquisition by diatoms. Photosynth. Res. 93, 79–88 10.1007/s11120-007-9172-2 (doi:10.1007/s11120-007-9172-2) [DOI] [PubMed] [Google Scholar]
- 60.Raven J. 2010. Inorganic carbon acquisition by eukaryotic algae: four current questions. Photosynth. Res. 106, 123–134 10.1007/s11120-010-9563-7 (doi:10.1007/s11120-010-9563-7) [DOI] [PubMed] [Google Scholar]
- 61.Armbrust E. V. 2009. The life of diatoms in the world's oceans. Nature 459, 185–192 10.1038/nature08057 (doi:10.1038/nature08057) [DOI] [PubMed] [Google Scholar]
- 62.Burkhardt S., Amoroso G., Riebesell U., Sültemeyer D. 2001. CO2 and HCO3− uptake in marine diatoms acclimated to different CO2 concentrations. Limnol. Oceanogr. 46, 1378–1391 10.4319/lo.2001.46.6.1378 (doi:10.4319/lo.2001.46.6.1378) [DOI] [Google Scholar]
- 63.Rost B., Riebesell U., Burkhardt S., Sültemeyer D. 2003. Carbon acquisition of bloom-forming marine phytoplankton. Limnol. Oceanogr. 48, 55–67 10.4319/lo.2003.48.1.0055 (doi:10.4319/lo.2003.48.1.0055) [DOI] [Google Scholar]
- 64.Hoffman P. F., Kaufman A. J., Halverson G. P., Schrag D. P. 1998. A Neoproterozoic snowball earth. Science 281, 1342–1346 10.1126/science.281.5381.1342 (doi:10.1126/science.281.5381.1342) [DOI] [PubMed] [Google Scholar]