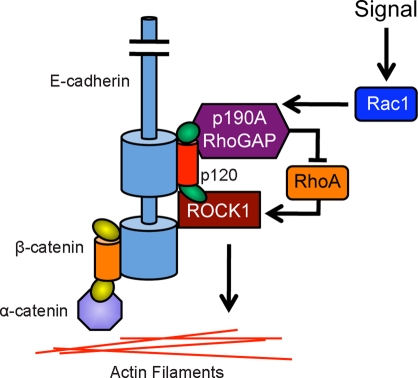
We show that Rho-associated protein kinase 1 coimmunoprecipitates with p120 and colocalizes to adherens junctions. p120 links ROCK1 to E-cadherin, as ROCK1 associates with wild-type, but not p120-uncoupled, E-cadherin. These data suggest that p120 regulates Rho activity at the cadherin complex via interaction with up- and downstream effectors, including ROCK1.
Abstract
The dynamic functional linkage of cadherins with the underlying actin cytoskeleton is tightly regulated to achieve proper cell–cell adhesion. p120-catenin (p120) regulates both cadherin stability and actin dynamics, but the relationship between these two functions remains unclear. Using a novel proteomic approach called reversible cross-link immunoprecipitation, or ReCLIP, we previously identified a physical interaction between p120 and Rho-associated protein kinase 1 (ROCK1), a major effector of RhoA. In this paper, we show that a discrete fraction of cellular ROCK1 coimmunoprecipitates with p120 and precisely colocalizes to adherens junctions (AJs). Manipulation of AJs using a calcium-switch assay and cadherin-blocking antibodies indicates direct recruitment of ROCK1 to newly forming junctions. Importantly, we find that p120 links ROCK1 to the cadherin complex, as ROCK1 coimmunoprecipitates with wild-type but not p120-uncoupled E-cadherin. Moreover, depletion of ROCK1 using short-hairpin RNA results in dramatic mislocalization of the cadherin complex and junctional actin. These data are consistent with a model in which p120 dynamically regulates Rho-GTPase activity at the cadherin complex through transient interaction with several of its up- and downstream effectors, including ROCK1.
INTRODUCTION
Cell–cell adhesion is mediated, in part, by homophilic interactions between cadherins (e.g., E-cadherin) at the adherens junction (AJ) of adjacent cells. Cadherins are regulated by the catenins p120-catenin (hereafter p120), β-catenin, and α-catenin, which interact with the cytoplasmic domain of cadherins. p120 binds to the juxta-membrane domain of classical cadherins and stabilizes the cadherin complex at the plasma membrane (Thoreson et al., 2000; Ireton et al., 2002; Davis et al., 2003). β-catenin interacts with the cadherin C-terminal tail and mediates adhesive strength via α-catenin, which physically and/or functionally links cadherins to the actin cytoskeleton (Rimm et al., 1995; Yamada et al., 2005).
Modulation of the actin cytoskeleton also contributes to strong cell–cell adhesion. However, the precise physical interactions between cadherins and the actomyosin network are not well understood. For example, exactly how α-catenin links the cadherin complex with actin is unclear, because its interactions with β-catenin and actin are mutually exclusive (Yamada et al., 2005). Major players functionally connecting classical cadherins to the actin cytoskeleton are the Rho GTPases. Studies using dominant-active and dominant-negative Rho-GTPase mutants demonstrate that aberrant Rho-GTPase signaling in general disrupts cell–cell adhesion, presumably through misregulation of the cytoskeletal organization (Braga et al., 1997, 2000). Conversely, cadherin activity has been shown to affect Rho-GTPase function, with one example being activation of Rac1 by forced cadherin clustering, for which a number of mechanisms have been proposed (Betson et al., 2002; Goodwin et al., 2003; Fukuyama et al., 2006).
Rho-associated protein kinase (ROCK), a major effector of RhoA, has been shown to regulate cadherin function in a number of cell lines. In many cases, constitutive activation of ROCK disrupts AJs, while pharmacological inhibition of ROCK appears to promote AJ stability (Wójciak-Stothard et al., 2001). On the other hand, ROCK inhibition interferes with AJs in some cases (Walsh et al., 2001; Anderson et al., 2002; Laplante et al., 2004). Thus ROCK activity must be carefully controlled for proper cadherin function. Furthermore, myosin II, a direct target of ROCK, plays a central role in regulation of cadherin function in a broad range of cell types (Shewan et al., 2005; Harb et al., 2008; Li et al., 2010; Smutny et al., 2010).
Although p120 is most often described as an inhibitor of RhoA, exactly where and how this occurs is not entirely clear. According to one model, p120 interactions with RhoA and E-cadherin are mutually exclusive, suggesting that RhoA inhibition by p120 occurs in the cytoplasm, but not when p120 is bound to the cadherin complex (Anastasiadis et al., 2000). Alternatively, p120 may be directly responsible for targeting and/or regulating the activity of RhoA in AJs. For example, in NIH 3T3 cells, p120 suppresses RhoA activity in N-cadherin complexes via recruitment of p190A Rho GTPase–activating protein (RhoGAP; p190A; Wildenberg et al., 2006). Additionally, p120-dependent recruitment of p190A to the cadherin complex regulates cell motility of melanoma cells (Molina-Ortiz et al., 2009). Moreover, in lung endothelial cells, oxidized phospholipids promote barrier function, in part through promotion of the p120–p190A interaction at the cadherin complex (Birukova et al., 2010). Thus p120 may function as a signaling scaffold by recruiting RhoA and its effectors to the cadherin complex.
In support of the latter model, we very recently identified ROCK1 as a candidate p120 binding partner by using reversible cross-link immunoprecipitation (ReCLIP) and mass spectrometry (MS; Smith et al., 2011). In this study, we show that a discrete fraction of ROCK1 in A431 cells associates with AJs in an E-cadherin/p120-dependent manner under steady-state conditions. Manipulation of AJ integrity by various means, including calcium depletion/reconstitution and application of cadherin-blocking antibodies, reveals that recruitment of ROCK1 correlates tightly with AJ integrity. Importantly, selective uncoupling of p120 association with E-cadherin by mutation of the p120-binding site eliminates ROCK1 recruitment and, concomitantly, the ability to coprecipitate ROCK1 with antibodies to the E-cadherin extracellular domain. These data strongly support the notion that RhoA activity at AJs is cadherin dependent and, in particular, associated with dynamic physical interaction between p120 and multiple factors acting up- and downstream of RhoA (e.g., ROCK1, p190A) to coordinate its activity at the actin–cadherin interface.
RESULTS
Identification of ROCK1 as a p120 binding partner
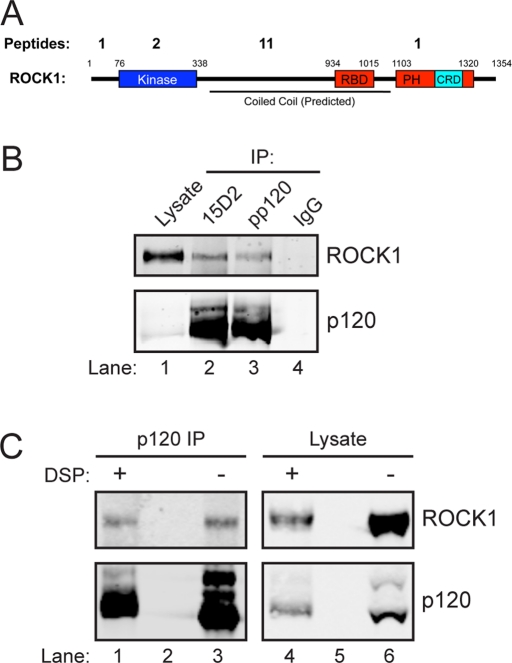
In a previous study, we performed ReCLIP analysis using A431 epidermoid carcinoma cells (Smith et al., 2011). ROCK1 recovery from this study is summarized in Table 1. Fifteen distinct peptides, covering multiple regions of ROCK1 were recovered, covering 12.8% of the total amino acid sequence (Figure 1A). No ROCK1 peptides were detected in the control pulldowns with an irrelevant immunoglobulin G (IgG). Sequence alignment analysis revealed that all but two peptides (mapped to the highly conserved kinase domain) were specific to ROCK1 (Table 1). Additionally, ROCK1 was detected in p120 ReCLIP samples from Caco-2 colorectal adenocarcinoma, MCF-7 mammary adenocarcinoma, and MCF-10A mammary epithelial cells, suggesting this interaction is relevant in several epithelial cell types (Supplemental Table S1).
TABLE 1:
ROCK1 peptides detected in p120 ReCLIP samples.
| Peptide | Amino acid position | ROCK domain | ROCK1 | ROCK2 | Detection in control |
|---|---|---|---|---|---|
| AESEQLAR | 899–906 | Coiled-coil | + | − | − |
| GAFGEVQLVR | 85–94 | Kinase | + | + | − |
| IEGWLSVPNR | 1121–30 | PH | + | − | − |
| LLEFELAQLTK | 820–830 | Coiled-coil | + | − | − |
| NIDNFLSR | 51–58 | N-terminus | + | − | − |
| SLQESLQK | 423–430 | Coiled-coil | + | − | − |
| YLSSANPNDNR | 405–415 | Coiled-coil | + | − | − |
| INEYQR | 495–500 | Coiled-coil | + | − | − |
| ITSLQEEVK | 631–639 | Coiled-coil | + | − | − |
| LLLQNELK | 784–791 | Coiled-coil | + | − | − |
| GLLEEQYFELTQESK | 907–921 | Coiled-coil | + | − | − |
| NLESTVSQIEKEK | 476–488 | Coiled-coil | + | − | − |
| NVENEVSTLKDQLEDLKK | 511–528 | Coiled-coil | + | − | − |
| SDSAFFWEER | 116 –125 | Kinase | + | + | − |
| YLSSANPNDNR | 405–415 | Coiled-coil | + | − | − |
The identified sequence and specific location of ROCK1 peptides identified by MS in p120 ReCLIP samples from A431 cells. Identified sequences were compared with the full sequences of ROCK1 and ROCK2.
FIGURE 1:
Identification of ROCK1 as a p120 binding partner. (A) Distribution of ROCK1 peptides recovered from p120 ReCLIP eluates described previously (Smith et al., 2011). Small numbers refer to amino acid position of specific domains in the ROCK1 structure. Large numbers refer to the number of unique ROCK1 peptides recovered per domain (see Table 1). (B) Coimmunoprecipitation of ROCK1 with p120. Lane 1: whole-cell lysates containing 10% of input. Lanes 2–4: immunoprecipitates from DSP–cross-linked A431 cells were generated with two separate p120 mAbs (15D2 and pp120) or a control monoclonal antibody (IgG) as indicated, and detected by Western blotting with antibodies to ROCK1 or p120. (C) Coimmunoprecipitation of ROCK1 with p120 in the absence of cross-linker. p120 was immunoprecipitated from DSP–cross-linked (lane 1) and un-cross-linked (lane 3) A431 cells. Lanes 4 and 6: whole-cell lysates from DSP–cross-linked (lane 3) and un-cross-linked (lane 4) A431 cells. Lanes 2 and 5 were left empty to avoid cross-contamination.
ROCK1 association with p120 at cell–cell junctions
Cross-link immunoprecipitation and Western blot analysis was performed to confirm the p120–ROCK1 interaction identified by MS. As Figure 1B illustrates, ROCK1 was coimmunoprecipitated with p120 from DSP–cross-linked A431 cells using two separate p120 monoclonal antibodies (mAbs; pp120 and 15D2, lanes 2 and 3) but not with a negative control antibody (IgG, lane 4). This interaction appears to be substoichiometric, with a small amount of ROCK1 consistently coimmunoprecipitating with a relatively large amount of p120 (lanes 2 and 3). Moreover, this interaction was confirmed by coimmunoprecipitation of ROCK1 and p120 in the absence of cross-linker (Figure 1C).
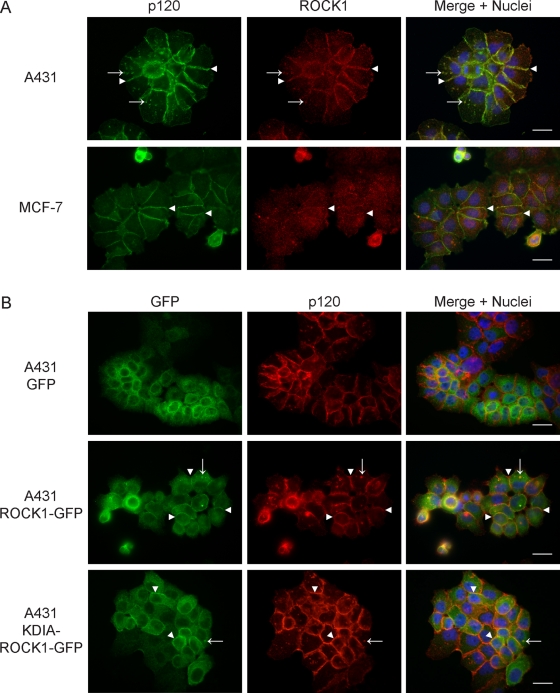
The localization of endogenous ROCK1 was analyzed by immunofluorescence microscopy in A431 and MCF-7 epithelial cells. In A431 cells, ROCK1 colocalized precisely with p120 at cell–cell junctions (Figure 2A, top panels, arrowheads) and in cytoplasmic vesicle structures (arrows). In MCF-7 cells (Figure 2A, bottom panels), ROCK1 also colocalized with p120 at cell–cell junctions (arrowheads). Interestingly, although ROCK1 was efficiently detected in p120 ReCLIP samples from MCF-7 cells (see Table S1), the association was difficult to detect by immunofluorescence due to low expression and diffuse localization of ROCK1. Thus the ROCK1 interaction would likely have been missed had we been relying only on conventional approaches.
FIGURE 2:
ROCK1 colocalizes with p120 at cell–cell junctions. (A) Immunofluorescence analysis of endogenous p120 and ROCK1 in A431 (top panels) and MCF-7 (bottom panels) cells. Arrowheads indicate colocalization of ROCK1 (red) with p120 (green) at cell–cell junctions. Arrows indicate colocalization of ROCK1 and p120 in cytoplasmic vesicles. (B) Immunofluorescence analysis of GFP alone, ROCK1-GFP, or KDIA-ROCK1-GFP (green) and p120 (red) in A431 cells. Arrowheads indicate colocalization of ROCK1-GFP or KDIA-ROCK1-GFP with p120 at cell–cell junctions. Arrows indicate colocalization of ROCK1-GFP or KDIA-ROCK1-GFP with p120 in cytoplasmic vesicles. Scale bar: 10 μm.
ROCK1 localization was further assessed by using exogenous ROCK1 fused to green fluorescent protein (ROCK1-GFP). In cells expressing GFP alone, GFP was localized diffusely throughout the cytoplasm and nucleus but was not detectable at cell–cell junctions (Figure 2B, top panels). ROCK1-GFP was primarily localized in the cytoplasm; however, a distinct pool of ROCK1-GFP was localized to cell–cell junctions (Figure 2B, middle panels, arrowheads). Additionally, a kinase-dead, Rho-binding–deficient mutant of ROCK1, KDIA-ROCK1-GFP (Ishizaki et al., 1997), localized to both the cytoplasm and cell–cell junctions similarly to ROCK1-GFP (Figure 2B, bottom panels). In some cells, ROCK1-GFP and KDIA-ROCK1-GFP colocalized with p120 in cytoplasmic vesicles (arrows) in addition to cell–cell junctions, similar to endogenous ROCK1, although not all p120-containing vesicles costained with ROCK1. These data suggest that ROCK1 associates with p120 both within the AJ and in cytoplasmic vesicles, and that neither ROCK1 kinase activity nor Rho binding is required for this interaction.
ROCK1 is recruited to the AJ
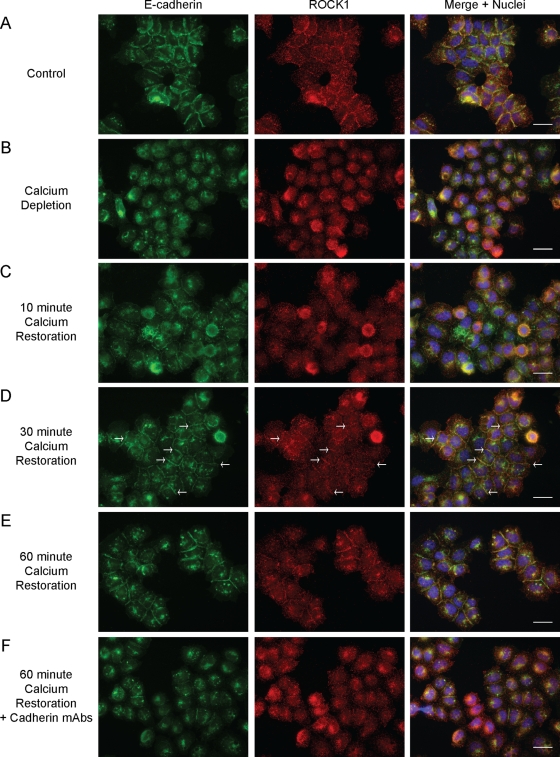
Because steady-state immunofluorescence suggested that ROCK1 associates with the AJ, a calcium-switch assay was performed to determine whether AJ manipulation affects ROCK1 localization. A431 cells were incubated in low-calcium media (LCM) to deplete extracellular calcium levels, and CaCl2 was added directly to the media to restore physiological calcium levels (1.8 mM CaCl2) prior to immunofluorescence analysis for E-cadherin and ROCK1. As Figure 3 illustrates, depletion of extracellular calcium eliminated cell–cell junctions and caused ROCK1 to localize diffusely throughout the cell (compare Figure 3A with Figure 3B). Ten minutes after calcium restoration, when cadherin contacts were initially established, little to no ROCK1 was detectable at the nascent AJ (Figure 3C). By 30 min, ROCK1 began to concentrate at the maturing junction (Figure 3D, arrows), and by 60 min, ROCK1 was highly concentrated at cell junctions (Figure 3E), similar to cells under normal calcium concentrations. Thus ROCK1 recruitment correlated with the increased clustering of E-cadherin at cell–cell junctions (as assessed by E-cadherin staining), suggesting that ROCK1 functionally contributes to the process. Importantly, inhibition of cadherin function with E-cadherin–and P-cadherin–blocking antibodies prevented the recruitment of ROCK1 (Figure 3F).
FIGURE 3:
ROCK1 is recruited to AJs. Immunofluorescence analysis of E-cadherin (green) and ROCK1 (red) in A431 cells during a calcium-switch assay. Cells were fixed and stained under the following conditions: (A) no calcium depletion (control), (B) depletion of calcium using LCM, (C) 10-min postcalcium restoration, (D) 30-min postcalcium restoration (arrows indicate low levels of ROCK1 at cell junctions), (E) 60-min postcalcium restoration, (F) 60-min postcalcium restoration with incubation with E-cadherin– and P-cadherin–blocking antibodies (HECD-1 and 6A9). Scale bars: 10 μm.
ROCK1 physically associates with the cadherin complex in a p120-dependent manner
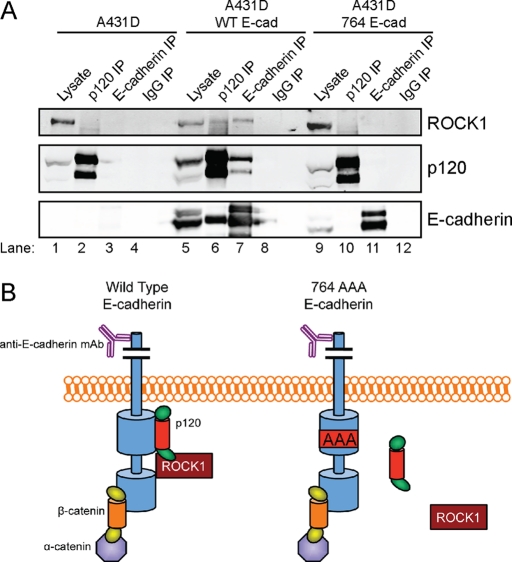
To determine whether ROCK1 is physically associated with the cadherin complex, cross-link immunoprecipitation experiments were performed in cadherin-negative A431D cells and A431D cells expressing either wild-type or p120-uncoupled 764AAA E-cadherin (Thoreson et al., 2000). p120 (Figure 4A, lanes 2, 6, and 10) and E-cadherin (Figure 4A, lanes 3, 7, and 11) were immunoprecipitated from cross-linked A431D lysates, along with an irrelevant control antibody (IgG; Figure 4A, lanes 4, 8, 12). Recovery of ROCK1, p120, and E-cadherin was assessed by Western blotting. ROCK1 coimmunoprecipitated with wild-type E-cadherin (Figure 4A, top panel, lane 7), indicating that ROCK1 physically associates with the cadherin complex. Importantly, ROCK1 did not coimmunoprecipitate with p120-uncoupled 764AAA E-cadherin (Figure 4A, top panel, lane 11), suggesting that ROCK1 only interacts with E-cadherin in the presence of p120. Similarly, ROCK1 only coimmunoprecipitated with p120 in the presence of wild-type E-cadherin (Figure 4A, top panel, compare lane 6 with lanes 2 and 10), suggesting that p120 and ROCK1 only interact at the cadherin complex. Thus ROCK1 associated with the cadherin complex in a p120-dependent manner, and only interacts with cadherin-bound p120. This result is illustrated schematically in Figure 4B.
FIGURE 4:
ROCK1 physically associates with the cadherin complex in a p120-dependent manner. (A) Coimmunoprecipitation of ROCK1 with wild-type E-cadherin in DSP–cross-linked A431D cells. Western blot analysis of ROCK1, p120, and E-cadherin in whole-cell lysates containing 10% of input (lanes 1, 5, and 9) or immunoprecipitations generated using p120 (lanes 2, 6, and 10), E-cadherin (lanes 3, 7, and 11), or control IgG (lanes 4, 8, and 12) mAbs. (B) A model depicting p120-dependent association of ROCK1 with the cadherin complex, as detected by immunoprecipitation in (A). The extracellular domain of E-cadherin has been truncated in this schematic.
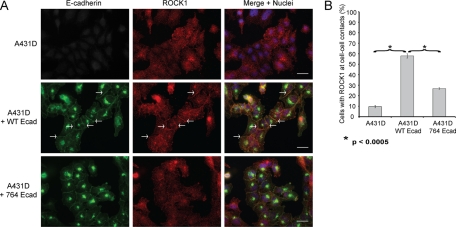
The immunoprecipitations in Figure 4A were performed under stringent radioimmunoprecipitation assay (RIPA) lysis conditions, thus allowing for immunoprecipitation of both surface and internalized E-cadherin. To examine the possibility that E-cadherin membrane localization is required for association with ROCK1, A431D cells were analyzed by immunofluorescence. In A431D cells expressing wild-type E-cadherin, ROCK1 localized efficiently to AJs (Figure 5A, arrows). However, in the presence of 764AAA E-cadherin, ROCK1 was significantly less abundant at cell junctions relative to cells expressing wild-type E-cadherin, despite similar levels of 764AAA E-cadherin at cell junctions compared with wild-type E-cadherin (Figure 5, A and B). In the presence of 764AAA E-cadherin, a small amount of ROCK1 was detectable at cell–cell contacts, possibly mediated by the pleckstrin homology (PH) domain of ROCK1, which targets signaling proteins to the cell membrane (Lemmon and Ferguson, 2000). Nonetheless, the localization of ROCK1 in A431D cells is consistent with our biochemical analysis (Figure 4). These data suggest that ROCK1 associated with the cadherin complex in a p120-dependent manner.
FIGURE 5:
ROCK1 localization in E-cadherin–reconstituted A431D cells. (A) ROCK1 colocalizes with wild-type E-cadherin. Immunofluorescence analysis of E-cadherin (green) and ROCK1 (red) in A431D cells expressing wild-type or 764AAA E-cadherin. White arrows indicate cell–cell contact localized ROCK1. Scale bars: 10 μm. (B) Quantification of cell–cell junction localization of ROCK1 junction localization in A431D cells. Bars represent the average percentage of cells in four 20× fields with ROCK1 localized to cell–cell contacts. Error bars represent SE of the mean. Statistical analysis was performed using a two-tailed t test.
p120 regulates ROCK1 localization
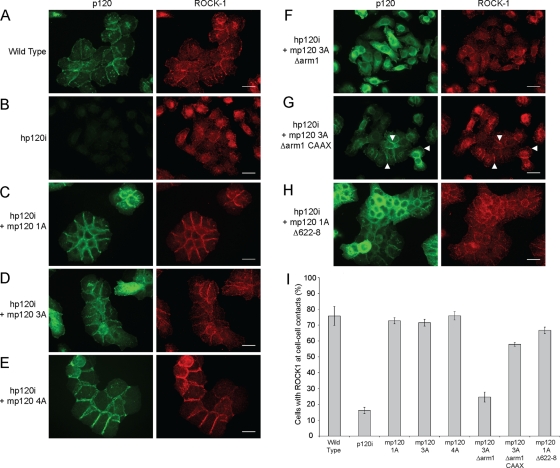
A p120 knockdown-reconstitution system (Davis et al., 2003) was used to assess the functional relationship between p120 and ROCK1. Briefly, A431 cells were retrovirally transduced to express human-specific p120 short hairpin RNA (shRNA), and p120 was then reconstituted by expressing murine p120, which is unaffected by the shRNA. Endogenous ROCK1 localization was assessed by immunofluorescence in wild-type A431 cells, p120-depleted cells (hp120i), and p120-reconstituted cells. Depletion of p120 leads to degradation of the cadherin complex; however, the cells retain weak cell–cell adhesion. Consistent with this, ROCK1 was significantly reduced at cell–cell contacts following p120 depletion (Figure 6B). p120 status did not affect ROCK1 protein levels (Supplemental Figure S1), suggesting that p120 regulates ROCK1 localization, but not stability.
FIGURE 6:
p120 regulates ROCK1 localization at cell–cell junctions. Immunofluorescence analysis of endogenous ROCK1 in wild-type A431 cells (A), hp120i A431 cells (B), or hp120i cells expressing (C) mp120 1A, (D) mp120 3A, (E) mp120 4A, (F) mp120 3A Δarm1, (G) mp120 3A Δarm1 CAAX, or (H) mp120 1A Δ622-8. Scale bars: 10 μm. (I) Quantification of ROCK1 localization at cell–cell contacts in the analyzed A431 cells lines. Bars represent the average percentage of cells in four 20× fields with ROCK1 localized to cell–cell contacts. Error bars represent SE of the mean.
Reconstitution of wild-type p120 efficiently stabilized cell–cell junctions and promoted ROCK1 localization at the cell junction (Figure 6, C–E), regardless of the isoform used for reconstitution (i.e., mp120 1A, 3A, or 4A). In addition, a Rho-uncoupled p120 mutant (mp120 1A Δ622-8; Anastasiadis et al., 2000) colocalized with ROCK1 at cell–cell contacts (Figure 6H). In contrast, a p120 mutant that does not bind to cadherins due to deletion of the first armadillo repeat (mp120 3A Δarm1, Figure 6F) localized diffusely throughout the cell and did not colocalize with ROCK1. However, membrane targeting of the Δarm1 mutant using a C-terminal CAAX motif (Wildenberg et al., 2006; Xia et al., 2006) restored colocalization of p120 and ROCK1 (Figure 6G). These data indicate that p120 regulates ROCK1 localization to cell–cell contacts when p120 is membrane associated (e.g., cadherin bound) and that the association of ROCK1 with p120 is independent of direct regulation of RhoA activity by p120.
ROCK1 depletion affects the cadherin complex
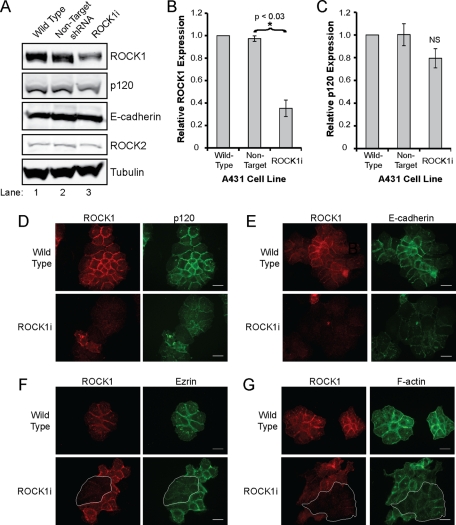
The functional relationship between ROCK1 and p120 was further assessed by shRNA-mediated depletion of ROCK1 in A431 cells. We achieved ∼65% depletion of endogenous ROCK1 in A431 cells, with no change in ROCK2, p120, or E-cadherin levels, as assessed by Western blotting (Figure 7A, compare lane 3 with lanes 1 and 2). Immunofluorescence analysis indicated that knockdown of ROCK1 was mosaic, with a small population (∼30%) of cells expressing little to no ROCK1 (ROCK1i cells) that exhibited a larger, flattened appearance (Figure 7D), suggesting reduced contractility in the absence of ROCK1.
FIGURE 7:
Knockdown of ROCK1 affects cell–cell adhesion. (A) Western blot analysis of wild-type A431 cells (lane 1) and A431 cells expressing nontarget (lane 2) or ROCK1 shRNA (ROCK1i, lane 3). (B and C) Quantification of ROCK1 (B) and p120 (C) levels, as detected by Western blotting. Bars represent the relative ROCK1 or p120 levels normalized to tubulin, averaged from three experiments. Error bars represent SE of the mean. Statistical significance was determined using a two-tailed t test and a cutoff of p < 0.05; NS indicates no significant difference. (D to G) Effects of ROCK1 depletion. Immunofluorescence analysis of ROCK1 (red) and p120 (D), E-cadherin (E), ezrin (F), and F-actin (G) in wild-type A431 cells and A431 cells expressing ROCK1 shRNA. Where applicable, ROCK1 knockdown cells are outlined in white (F, G). Scale bars: 10 μm.
Strikingly, distribution of p120 and E-cadherin was dramatically altered in the ROCK1i cells, particularly at cell–cell junctions (Figure 7, D and E, respectively). As assessed by p120 and E-cadherin immunofluorescence, AJs were discontinuous, with multiple gaps between cells, compared with the tight, continuous AJs in wild-type cells. α-catenin, β-catenin, plakoglobin, and P-cadherin were similarly affected in ROCK1i cells (Figure S2), suggesting that ROCK1 depletion affects the entire cadherin complex. Membrane localization of ezrin was also disrupted (Figure 7F), indicating that ROCK activity was deficient in ROCK1i cells. Analysis of the actin cytoskeleton using phalloidin revealed that the junctional actin network of ROCK1i cells was disrupted (Figure 7G), which could account for the disruption of the cadherin complex. Similar disruption of p120 distribution was observed in ROCK1-depleted MCF-7 cells (Figure S3). These effects appear to be specific to ROCK1, as ROCK2 depletion does not affect p120, E-cadherin, ezrin, or actin staining (Figure S4).
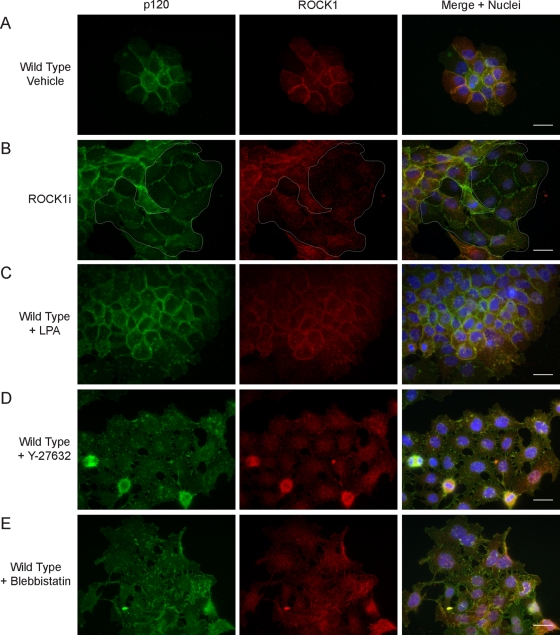
To determine whether the disorganization of the cadherin complex in ROCK1i cells was the result of disruption of the actomyosin pathway, we used chemical inhibitors to ablate ROCK and myosin II activity in wild-type A431. In parallel, we examined the effects of ROCK activation on the cadherin complex by treating cells with a RhoA activator. Cells were serum-starved and treated with dimethyl sulfoxide (DMSO) vehicle alone (Figure 8A), 5 μM lysophosphatidic acid (LPA) (Figure 8C), 10 μM Y-27632 (Figure 8D), or 10 μM blebbistatin (Figure 8E) for 24 h, then processed for immunofluorescence analysis to detect p120 and ROCK1. For comparison, ROCK1i cells were also serum-starved and analyzed (Figure 8B). Activation of RhoA with LPA did not affect p120 or ROCK1 localization, but Y-27632 and blebbistatin resulted in large cells with disorganized AJs, as assessed by p120 staining. The effects of Y-27632 and blebbistatin treatments were similar to ROCK1 depletion, but both inhibitors caused a more dramatic disruption of overall cell morphology than ROCK1 depletion. Thus the effects of ROCK1 depletion are comparable to the effects of global ROCK inhibition. Furthermore, inhibition of myosin II produces the same phenotype as ROCK inhibition. These results suggest that disruption of ROCK-dependent actomyosin contractility is responsible for the cell–cell adhesion defects observed in ROCK1i cells.
FIGURE 8:
Inhibition, but not activation, of ROCK activity mimics the effects of ROCK1 depletion. Immunofluorescence analysis p120 (green) and ROCK1 (red) of vehicle-treated wild-type A431 cells (A), A431 cells expressing ROCK1 shRNA, outlined in white (B), and wild-type A431 cells treated with 5 μM LPA (C), 10 μM Y-27632 (D), or 10 μM blebbistatin (E) for 24 h. Scale bar: 10 μm.
DISCUSSION
The relationship between the cadherin-stabilization and Rho-regulatory functions of p120 remains unclear, as do the mechanisms regulating actomyosin contractility at the AJ. In this study, we demonstrate for the first time that ROCK1, a major RhoA effector, physically associates with the cadherin complex through p120. Our data favor a model whereby p120 localizes RhoA signaling to the cadherin complex, in part by recruiting upstream regulators (p190A; Wildenberg et al., 2006) and downstream effectors (ROCK1).
Importantly, the association of ROCK1 with the cadherin complex is dependent on p120. ROCK1 specifically coimmunoprecipitates with wild-type E-cadherin, but not with p120-uncoupled 764AAA E-cadherin, from cross-linked A431D cell lysates. The failure to recruit ROCK1 to the cadherin complex likely contributes to the altered cytoskeletal organization previously reported in A431D cells expressing 764AAA E-cadherin (Thoreson et al., 2000). The time course of ROCK1 recruitment to the AJ is consistent with establishment of a junctional actin network (Zhang et al., 2005). Junctional actin is not necessary for the establishment of cell–cell contacts but is instead involved in stabilizing clustered cadherins. Interestingly, ROCK1 depletion does not eliminate cell–cell adhesion or affect cadherin stability but instead disrupts the normal organization of the cadherin complex and F-actin at cell–cell junctions. In the case of the 764AAA E-cadherin, p120 is not bound to the complex, and ROCK1 therefore does not associate with the cadherins and presumably is not properly localized to modulate junctional actin. While AJs are weakened following ROCK1 depletion, pharmaceutical inhibition of ROCK or myosin II dramatically disrupts cell–cell contacts (Figure 8), which is consistent with several lines of evidence indicating a requirement for ROCK and myosin II activity in cadherin function (Shewan et al., 2005). The more dramatic effect of pharmaceutical inhibition of ROCK or myosin II on cell–cell junctions, compared with ROCK1 depletion, suggests that either 1) ROCK2 contributes to cadherin function or 2) incomplete ROCK1 knockdown permits low levels of cell–cell adhesion. Depletion of ROCK2, however, has little or no detectable effect on cell–cell adhesion, indicating that, at least in A431 cells, ROCK1 is the primary isoform active at cell junctions. This conclusion is supported by the identification of ROCK1, but not ROCK2, in p120 ReCLIP experiments.
Recent studies utilizing human embryonic stem cells (hESCs) have implicated ROCK and myosin II activity in the regulation of AJs. In hESCs, inhibition or depletion of myosin IIA led to dramatic loss of E-cadherin due to down-regulation of p120 (Li et al., 2010). Similarly, inhibition of either ROCK or myosin II activity disrupts cell–cell adhesion in both human and murine embryonic stem cells (Harb et al., 2008). However, ROCK1 depletion of pharmacological inhibition of ROCK and myosin II had no effect on cadherin levels in our experiments. Thus it appears that inhibition of actomyosin contractility in A431 epidermoid carcinoma cells affects the distribution, rather than the stability, of the cadherin complex (Figure 7).
More importantly, however, studies in hESC systems indicate a link between contractility, cadherins, and the capacity for self-renewal. Dissociation of hESCs causes ROCK-dependent anoikis (Watanabe et al., 2007; Smutny et al., 2010) due to excess actomyosin contractility (Chen et al., 2010). Disruption of the AJs and subsequent dissociation of hESCs leads to an increase in RhoA activation and apoptosis (Ohgushi et al., 2010), whereas inhibition of ROCK activity allows hESCs to maintain self-renewal capacity in the absence of other factors, including feeder cells, Matrigel, and even tissue culture–treated dishes (Harb et al., 2008). In hESCs, E-cadherin promotes the expression of stem cell markers, suggesting that p120 functionally contributes to pluripotency through its obligatory role in stabilizing E-cadherin (Li et al., 2010). Given our data, we suggest that p120 also contributes to these processes through regulation of cadherin-associated RhoA/ROCK1 signaling.
The relationship between cadherins, ROCK, and self-renewal is likely relevant to the tumor stem cell hypothesis, which suggests that tumors are maintained by subpopulations of “stem cells” with the capacity to self-renew and support tumor formation (Chaffer and Weinberg, 2011). A role for p120 in tumor stem cell survival is supported by our previous studies in Madin-Darby canine kidney cells transformed by oncogenic Src or Rac1. While expression of these oncogenes permits anchorage-independent growth, a classical assay for tumorigenicity, p120 loss reverses this effect in a manner dependent on ROCK activity (Dohn et al., 2009). In this case, the absence of p120 elevates ROCK activity, which apparently promotes anoikis of unanchored tumorigenic cells, a scenario analogous to that reported in hESCs (Ohgushi et al., 2010).
A functional relationship between p120 and RhoA, upstream of ROCK1, has been identified in several earlier studies (Anastasiadis et al., 2000; Wildenberg et al., 2006; Castaño et al., 2007; Yanagisawa et al., 2008). In this study, we report that ROCK1 itself associates with p120, although it remains unclear whether the interaction is direct. Interestingly, we have also detected p190A in ReCLIP experiments from MCF-7 cells (Table S2), consistent with previous observations in NIH 3T3 cells (Wildenberg et al., 2006). Thus, in addition to suppressing RhoA by various means, p120 recruits a major RhoA activator to modulate downstream signaling at the cadherin complex. Taken together, these data point to a dynamic RhoA complex with Rho effectors (ROCK1) and Rho suppressors (p190A and p120) forming a functional nexus of RhoA signaling. This allows rapid, localized cycling between activation and suppression of RhoA/ROCK signaling in response to specific cues, such as Rac1 activation (Figure 9). Notably, a similar model of localized Rho regulation, involving a DDR1-Par3/Par6-p190A complex that associates with E-cadherin, has been proposed to regulate collective cell migration, a process that requires precisely localized regulation of contractility to enable motility of the group while maintaining individual cell–cell adhesions (Hidalgo-Carcedo et al., 2011).
FIGURE 9:
Dynamic regulation of RhoA activity at the cadherin complex. A schematic illustrating a possible mechanism of Rho regulation at the cadherin complex. p120 appears to recruit both ROCK1 and p190A RhoGAP to the cadherin complex and facilitate cycling between active and inactive RhoA signaling at the junction. p120-associated ROCK1 is then positioned to promote contractility in actin filaments at the AJ. Rac1 activation by RTK signaling (or other sources) is thought to induce transient p190A RhoGAP association with p120 and localized suppression of RhoA signaling. The extracellular domain of E-cadherin has been truncated in this schematic.
In conclusion, we have identified a novel p120-dependent interaction between ROCK1 and the cadherin complex. Our data further support a model in which Rho activity is dynamically regulated at the cadherin complex, which could facilitate a variety of processes (depending on cellular context), including cadherin clustering, collective cell migration, and self-renewal. Our findings suggest a more complex role for p120 in the control of RhoA signaling than previously appreciated, with p120 recruiting upstream regulators and downstream effectors of RhoA to the cadherin complex in order to focus the effects of RhoA signaling at cell–cell junctions.
MATERIALS AND METHODS
Cell lines
Phoenix 293 cells were a kind gift from Linda Sealy (Vanderbilt University, Nashville, TN). A431 and A431D epidermoid cervical carcinoma cell lines were obtained from Margaret Wheelock (University of Nebraska Medical Center, Omaha, NE). A431D cells expressing wild-type or 764AAA E-cadherin (Thoreson et al., 2000) were generated using the LZRS-neo retroviral vector as described previously (Ireton et al., 2002). A431, A431D, MCF-7, MCF-10A, and Caco-2 cells were cultured in DMEM (Life Technologies/Invitrogen, Carlsbad, CA) supplemented with 10% fetal bovine serum (FBS; Hyclone/Thermo Scientific, Logan, UT) and 1% penicillin–streptomycin (Life Technologies/Invitrogen). Phoenix 293 and 293T cells were cultured in DMEM supplemented with 10% heat-inactivated FBS and 1% penicillin–streptomycin. For drug treatments, RhoA activator LPA (Sigma-Aldrich, St. Louis, MO), ROCK inhibitor Y-27632 (EMD/Millipore, Billerica, MA), and myosin II inhibitor (−)-blebbistatin (EMD/Millipore) were added directly to the media.
Calcium-switch assay
A431 cells were plated onto glass coverslips for immunofluorescence analysis in standard DMEM growth media. Approximately 24 h after plating, cells were serum-starved overnight. The next day, starvation media was removed and replaced with LCM (calcium-free DMEM supplemented with 5.0 μM CaCl2). Cells were incubated in LCM for 2 h, and 1.8 mM CaCl2 was added directly to cells for the indicated time intervals prior to processing (see Figure 3). For control cells, 1.8 mM CaCl2 was added immediately to LCM to prevent calcium depletion. For cadherin-blocking experiments, cells were incubated with 5 μg/ml HECD1 (anti–E-cadherin mAb) and 2 μg/ml 6A9 (anti–P-cadherin mAb) in LCM for 30 min prior to calcium restoration.
Retrovirus and lentivirus production and infection
To generate retrovirus particles, we transfected the Phoenix 293 cells using a previously described calcium phosphate method (Davis et al., 2003). Retrovirus constructs used were based on the LZRS-neo and pRetro-Super (pRS) shRNA vectors described previously (Ireton et al., 2002; Davis et al., 2003). Virus was harvested 48 h posttransfection by passing the cell-culture media through a 0.45-μm filter. Target cells were transduced by incubation with retrovirus-containing media containing 4 μg/ml Polybrene. Approximately 48 h postinfection, infected cells were selected using either G418 (for LZRS-neo transductions) or puromycin (for pRS transductions).
To generate lentiviral particles, 293T cells were cotransfected with the pLKO.1 shRNA plasmid of interest, pCMV-dR7.74psPAX2 packaging plasmid, and pMD2.G envelope plasmid, using a previously described calcium phosphate method (Brown et al., 2009). Lentivirus was harvested 48 h posttransfection, and target cells were transduced as described above. Approximately 48 h postinfection, infected cells were selected using puromycin.
Plasmids
The LZRS-neo vector was used for exogenous expression of p120, E-cadherin, and ROCK1-GFP. p120, and E-cadherin constructs used are as follows: LZRS-neo mp120 1A, LZRS-neo mp120 3A, LZRS-neo mp120 4A, LZRS-neo mp120 3A Δarm1 (Ireton et al., 2002), LZRS-neo mp120 3A Δarm1 CAAX (Xia et al., 2006), LZRS-neo mp120 1A Δ622-8 (Anastasiadis et al., 2000), LZRS-neo E-cadherin, and LZRS-neo 764AAA E-cadherin (Xia et al., 2006).
Wild-type and KDIA-ROCK1 expression vectors were originally generated in pCMX (Ishizaki et al., 1997). To generate LZRS-neo ROCK1-GFP, the ROCK1 open reading frame was PCR-amplified with the stop codon removed and subsequently ligated in pENTR 3C using KpnI and NotI restriction enzyme sites to generate pENTR-ROCK1 Δstop. pENTR-ROCK1 Δstop was recombined with LZRS-neo GW-GFP using the Gateway Cloning system (Invitrogen) to generate LZRS-neo ROCK1-GFP. An empty pENTR vector with the ccdB selection gene removed by EcoRI digest and subsequent ligation was used to generate the LZRS-neo GFP-alone control plasmid.
For shRNA-mediated knockdown of p120, pRS-hp120 was used as described previously (Davis et al., 2003). For ROCK1 knockdown, nontarget or ROCK1 shRNA constructs in the pLKO.1 lentivirus vector were purchased from Sigma-Aldrich. For all ROCK1-knockdown experiments described herein, cells transduced with ROCK1 shRNA TRCN0000121094 are shown. Similar results were obtained using ROCK1 shRNA TRCN0000002160.
Antibodies
The generation of mAbs and polyclonal antibodies (pAbs) for p120 (pp120, 15D2, 8D11, F1αSH) has been described (Wu et al., 1998). Unless otherwise noted, mAb 15D2 was used for all p120 immunoprecipitations, while mAb 8D11 was used as a control IgG, because it does not recognize human p120. Other antibodies used include anti–E-cadherin mAb (BD Biosciences, Franklin Lakes, NJ), anti–α-catenin mouse mAb (Life Technologies/Invitrogen), anti–β-catenin mouse mAb (Life Technologies/Invitrogen), anti-ROCK1 rabbit pAb (EMD/Millipore), ezrin mAb (BD Biosciences), anti-GFP mAb (Roche, Basel, Switzerland), and anti-tubulin mAb (clone DM1A; Sigma-Aldrich). Anti–E-cadherin and anti–P-cadherin mAbs HECD1 and 6A9, respectively, were kind gifts from Margaret Wheelock. Secondary antibodies for Western blot analysis included anti–mouse Alexa Fluor 680 (Molecular Probes/Invitrogen) and anti–rabbit IRdye 800 (Rockland Immunochemicals, Boyertown, PA). Secondary antibodies used for immunofluorescence analysis included anti–mouse IgG, anti–mouse IgG2a, and anti–rabbit IgG conjugated to Alexa Fluor 488 or 594 (Molecular Probes/Invitrogen).
In-cell cross-linking
In-cell cross-linking was performed using dithiobis(succinimidyl propionate) (DSP) and dithiobismaleimidoethane (DTME; Pierce/Thermo Scientific, Rockford, IL) as described previously (Smith et al., 2011). Cross-linkers were freshly prepared as a 20 mM solution in DMSO and diluted to a working concentration of 0.5 mM in phosphate-buffered saline (PBS; pH 7.4; Thermo Fisher Scientific, Waltham, MA). Cells were washed twice with PBS at room temperature and then incubated with the cross-linker solution for 30 min at room temperature. After removal of the cross-linker solution, cells were incubated at room temperature for 10 min with quenching solution (20 mM Tris-Cl, pH 7.4, 5 mM l-cysteine). Quenching solution was then removed, and cell lysates were prepared as described in the following section.
Lysate preparation, immunoprecipitation, and Western blot analysis
Lysis, immunoprecipitation, and Western blot methods have been described previously (Xia et al., 2006). Briefly, cells were lysed in RIPA buffer (50 mM Tris, pH 7.4, 150 mM NaCl, 1% NP-40, 0.5% deoxycholic acid, 0.1% SDS) supplemented with protease and phosphatase inhibitors (1 mM phenylmethylsulfonyl fluoride [PMSF], 5 mg/ml leupeptin, 2 mg/ml aprotinin, 1 mM EDTA, 50 mM NaF, and 1 mM NaVO4) in an ice-water bath. Lysates were cleared by centrifugation, and total protein concentrations were determined by bicinchoninic acid assay (Pierce/Thermo Scientific). For immunoprecipitation, the specified antibody was added to the clarified lysate for 2 h at 4°C with end-over-end rotation, which was followed by incubation with protein G Sepharose (GE Healthcare) for an additional hour at 4°C. Beads were washed with lysis buffer, resuspended in 2X Laemmli sample buffer, and boiled for 5 min. Cross-linked lysates were incubated with 50 mM dithiothreitol (DTT) for 15 min prior to boiling to ensure cleavage of disulfide bonds within the cross-linkers.
Immunoprecipitations and whole-cell lysates were separated by SDS–PAGE and transferred to nitrocellulose membranes (Whatman, Piscataway, NJ) for Western blotting. Nonspecific binding to membranes was blocked with 3% nonfat milk in Tris-buffered saline (10 mM Tris, pH 7.4, 150 mM NaCl), and membranes were incubated overnight with primary antibody in milk at 4°C. Membranes were incubated with secondary antibody in Odyssey blocking buffer (LI-COR Biosciences, Lincoln, NE) for 1 h at room temperature. Antibodies were detected using the Odyssey infrared imaging system (LI-COR). Quantitative analysis of Western blots was performed using Odyssey imaging software. Signals were normalized to tubulin, and statistical analysis was carried out using a two-tailed t test.
ReCLIP procedure
The ReCLIP procedure has been previously described in detail (Smith et al., 2011) Briefly, four 15-cm dishes each of 90% confluent A431, MCF-7, MCF-10A, and CaCo-2 cells (∼1 × 10⁸ cells) were used for each experiment. Cells were washed twice with freshly prepared PBS (pH 7.4) and incubated with 10 ml of 0.5 mM cross-linker solution for 30 min at room temperature, with occasional agitation. Cross-linker solution was then removed, and 10 ml quenching solution was added to each plate for an additional 10 min. Following quenching, plates were placed on an ice-water bath, washed once more with chilled PBS, and lysed with freshly prepared RIPA buffer plus protease and phosphatase inhibitors (1 ml RIPA buffer per dish). Lysates were homogenized using a 23-gauge needle and cleared by centrifugation. Equal volumes of clarified lysate were incubated with either 15D2 (p120) or 8D11 (control) bound protein G Dynabeads (Invitrogen). The beads were then washed with RIPA buffer supplemented with protease and phosphatase inhibitors. p120 binding partners were eluted by incubating the beads with RIPA buffer supplemented with 50 mM DTT for 30 min at 37°C with end-over-end rotation.
Mass spectrometry and protein identification
Proteins in ReCLIP eluates were resolved by SDS–PAGE and visualized with colloidal Coomassie stain (Candiano et al., 2004). Protein was excised, cut into 1-mm cubes, and equilibrated in 50 mM NH4HCO3. Proteins were then reduced within the gel pieces with DTT (3 mM in 100 mM NH4HCO3, 37°C for 15 min), which was followed by alkylation with iodoacetamide (6 mM in 50 mM NH4HCO3 for 15 min). The gel pieces were then dehydrated with acetonitrile and rehydrated with 15 ml 12.5 mM NH4HCO3 containing 0.01 mg/ml trypsin (Trypsin Gold; Promega, Madison, WI), and trypsin digestion was carried out for > 2 h at 37°C. Peptides were extracted with 60% acetonitrile, 0.1% formic acid; dried by vacuum centrifugation; and reconstituted in 15 ml 0.1% formic acid. Five milliliters of peptide hydrolysate were analyzed by C18 reverse-phase liquid chromatography–MS/MS using a Thermo LTQ ion trap mass spectrometer equipped with a Thermo MicroAS autosampler and Thermo Surveyor high-performance liquid chromatography pump, nanospray source, and Xcalibur 2.0 instrument control, using standard triple-play methods. Tandem MS data were analyzed with the Sequest algorithm to search a human subset of the UniRef100 database (23 January 2007: 223,514 entries) using Xcorr cutoffs of ≧ 1.8 for [M + 2H]2+/2 ions and ≧ 2.5 for [M + 3H]3+/3 ions. In addition, the database contained a concatenated reverse-decoy database to estimate false discovery rates, which were at 5% or below.
Immunofluorescence microscopy
Cells were plated on glass coverslips 2 d before treatment and processing for immunofluorescence staining. Briefly, cells were fixed in 3% paraformaldehyde for 30 min and permeabilized in PBS/0.2% Triton X-100 for 5 min. Cells were blocked with PBS containing 5% bovine serum albumin (BSA) for 10 min. Cells were incubated with the indicated primary antibodies diluted in 5% BSA for 30 min, and then with secondary antibodies for another 30 min. To stain actin, Alexa Fluor 488–conjugated phalloidin was used in place of a secondary antibody. Cells were stained with 0.5 μg/ml Hoechst dye in PBS for 1 min to stain nuclei. Coverslips with stained cells were mounted onto glass slides using Prolong Gold anti-fade reagent (Invitrogen) and imaged using a fluorescence microscope (Axio-Plan 2; Carl Zeiss, Oberkochen, Germany) with a 1.4 numerical aperture, 63× oil differential interference contrast objective. Images were acquired and processed using MetaMorph software (Molecular Devices, Sunnyvale, CA). To quantify cell–cell contact localization of ROCK1, four distinct regions of the coverslip were imaged with a 20× objective. Total cells were quantified using Hoechst-dye nuclei staining, and cells with ROCK1 localized to junctions were manually counted using ImageJ. The percent of cells with ROCK1 localized to cell–cell contacts in each field was calculated and averaged. Statistical analysis was performed using a two-tailed t test.
Supplementary Material
Acknowledgments
This work has been funded by National Institutes of Health Grants RO1-CA55724 and RO1-CA111947 to A.B.R., the Vanderbilt GI SPORE (50 CA95103) to R.J.C., and a Vanderbilt Cancer Center Support grant (P30-CA068485).
Abbreviations used:
- AJ
adherens junction
- BSA
bovine serum albumin
- DMSO
dimethyl sulfoxide
- DSP
dithiobis(succinimidyl propionate)
- DTME
dithiobismaleimidoethane
- DTT
dithiothreitol
- FBS
fetal bovine serum
- GAP
GTPase activating protein
- GFP
green fluorescent protein
- hESC
human embryonic stem cell
- IgG
immunoglobulin G
- hp120i
p120-depleted cells
- mAb
monoclonal antibody
- MS
mass spectrometry
- p120
p120-catenin
- p190A
p190A RhoGAP
- pAb
polyclonal antibody
- PBS
phosphate-buffered saline
- PH
pleckstrin homology
- PMSF
phenylmethylsulfonyl fluoride
- ReCLIP
reversible cross-link immunoprecipitation
- RIPA
radioimmunoprecipitation assay
- ROCK1/2
Rho-associated protein kinase 1/2
- ROCK1i
ROCK1-depleted cells
- shRNA
short hairpin RNA
Footnotes
This article was published online ahead of print in MBoC in Press (http://www.molbiolcell.org/cgi/doi/10.1091/mbc.E11-06-0497) on October 26, 2011.
REFERENCES
- Anastasiadis PZ, Moon SY, Thoreson MA, Mariner DJ, Crawford HC, Zheng Y, Reynolds AB. Inhibition of RhoA by p120 catenin. Nat Cell Biol. 2000;2:637–644. doi: 10.1038/35023588. [DOI] [PubMed] [Google Scholar]
- Anderson SC, Stone C, Tkach L, SundarRaj N. Rho and Rho-kinase (ROCK) signaling in adherens and gap junction assembly in corneal epithelium. Invest Ophthalmol Vis Sci. 2002;43:978–986. [PubMed] [Google Scholar]
- Betson M, Lozano E, Zhang J, Braga VMM. Rac activation upon cell-cell contact formation is dependent on signaling from the epidermal growth factor receptor. J Biol Chem. 2002;277:36962–36969. doi: 10.1074/jbc.M207358200. [DOI] [PubMed] [Google Scholar]
- Birukova AA, Zebda N, Cokic I, Fu P, Wu T, Dubrovskyi O, Birukov KG. p190RhoGAP mediates protective effects of oxidized phospholipids in the models of ventilator-induced lung injury. Exp Cell Res. 2010;317:859–872. doi: 10.1016/j.yexcr.2010.11.011. [DOI] [PMC free article] [PubMed] [Google Scholar]
- Braga VM, Betson M, Li X, Lamarche-Vane N. Activation of the small GTPase Rac is sufficient to disrupt cadherin-dependent cell-cell adhesion in normal human keratinocytes. Mol Biol Cell. 2000;11:3703–3721. doi: 10.1091/mbc.11.11.3703. [DOI] [PMC free article] [PubMed] [Google Scholar]
- Braga VM, Machesky LM, Hall A, Hotchin NA. The small GTPases Rho and Rac are required for the establishment of cadherin-dependent cell-cell contacts. J Cell Biol. 1997;137:1421–1431. doi: 10.1083/jcb.137.6.1421. [DOI] [PMC free article] [PubMed] [Google Scholar]
- Brown MV, Burnett PE, Denning MF, Reynolds AB. PDGF receptor activation induces p120-catenin phosphorylation at serine 879 via a PKCα-dependent pathway. Exp Cell Res. 2009;315:39–49. doi: 10.1016/j.yexcr.2008.09.025. [DOI] [PMC free article] [PubMed] [Google Scholar]
- Candiano G, Bruschi M, Musante L, Santucci L, Ghiggeri GM, Carnemolla B, Orecchia P, Zardi L, Righetti PG. Blue silver: a very sensitive colloidal Coomassie G-250 staining for proteome analysis. Electrophoresis. 2004;25:1327–1333. doi: 10.1002/elps.200305844. [DOI] [PubMed] [Google Scholar]
- Castaño J, Solanas G, Casagolda D, Raurell I, Villagrasa P, Bustelo XR, García de Herreros A, Duñach M. Specific phosphorylation of p120-catenin regulatory domain differently modulates its binding to RhoA. Mol Cell Biol. 2007;27:1745–1757. doi: 10.1128/MCB.01974-06. [DOI] [PMC free article] [PubMed] [Google Scholar]
- Chaffer CL, Weinberg RA. A perspective on cancer cell metastasis. Science. 2011;331:1559–1564. doi: 10.1126/science.1203543. [DOI] [PubMed] [Google Scholar]
- Chen G, Hou Z, Gulbranson DR, Thomson JA. Actin-myosin contractility is responsible for the reduced viability of dissociated human embryonic stem cells. Cell Stem Cell. 2010;7:240–248. doi: 10.1016/j.stem.2010.06.017. [DOI] [PMC free article] [PubMed] [Google Scholar]
- Davis MA, Ireton RC, Reynolds AB. A core function for p120-catenin in cadherin turnover. J Cell Biol. 2003;163:525–534. doi: 10.1083/jcb.200307111. [DOI] [PMC free article] [PubMed] [Google Scholar]
- Dohn MR, Brown MV, Reynolds AB. An essential role for p120-catenin in Src- and Rac1-mediated anchorage-independent cell growth. J Cell Biol. 2009;184:437–450. doi: 10.1083/jcb.200807096. [DOI] [PMC free article] [PubMed] [Google Scholar]
- Fukuyama T, Ogita H, Kawakatsu T, Inagaki M, Takai Y. Activation of Rac by cadherin through the c-Src-Rap1-phosphatidylinositol 3-kinase-Vav2 pathway. Oncogene. 2006;25:8–19. doi: 10.1038/sj.onc.1209010. [DOI] [PubMed] [Google Scholar]
- Goodwin M, Kovacs EM, Thoreson MA, Reynolds AB, Yap AS. Minimal mutation of the cytoplasmic tail inhibits the ability of E-cadherin to activate Rac but not phosphatidylinositol 3-kinase: direct evidence of a role for cadherin-activated Rac signaling in adhesion and contact formation. J Biol Chem. 2003;278:20533–20539. doi: 10.1074/jbc.M213171200. [DOI] [PubMed] [Google Scholar]
- Harb N, Archer TK, Sato N. The Rho-Rock-myosin signaling axis determines cell-cell integrity of self-renewing pluripotent stem cells. PLoS ONE. 2008;3:e3001. doi: 10.1371/journal.pone.0003001. [DOI] [PMC free article] [PubMed] [Google Scholar]
- Hidalgo-Carcedo C, Hooper S, Chaudhry SI, Williamson P, Harrington K, Leitinger B, Sahai E. Collective cell migration requires suppression of actomyosin at cell-cell contacts mediated by DDR1 and the cell polarity regulators Par3 and Par6. Nat Cell Biol. 2011;13:49–58. doi: 10.1038/ncb2133. [DOI] [PMC free article] [PubMed] [Google Scholar]
- Ireton RC, et al. A novel role for p120 catenin in E-cadherin function. J Cell Biol. 2002;159:465–476. doi: 10.1083/jcb.200205115. [DOI] [PMC free article] [PubMed] [Google Scholar]
- Ishizaki T, Naito M, Fujisawa K, Maekawa M, Watanabe N, Saito Y, Narumiya S. p160ROCK, a Rho-associated coiled-coil forming protein kinase, works downstream of Rho and induces focal adhesions. FEBS Lett. 1997;404:118–124. doi: 10.1016/s0014-5793(97)00107-5. [DOI] [PubMed] [Google Scholar]
- Laplante I, Béliveau R, Paquin J. RhoA/ROCK and Cdc42 regulate cell-cell contact and N-cadherin protein level during neurodetermination of P19 embryonal stem cells. J Neurobiol. 2004;60:289–307. doi: 10.1002/neu.20036. [DOI] [PubMed] [Google Scholar]
- Lemmon MA, Ferguson KM. Signal-dependent membrane targeting by pleckstrin homology (PH) domains. Biochem J. 2000;350:1–18. [PMC free article] [PubMed] [Google Scholar]
- Li D, et al. Integrated biochemical and mechanical signals regulate multifaceted human embryonic stem cell functions. J Cell Biol. 2010;191:631–644. doi: 10.1083/jcb.201006094. [DOI] [PMC free article] [PubMed] [Google Scholar]
- Molina-Ortiz I, Bartolomé RA, Hernández-Varas P, Colo GP, Teixidó J. Overexpression of E-cadherin on melanoma cells inhibits chemokine-promoted invasion involving p190RhoGAP/p120ctn-dependent inactivation of RhoA. J Biol Chem. 2009;284:15147–15157. doi: 10.1074/jbc.M807834200. [DOI] [PMC free article] [PubMed] [Google Scholar]
- Ohgushi M, et al. Molecular pathway and cell state responsible for dissociation-induced apoptosis in human pluripotent stem cells. Cell Stem Cell. 2010;7:225–239. doi: 10.1016/j.stem.2010.06.018. [DOI] [PubMed] [Google Scholar]
- Rimm DL, Koslov ER, Kebriaei P, Cianci CD, Morrow JS. α1(E)-catenin is an actin-binding and -bundling protein mediating the attachment of F-actin to the membrane adhesion complex. Proc Natl Acad Sci USA. 1995;92:8813–8817. doi: 10.1073/pnas.92.19.8813. [DOI] [PMC free article] [PubMed] [Google Scholar]
- Shewan AM, Maddugoda M, Kraemer A, Stehbens SJ, Verma S, Kovacs EM, Yap AS. Myosin 2 is a key Rho kinase target necessary for the local concentration of E-cadherin at cell-cell contacts. Mol Biol Cell. 2005;16:4531–4542. doi: 10.1091/mbc.E05-04-0330. [DOI] [PMC free article] [PubMed] [Google Scholar]
- Smith AL, Friedman DB, Yu H, Carnahan RH, Reynolds AB. ReCLIP (reversible cross-link immuno-precipitation): an efficient method for interrogation of labile protein complexes. PLoS ONE. 2011;6:e16206. doi: 10.1371/journal.pone.0016206. [DOI] [PMC free article] [PubMed] [Google Scholar]
- Smutny M, Cox HL, Leerberg JM, Kovacs EM, Conti MA, Ferguson C, Hamilton NA, Parton RG, Adelstein RS, Yap AS. Myosin II isoforms identify distinct functional modules that support integrity of the epithelial zonula adherens. Nat Cell Biol. 2010;12:696–702. doi: 10.1038/ncb2072. [DOI] [PMC free article] [PubMed] [Google Scholar]
- Thoreson MA, Anastasiadis PZ, Daniel JM, Ireton RC, Wheelock MJ, Johnson KR, Hummingbird DK, Reynolds AB. Selective uncoupling of p120(ctn) from E-cadherin disrupts strong adhesion. J Cell Biol. 2000;148:189–202. doi: 10.1083/jcb.148.1.189. [DOI] [PMC free article] [PubMed] [Google Scholar]
- Walsh SV, Hopkins AM, Chen J, Narumiya S, Parkos CA, Nusrat A. Rho kinase regulates tight junction function and is necessary for tight junction assembly in polarized intestinal epithelia. Gastroenterology. 2001;121:566–579. doi: 10.1053/gast.2001.27060. [DOI] [PubMed] [Google Scholar]
- Watanabe K, et al. A ROCK inhibitor permits survival of dissociated human embryonic stem cells. Nat Biotechnol. 2007;25:681–686. doi: 10.1038/nbt1310. [DOI] [PubMed] [Google Scholar]
- Wildenberg GA, Dohn MR, Carnahan RH, Davis MA, Lobdell NA, Settleman J, Reynolds AB. p120-catenin and p190RhoGAP regulate cell-cell adhesion by coordinating antagonism between Rac and Rho. Cell. 2006;127:1027–1039. doi: 10.1016/j.cell.2006.09.046. [DOI] [PubMed] [Google Scholar]
- Wójciak-Stothard B, Potempa S, Eichholtz T, Ridley AJ. Rho and Rac but not Cdc42 regulate endothelial cell permeability. J Cell Sci. 2001;114:1343–1355. doi: 10.1242/jcs.114.7.1343. [DOI] [PubMed] [Google Scholar]
- Wu J, Mariner DJ, Thoreson MA, Reynolds AB. Production and characterization of monoclonal antibodies to the catenin p120ctn. Hybridoma. 1998;17:175–183. doi: 10.1089/hyb.1998.17.175. [DOI] [PubMed] [Google Scholar]
- Xia X, Carnahan RH, Vaughan MH, Wildenberg GA, Reynolds AB. p120 serine and threonine phosphorylation is controlled by multiple ligand-receptor pathways but not cadherin ligation. Exp Cell Res. 2006;312:3336–3348. doi: 10.1016/j.yexcr.2006.07.007. [DOI] [PubMed] [Google Scholar]
- Yamada S, Pokutta S, Drees F, Weis WI, Nelson WJ. Deconstructing the cadherin-catenin-actin complex. Cell. 2005;123:889–901. doi: 10.1016/j.cell.2005.09.020. [DOI] [PMC free article] [PubMed] [Google Scholar]
- Yanagisawa M, Huveldt D, Kreinest P, Lohse CM, Cheville JC, Parker AS, Copland JA, Anastasiadis PZ. A p120 catenin isoform switch affects Rho activity, induces tumor cell invasion, and predicts metastatic disease. J Biol Chem. 2008;283:18344–18354. doi: 10.1074/jbc.M801192200. [DOI] [PMC free article] [PubMed] [Google Scholar]
- Zhang J, Betson M, Erasmus J, Zeikos K, Bailly M, Cramer LP, Braga VMM. Actin at cell-cell junctions is composed of two dynamic and functional populations. J Cell Sci. 2005;118:5549–5562. doi: 10.1242/jcs.02639. [DOI] [PubMed] [Google Scholar]
Associated Data
This section collects any data citations, data availability statements, or supplementary materials included in this article.


