

Abstract
Objectives
Cerebral white matter lesions (WMLs) reflect small vessel disease, are common in elderly individuals and are associated with cognitive impairment. We sought to determine the relationships between WMLs, age, gray matter (GM) volume, and cognition in the Cardiovascular Health Study (CHS).
Methods
From the CHS we selected 740 cognitively normal controls with a 1.5 T MRI scan of the brain and a detailed diagnostic evaluation. WML severity was determined using a standardized visual rating system. GM volumes were analyzed using voxel-based morphometry implemented in the Statistical Parametric Mapping software.
Results
WMLs were inversely correlated with GM volume, with the greatest volume loss in the frontal cortex. Age related atrophy was observed in the hippocampus and posterior cingulate cortex. Regression analyses revealed links among age, APOE*4 allele, hypertension, WMLs, GM volume, and digit symbol substitution test scores.
Conclusions
Both advancing age and hypertension predict higher WML load, which is itself associated with GM atrophy. Longitudinal data are needed to confirm the temporal sequence of events leading to a decline in cognitive function.
Keywords: White matter lesions, age, gray matter volume, cognition
1. Introduction
Leukoaraiosis or white matter lesions (WMLs) are common in elderly individuals and typically manifest as white matter hyper-intensities on T2-weighted, fluid attenuated inversion recovery (FLAIR), or proton density MRI scans (Longstreth et al. 1996). Increased WML burden corresponds to loss of myelinated axons, gliosis, enlarged perivascular spaces, and small vessel disease (SVD) (Grafton et al., 1991; Kobari et al., 1990; Scheltens et al., 1995). WMLs occur more frequently with older age, as a consequence of hypertension (HTN), and they were considered risk factors for incident stroke and dementia (Kuller et al., 2004; Kuller et al., 2003). Further, WMLs have been hypothesized to promote deposition of β-amyloid leading to Alzheimer’s disease (AD) (Bartzokis et al., 2007). Therefore, WMLs are an important area of investigation in brain aging because they are a biomarker of end organ damage secondary to hypertensive vascular disease in the brain, and of increased risk for AD.
There is a range of cross-sectional data documenting the relationship between WMLs and cognition (Bartzokis et al., 2003; Longstreth et al. 1996; Pantoni et al., 1999; Vernooij et al., 2009), but the links between WMLs and gray matter (GM) volume have not been investigated using whole brain voxel level techniques. Prior work using whole brain metrics such as parenchymal and ventricular fractions suggest that WMLs are a risk factor for subcortical and cortical brain atrophy (Appelman et al, 2009). Other studies have shown a link between regionally specific brain atrophy (e.g., hippocampus) and perceived cognitive abilities, as well as links between WMLs and brain structure (Mok et al., 2008; van Norden et al., 2008). Understanding the specific relationships between WMLs and brain structure can therefore lend insight into the pathophysiology of cognitive disorders in the elderly.
We, among others, have shown that older age is strongly linked to decreased GM volume, particularly in the hippocampus and frontal lobes (Raji et al, 2009; Salat et al., 2004; Salat, Kaye, and Janowsky, 2000). Co-morbid vascular disease (e.g., hypertension) and WMLs can influence age-related brain atrophy and cognition (Enzinger et al., 2005; Raz and Rodrigue, 2003; Raz and Rodrigue, 2006; Rodrigue et al., 2011). Together, these and other studies suggest that factors linked to age are a driving force behind atrophy and cognitive decline in late life, mediating the apparent link between age and brain structure/function (Rabbitt et al., 2006). This is important because to the extent that the clinical expression of neurodegenerative processes such as AD is moderated by cognitive or brain reserve (Satz, 1991; Stern et al., 1992), then factors that affect reserve are critical to our understanding the pathophysiology and the prevention of these clinical syndromes. We hypothesize that WMLs, acting as a biomarker of long-term vascular disease in the brain, are linked to a decrease in GM volume and to poorer cognition.
We sought to determine (i) whether greater WML burden translated to lower GM volume, (ii) the influence of age on this relationship, and (iii)the relative contribution of WMLs to cognition through the relationship with GM. To answer these questions, we used voxel-based morphometry (VBM) with 3-D volumetric MRI scans in cognitively normal participants drawn from a community cohort, the Cardiovascular Health Study-Cognition Study (CHS-CS) (Kuller et al., 2003).
2. Materials and Methods
2.1 Participants
The CHS-CS is derived from the larger multi-site Cardiovascular Health Study, a population-based longitudinal study of coronary heart disease and stroke in persons aged 65 and older (Fried et al, 1991). CHS recruitment was based on the Medicare eligibility lists in: Forsyth County, North Carolina; Sacramento County, California; Washington County, Maryland; and Pittsburgh, Pennsylvania. The CHS enrolled 5201 participants in 1989–90 and an additional 687 African American participants in 1992–93. The selection for enrollment into the CHS was not based on cognitive status. The Institutional Review Board at each site approved the study methods, and all participants gave written informed consent. Each year, the participants completed the Modified Mini-Mental State Examination (3MSE) (Teng and Chui, 1987), the Digit Symbol Substitution Test (DSST) (Wechsler, 1981), the Benton Visual Retention Test (BVRT) (Benton et al., 1983), and the modified version of the Center for Epidemiology Studies Depression Scale (CES-D) (Andresen et al, 1994).
2.2 The CHS Memory Study
In 1991/1992, 3608 of the CHS participants underwent an MRI of the brain. In 1998–99, the CHS re-scanned all available, living participants and completed neurobehavioral evaluations on them (N=2101) (See Kuller et al., 2003 for details). Information on participants’ cognition was obtained from their proxies using the Informant Questionnaire for Cognitive Decline in the Elderly (IQ CODE) (Jorm and Jacomb, 1989) and the dementia questionnaire (DQ) (Kawas et al., 1994). Complete neurological and neuropsychological evaluations were conducted in “high risk” participants. These were subjects who had at least one of the following characteristics: 1) 3MSE score <80, 2) a change in 3MSE >5 points from baseline to last contact, 3) IQ-CODE score ≥3.2, 4) living in a nursing home, 5) incident strokes, 6) dementia diagnosis in medical records, 7) Telephone Interview for Cognitive Status (TICS) score <28 (Gallo and Breitner, 1995), or 8) were African-American. High risk subjects were examined in three sites (Hagerstown, Sacramento, and Winston-Salem); the Pittsburgh site examined all participants. The results were adjudicated with regard to the presence of any disorder that could affect cognition.
2.3 Diagnostic Classification
In 1998/99 an Adjudication Committee comprised of experts in dementia diagnosis classified participants as having normal cognition, Mild Cognitive Impairment (MCI) (Lopez et al., 2003a), or a dementia syndrome including specific subtypes. The Adjudication Committee had access to the historical CHS cognitive test scores, primarily the 3MSE (and subscales), BVRT, and the DSST, as well as: the CES-D scores, vision and hearing testing, history of alcohol intake, activities of daily living questionnaire, IQ-CODE, DQ, vital status, date of death, history of hospitalizations, treatments and drugs to treat dementia, the results of the current neuropsychological assessment, initial and follow-up MRI scans, the neurological examination, and the Neuropsychiatric Inventory (Cummings et al., 1994).
A total of 1574 of the 2101 CHS participants scanned in 1998/99 were considered to be cognitively normal. Due to the late inclusion of the SPGR sequence into the scanning protocol not all of the participants had high resolution anatomical imaging. Thus, the present study includes only the data from the 740 CHS-CS participants who were cognitively normal in 1998/99, who had an SPGR scan, and whose MRI data met quality control standards. Subject demographics are presented in Table 1. There were no statistically significant differences between the participants whose data are included in this analysis, and those who were not in terms of: age, education, sex, race, white matter grade (WMG), ventricular enlargement, presence of large infarcts or APOE*4 status. Those who were included (38%) were less likely to have hypertension than those who were not (46%)(χ2 = 12.2, df=1, n=1577, p=.002, Phi=.09).
Table 1.
Characteristics of Study Participants in 1998/99 by CHS Site.
| Winston-Salem | Sacramento | Hagerstown | Pittsburgh | Total Sample | |
|---|---|---|---|---|---|
| Number scanned | 376 | 506 | 342 | 353 | 1577 |
| Number analyzed | 16 | 266 | 160 | 298 | 740 |
| Age1 | 80.0 (4.1) | 78.6 (4.0) | 78.2 (4.0) | 77.9 (3.6) | 78.3 (3.9) |
| Education (% (N) High School) | 75 (12) | 47 (127) | 70 (113) | 43 (128) | 49 (362) |
| Sex (% (N) Male) | 56 (9) | 41 (109) | 44 (71) | 40 (119) | 42 (308) |
| Race (% (N) White) | 100 (16) | 96 (254) | 99 (161) | 83 (248) | 91 (679) |
| 3MSE1 | 90.7 (7.1) | 95.1 (3.9) | 94.8 (4.2) | 94.9 (4.3) | 94.9 (4.25) |
| Number of Infarcts1 | .38 (.72) | .55 (1.0) | .41 (.82) | .41 (.83) | .46 (.91) |
| Sulcal Grade (0 to 9, worst) | 4.31 (1.2) | 3.78 (1.4) | 3.88 (1.7) | 3.92 (1.6) | 3.87 (1.5) |
| Ventricular Grade (0 to 9, worst) | 3.81 (.83) | 3.67 (1.3) | 3.44 (1.3) | 3.49 (1.3) | 3.55 (1.3) |
| White Matter Grade (0 to 9, worst) | 3.06 (2.0) | 2.75 (1.6) | 2.18 (1.5) | 2.30 (1.4) | 2.45 (1.5) |
| Infarcts (% (N) Present) | 25 (4) | 31 (83) | 27 (43) | 26 (77) | 28 (207) |
| Ventricular Grade (% (N) >5) | 6 (1) | 7 (18) | 6 (10) | 7 (21) | 7 (50) |
| White Matter Grade (% (N) >3) | 38 (6) | 35 (91) | 31 (50) | 16 (48) | 21 (161) |
Mean ± standard deviation
2.4 Structural MR Imaging
MRI scanning was completed at each of the four sites using 1.5 Tesla scanners, as detailed elsewhere (Bryan et al., 1994; Manolio et al., 1994). Briefly, the scanning protocol used in 1991/94 and 1998/99 included a sagittal T1 weighted localizer sequence, and axial T1, spin-density, and T2 weighted images. The CHS did not acquire FLAIR images in 1998/99. The axial images were 5 mm thick without interslice gaps (Bryan et al., 1994). Neuroradiologists at the central reading center, who had no knowledge of the clinical characteristics of the CHS participants, identified infarcts on T2-weighted images (defined as any area of abnormal signal change of 3 mm or greater in diameter (Bryan et al., 1997). They also estimated white matter, ventricular, and sulcal integrity using a 10-point standardized CHS visual grading system, ranging from 0 (normal) to 9 (mostly abnormal). White matter grades (WMGs) were based on the total extent of subcortical and periventricular hyperintensities on either axial T2 weighted or spin-density images. Excellent intraclass correlations were found both within (.89) and between (.76) raters (Manolio et al., 1994). The scale has been validated against white matter hyperintensity volume normalized for total cerebral parenchyma (See Appendix in Kuller et al., 2004).
2.5 Voxel Based Morphometry
3-D volumetric T1 weighted Spoiled Gradient Recall (SPGR) sequence was obtained in 1998/99, covering the whole brain (TE/TR = 5/25, flip angle = 40°, NEX = 1, slice thickness = 1.5 mm/0 mm interslice gap), with an in-plane acquisition matrix of 256 × 256 × 124 image elements, 250 × 250 mm field of view and an in-plane voxel size of 0.98 mm3. These volumetric data were used in this analysis.
The key concepts and steps of the voxel based morphometry (VBM) processing pipeline are described in prior work (Ashburner and Friston, 2000; Raji et al., 2009). We used the Smallest Univalue Assimilating Nucleus from the FMRI Software Library (FSL) for 3-D non-linear noise reduction to improve the quality of the scans (Smith et al., 2004; Woolrich et al., 2009). The Brain Extraction Tool from FSL automatically stripped the skull and scalp from the images, to help improve the quality of subsequent segmentation (Smith, 2002). We invoked VBM2 (http://dbm.neuro.uni-jena.de/vbm/) in the Statistical Parametric Mapping (SPM2) software package, running in MATLAB version 7.4 (The MathWorks, Natick, MA, USA). We normalized all images using a 12-parameter affine transformation and non-linear registration with 16 non-linear iterations to the custom Pittsburgh Elderly Template (419 brains: mean age 69; 205 men, 214 women (Spears et al., 2005). Images were then visually inspected to ensure that no major registration errors had occurred.
Following spatial normalization each of the images was segmented into GM, WM, and CSF using the SPM-standard mixed model cluster analysis which assigns each voxel a value reflective of a tissue type based on prior probabilities from the custom normal elderly template. A hidden Markov random field threshold of 0.3 was used in the segmentation step to remove isolated voxels of one tissue type that are unlikely to reside in that particular area. The volumes of GM, white matter (WM), and cerebrospinal fluid (CSF) obtained by the tissue segmentation routine in VBM were summed to compute the total intracranial volume (TIV), including subarachnoid space.
These voxel-level data were transformed (i.e., modulated) to units reflecting volume by multiplying all the post-normalization/segmentation values by the inverse of the Jacobian determinant of their spatial transformation matrix. This step corrected for any changes in the size of the individual voxels during the normalization. The normalized, segmented, and modulated images were smoothed using a 3-D Gaussian kernel (10 mm at full width at half maximum) to reduce the effects of any possible registration errors and to render the data amenable to parametric statistical analysis. All scans were masked to exclude non-gray matter voxels from the statistical search space.
2.6 Voxel-Based Statistical Modeling
A voxel-level, whole brain multiple regression model was constructed in SPM2 to examine the relationship between WMG and GM volume. Specifically, we examined the relationship between a WMG higher than 3 and GM volume (3 and higher as representing one group with a high white matter burden and grading of 2 or lower as low burden). This was done to allow us to incorporate the WMG variable into a parametric statistical model. The covariates in this model were: TIV, age, sex, education, race, MRI infarcts, and indicator variables designating the “site” of the scan to account for center-to-center variation. A Family-Wise Error (FWE) threshold (p < .05) was applied to account for multiple comparisons, using an extent threshold of 100 voxels.
When we modeled the interaction between age and WMG in SPM2, we “centered” age around the overall mean of the sample by subtracting the mean age from each individual participant’s age. We then multiplied the centered age for each participant by WMG. This interaction term was coded as a contrast vector weight of -1 in SPM to determine whether the Main Effect of WMG on GM volume was moderated by age (Baron and Kenny, 1986). The covariates in this model were age, WMG, gender, education, race, MRI infarcts, CHS study site, and TIV.
The results of the analyses were projected onto the standard single subject Montreal Neurological Institute (MNI) template (Holmes et al., 1998) for display purposes. When projecting onto cardinal sections, we expressed our results as partial correlations (i.e., rp images) to obtain a better visual representation of the effect size (Cohen, 1988).
2.7 Regression Analyses
In order to examine the relationships between the outcome variables (GM volumes) and predictor variables (e.g., WMG, age, etc.) we completed a series of regression analyses using volume data extracted from the SPM2 analyses. We first regressed each outcome variable on age, WMG, education, hypertension, APOE*4 genotype, and stroke. Only the variables that were significantly linked to the outcome were retained at that first level. Each of these predictors was then themselves regressed on the remaining independent variables. This process continued until all of the variables were included in the model; we also tested for mediation and moderation effects (Baron and Kenny, 1986).
3. Results
Higher WMG was associated with lower GM volumes throughout the brain (Figure 1, top), most prominently in the frontal cortex but also in the temporal lobes, independent of, or controlled for, for previously mentioned covariates including age. By contrast, the volumes of the superior parietal and occipital cortices were not significantly lower as a function of higher WMG. Figure 2 shows the Main Effect of WMG on GM volume projected onto the Standard Single Subject MNI template. Lower GM volumes were found in the temporal neocortex, parahippocampal gyrus, inferior parietal cortex, and the frontal cortex. Table 2 shows the coordinates and locations of the areas of peak atrophy, after masking out the regions linked to aging and infarcts.
Figure 1.

Main Effect of white matter grade (WMG) (top row) and age (bottom row) on regional GM volumes. This volume-rendered figure shows the partial correlations rp-values from the multiple regression model evaluating the relationship between WMG and GM volume rendered onto the SPM2 single subject cortical surface independent of, or controlled for, for previously mentioned covariates including age. Red indicates the highest partial correlations, green the smallest.
Figure 2.

Main Effect of WMG and age projected onto the Standard Single Subject MNI template. WMLs (top row) and age (middle row) effects are projected as partial correlations (rp-values) independent of, or controlled for, pertinent covariates such as WMG. The bottom row shows the regional effects of WMG (red), age (green), and their overlap (yellow) (maps created using MRIcron (http://www.cabiatl.com/mricro/mricron/index.html))
Table 2.
Locations of Peak Gray Matter Atrophy Associated with White Matter Grade and Age1
| Structure | Peak MNI Coordinates (X, Y, Z) | Voxel T-Scores |
|---|---|---|
| White Matter Grade | ||
| Left Medial Frontal Gyrus2 | −10, 66, −8 | 11.59 |
| Right Superior Frontal Gyrus | 12, 66, 9 | 9.58 |
| Right Postcentral Gyrus | 61, −9, 22 | 9.08 |
| Left Middle Temporal Gyrus | −61, −44, −8 | 8.91 |
| Left Inferior Frontal Gyrus | −53, 32, 8 | 8.03 |
| Right Superior Temporal Gyrus | 66, −22, 2 | 6.99 |
| Right Lingual Gyrus | 18, −88, −4 | 6.34 |
| Left Cuneus | −14, −99, 7 | 6.32 |
| Right Parahippocampal Gyrus | 24, −27, −19 | 5.35 |
| Left Uncus of the Hippocampus | −30, −3, −48 | 4.95 |
| Right Fusiform Gyrus | 38, −40, −18 | 4.93 |
| Age | ||
| Right Insula | 45, −7, −6 | 7.07 |
| Left Precuneus | −12, −65, 25 | 6.43 |
| Left Insula | −43, 5, −11 | 6.11 |
| Left Cingulate Gyrus | −13, −30, 40 | 6.05 |
| Left Pons | −14, −40, −30 | 5.64 |
| Left Inferior Frontal Gyrus | 14, −40, −32 | 5.63 |
| Right Precuneus | −53, 13, 25 | 5.54 |
| Right Middle Frontal Gyrus | 10, −72, 32 | 5.49 |
| Left Middle Frontal Gyrus | 53, 16, 27 | 5.32 |
| Right Parietal Lobe | −21, −8, 64 | 5.25 |
| Left Cerebellar Tonsil | 27, −36, 63 | 5.17 |
| Left Inferior Parietal Lobule | −49, −52, −35 | 5.01 |
| Right Inferior Parietal Lobule | −32, −54, 50 | 4.92 |
| 35, −48, 50 | 4.89 | |
Peaks identified after masking out effects of aging and infarcts (i.e., exclusive mask, uncorrected p<.05).
Loci identified using the icbm2tal conversion in GingerALE (http://brainmap.org/ale/) and the regions named with the Talairach Client (http://www.talairach.org/client.html).
The effects of age on GM volume are also shown in Figures 1 and 2 and are independent of, or controlled for, pertinent covariates such as WMG. Lower cortical GM volumes linked to age are found in the superior temporal cortex, most prominently on the left, and the inferior and mesial temporal lobes. Most importantly, the volume of GM was significantly lower in the hippocampus proper (bilaterally), as shown in Figure 2 (see also Table 2).
The bottom row of Figure 2 shows the areas of overlap between the effects of age and WMG on GM volume, made by overlapping the main effects maps to identify common brain areas encompassed in both main effects. Substantial overlap in these effects (yellow areas) can be seen in the temporal cortex (bottom row, left-hand image) and the posterior hippocampus (center image). We tested for the interactions between WML and Age, and WML and infarcts in the VBM models; neither of these interactions were statistically significant (FWE, p<.05).
In an effort to understand the relationships among the different predictor variables, GM volumes and cognition, we completed a series of regression analyses using regional volumes to identify the critical predictor variables. First, we extracted the regional volumes from the VBM analysis using the VOI (volume of interest) tool within SPM2 for the regions defined in the hippocampi, the frontal cortex (bilaterally), and the posterior cingulate gyrus (see Table 2). A factor analysis indicated that the variance in these five brain regions could be accounted for by two main factors – one including the hippocampi, and the other including the frontal and cingulate cortices (data not shown). We computed summary scores (“hippocampus”, “frontal”) by averaging the volumes and expressing these as a proportion of the TIV.
We first regressed performance on the 3MSE and DSST on the hippocampal and frontal variables, and age, education and sex. Performance on the 3MSE was unrelated to any of these variables, and therefore we focused our attention on the variables that affected DSST performance. Both hippocampal and frontal GM variables were significantly related to DSST performance – higher GM volumes were associated with better performance (See Figure 3).
Figure 3.
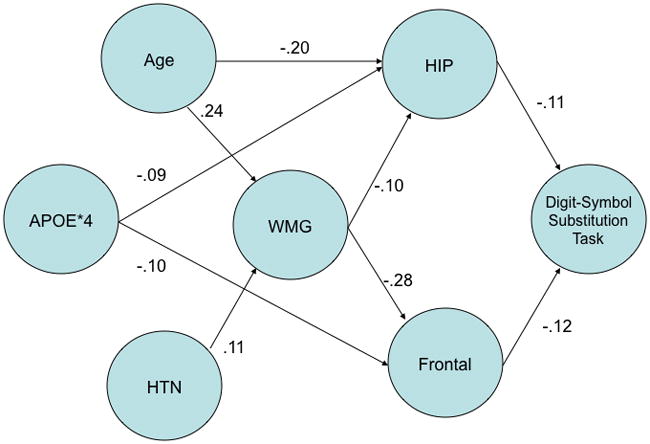
Regression-based model of relationships among gray matter volume, white matter grade (WMG), age, hypertension (HTN), APOE*4, and DSST. Gray matter volume was extracted using the VOI tool in SPM2 and represents the hippocampus and frontal cortex volumes, adjusted for total intracranial volume (see text for details). Path weights are the standardized regression coefficients derived from multiple linear regression equations; no interactions among the predictor variables were statistically significant (p < .05). The direction of the arrows is based on the relationship between pairs of variables.
We then regressed the volumes of the hippocampal and frontal variables on WMG, age, education, hypertension, APOE and stroke. The GM volumes of the hippocampus (β= −.10) and the frontal regions (β= −.28) were significantly related to WMG. In addition, age (β= .24) and hypertension (β= .11) predicted WMG, such that older age and the presence of HTN resulted in higher WMG. Age had an independent effect on hippocampal volume (β= −.20), and the presence of one or more copies of the APOE*4 allele was linked to smaller volumes in the hippocampus (β= −.09) and frontal (β= −.10) regions. The influence of age on frontal lobe GM was mediated by the presence of WMLs, as assessed with WMG.
4. Discussion
This study has three main findings regarding WMLs, GM volume and cognition in the brains of cognitively normal elderly people. First, higher WMG reflecting greater SVD is related to lower GM volume, as shown in whole brain voxel-level analysis, and to lower neuropsychological test scores as reflected in the regression analyses. Second, WMG and age had partly independent and partly overlapping effects on GM. That is, WMG and age influence different regions, based on covariate adjustment, but also show overlapping influence in the frontal and temporal lobes including the posterior hippocampus. Third, age and hypertension independently predict higher WMG. Collectively, these findings suggest that WMLs are features of brain aging and hypertensive vascular disease that independently predict brain structure of regions relevant to cognitive function such as the hippocampus and frontal lobes.
The relationships among vascular risk factors, WMLs and cognition in cognitively normal elderly individuals are well documented in multiple cross-sectional studies (Bartzokis et al., 2003; Kuller et al., 2004; Longstreth et al., 2007; Longstreth et al., 1996; Manolio, Olson, and Longstreth, 2003; Pantoni et al., 1999; Rosano et al., 2005; Vernooij et al., 2009). Additional cross-sectional work has shown WMLs strengthen the relationship between GM atrophy and executive dysfunction (Muller et al., 2009) and these relationships are linked to specific frontal lobe regions, for example the superior frontal gyrus (Mok et al., 2008). Our study advances current knowledge by showing that these relationships may be mediated by regionally specific damage to the gray matter. The greater severity of SVD, as reflected by more extensive WMLs and higher WMG, confers a greater loss of GM volume. Further, we report that advancing age exerts independent deleterious effects on both the extent of WMLs and the volume of the hippocampus. These data contribute to our understanding of the relationships among small vessel disease, WMLs, GM atrophy and cognition in healthy, elderly individuals.
Although MRI scans were available from 740 CHS participants, not all of these individuals underwent detailed cognitive testing. The sampling frame at three of the sites (Hagerstown, Wake Forest and Sacramento) focused on “high risk” individuals, and minority participants (Lopez et al., 2003a; Lopez et al., 2003b). In Pittsburgh, all of the living CHS participants who underwent an MRI scan were also asked to complete the testing. Consequently, among this group of cognitively normal individuals, only one-third had detailed testing. Therefore, we focused our attention on the two tests that were completed by all of the participants – the 3MSE and the DSST. Our finding that the 3MSE was uncorrelated with the predictor variables is consistent with our previous experience that it is relatively insensitive to true impairment (Kuller et al., 2003), and the range of scores is relatively narrow. By contrast, the DSST is a very sensitive measure of cognitive test performance, although it is non-specific in terms of the factors that can affect performance (Lezak, 1995). Thus, it is not surprising that this measure was particularly useful for assessing cognitive state. We found that both of the summary measures of GM volume contributed to task performance, and that these volumes were themselves predicted by WMG and related factors. Thus, our data demonstrate that the integrity of the cerebrovasculature (as indexed by WMG) is related to GM volume and thus to neuropsychological test performance. It is important to note that the effect of WMG on test performance was fully mediated by GM volume, and in this particular case does not reflect an effect of change in WM integrity per se.
Our findings are consistent with the idea that WMLs reflect global compromise of brain tissue as a consequence of the multiple disease processes of aging that can cause microvascular damage (e.g., hypertension, diabetes, smoking, etc.). Consistent with prior cross-sectional work, we found that WMLs correlate with reduced volume in the hippocampus and frontal lobe regions (Appelman et al., 2009; Godin et al., 2009; Wen et al., 2006). Other studies have linked WMLs with cognitive decline (Appelman et al., 2009; Mueller et al., 2010). While a previous study shows that persons with both WML and GM atrophy have worse longitudinal cognitive decline (Godin et al., 2010), our study advances this work by establishing relationships between WMLs, GM, and cognition.
The brain is a high flow, low impedance organ, and any increases in arterial stiffness and pulsatility can result in microvessel structural and functional abnormalities (Mitchell, 2008). Several lines of cross-sectional evidence support the idea that WMLs reflect long-term CNS vascular disease damage to the brain, including: the vulnerability of WM to transient changes in regional cerebral blood flow (Pantoni, 1999); the co-localization of white matter pallor and arteriosclerosis (Janota et al., 1989); the co-occurrence of WMLs with stroke and the progression of lacunar infarcts (Kuller et al., 2004; Kuller et al., 2003; Longstreth et al., 1996); the sensitivity of oligodendrocytes and myelin to ischemia (Young, Halliday, and Krill, 2008); and the evidence of hemodynamic compromise and an increased risk for ischemia and infarction in WMLs (Marchal et al., 1992).
The structural integrity of WM may be compromised even when it appears normal on MRI (Vernooij et al., 2009). These microstructural changes are related to alterations in memory, information processing speed, and executive functions – although the role of GM atrophy is unknown. The progression of WMLs also reflects SVD risk factors such as smoking, HTN, and the extent of WMLs at the beginning of the observation period (van Dijk, 2008). Loss of myelin is not only related to the presence of the APOE*4 allele, but may even promote β-amyloid deposition (Bartzokis et al., 2003; Bartzokis et al., 2006; Bartzokis et al., 2007). Regardless of the underlying neurodegenerative pathway, factors associated with the development of WMLs are critical for both the structural and functional integrity of the CNS.
Tracking WMLs over time has implications for a better understanding and assessment of age-related brain atrophy. The attenuation of age related brain atrophy in the frontal lobes, for example, highlights how co-morbid WMLs can moderate aging in brain areas that are exquisitely vulnerable to both processes (Raz and Rodrigue, 2003). Since SVD is also linked to both MCI and AD (Smith et al., 2000), it may account for a portion of variance in age as a risk factor for dementia. As suggested by the relationships diagrammed in Figure 3, age may be a powerful risk factor for AD because of a higher risk for processes such as SVD that contribute to GM atrophy. In this sense, WMLs may be thought of as imaging indicators of underlying GM atrophy. The loss of GM tissue may consequently lower cognitive reserve and increase the brain’s vulnerability to a concurrent or future neurodegenerative process as shown in prior cross-sectional work (Satz, 1999; Stern, 1992). Figure 3 presents two possible independent pathways to cognitive impairment – one via the hippocampus and mediated by age, and the other via frontal lobe circuits and mediated by age and WMG. Understanding these processes will require further longitudinal investigation and could lend insight on preventing dementia.
A key advantage of VBM is that it allows for whole brain analysis of gray matter volume, an approach not possible with region of interest investigations. The main disadvantage is that registration errors can impede the accuracy of subsequent analyses. To prevent such problems in our analyses we (i) used a custom template based on normal elderly brains for the normalization process, (ii) applied a GM mask derived from that template to restrict the statistical search space to gray matter voxels, and (iii) used a large smoothing kernel to reduce the likelihood that any volumetric differences found were due to mis-registration. We also inspected scans visually after the normalization step and did not identify any signs of registration errors. Thus, while such errors can impede the accuracy of a VBM analysis, we took multiple precautions to minimize them.
One distinct advantage of this study is that the CHS-CS drew its participants from the community, minimizing the referral bias that can be seen in study samples drawn from specialty clinics. Thus, unlike other studies that may focus attention on cognitive processes and disorders of aging, the original CHS sample was selected without regard for cognitive health – and this was not a factor in the recruitment process. However, the CHS-CS, like other longitudinal studies of normal aging, has the disadvantage of a survival bias, as the mean age of the participants is nearly 80 years (Euser et al., 2008; Rabbitt et al., 2008; Rabbitt et al., 2009).
This work is cross-sectional, thus limiting conclusions regarding causal relationships among WMLs, brain atrophy and cognition. As such, we place our findings in the context of the other cross-sectional studies that constitute the majority of the work in this field (Appelman et al., 2009). Further, the associations we detected are based on a series of regression models used for hypothesis generation, and these can be tested in future longitudinal studies. The analysis of serial MRI scans and serial measurements of WMG and GM volume can establish a temporal relationship between WMLs and GM atrophy as has been done for SVD and cognition (van Dijk, 2008).
We used a standardized and validated visual WM grading scheme to rate the extent of WMLs. More recent work has used the volume of abnormal WM (measured in cubic milliliters, and expressed as a proportion of total WM) as an index of WM damage (Carmichael et al., 2010; Wu et al., 2006). However, the CHS did not acquire FLAIR images in 1998/99, and reliable and valid manual tracing of WMLs in all scans is impractical. We are currently testing the validity of automated methods that use dual echo spin-echo/T2 images to measure WMLs (Schwarz et al., 2009) for possible implementation in this dataset.
Although we have emphasized the importance of vascular risk factors in the development of WMLs, other factors can affect the integrity of WM, such as traumatic brain injury, alcohol abuse, and other disease (Greenstein et al., 2010; Kinnunen et al., 2011; Kraus et al., 2007). Such mechanisms of WM injury cannot be completely excluded. Nonetheless, in this sample, none of the participants reported significant head injuries or met criteria for alcohol abuse – likely as a consequence of the survival bias.
These analyses demonstrate that SVD, as indexed by WMG, is linked to lower GM volume and cognition. In addition to reflecting long-term vascular damage to the brain, WMLs may reflect underlying GM atrophy. As such, they may have clinical significance as neuroradiologists can more easily appreciate WMLs on T2 weighted images than they can assess GM volume. Preventing or reducing the severity of WMLs by targeting the underlying vascular diseases and risk factors, including lifestyle factors such as diet and exercise, may improve brain structure and function with aging and reduce the risk of subsequent dementia.
Acknowledgments
The research reported in this article was supported in part by funds from contract numbers N01-HC-80007, N01-HC-85079 through N01-HC-85086, N01-HC-35129, N01 HC-15103, N01 HC-55222, N01-HC-75150, N01-HC-45133, grant number U01 HL080295 from the National Heart, Lung, and Blood Institute, with additional contribution from the National Institute of Neurological Disorders and Stroke. Additional funds were provided by the National Institute on Aging to O.L.L. (AG020098), L.H.K. (AG15928), P.T. (EB008281) and the University of Pittsburgh (AG05133), and by subcontract (N01-HC-055222) to J.T.B. A full list of principal CHS investigators and institutions can be found at http://www.chs-nhlbi.org/pi.htm.
Footnotes
Disclosure Statement - no actual or potential conflicts of interest.
Publisher's Disclaimer: This is a PDF file of an unedited manuscript that has been accepted for publication. As a service to our customers we are providing this early version of the manuscript. The manuscript will undergo copyediting, typesetting, and review of the resulting proof before it is published in its final citable form. Please note that during the production process errors may be discovered which could affect the content, and all legal disclaimers that apply to the journal pertain.
References
- Andresen EM, Malmgren JA, Carter WB, Patrick DL. Screening for depression in well older adults: evaluation of a short form of the CES-D (Center for Epidemiologic Studies Depression Scale) Am J Prev Med. 1994;10:77–84. [PubMed] [Google Scholar]
- Appelman AP, Exalto LG, van der Graaf Y, Biessels GJ, Mali WP, Geerlings MI. White matter lesions and brain atrophy: more than shared risk factors? a systematic review. Cerebrovasc Dis. 2009;28(3):227–242. doi: 10.1159/000226774. [DOI] [PubMed] [Google Scholar]
- Ashburner J, Friston KJ. Voxel-based morphometry - the methods. Neurol. 2000;11:805–821. doi: 10.1006/nimg.2000.0582. [DOI] [PubMed] [Google Scholar]
- Baron RM, Kenny DA. The moderator-mediator variable distinction in social psychological research: conceptual, strategic, and statistical considerations. J Pers Soc Psychol. 1986;51:1173–1182. doi: 10.1037//0022-3514.51.6.1173. [DOI] [PubMed] [Google Scholar]
- Bartzokis G, Cummings JL, Syltzer D, Henderson VM, Nuechterlein KH, Mintz J. White matter structural integrity in healthy aging adults and patients with Alzheimer disease. Arch Neurol. 2003;60:393–398. doi: 10.1001/archneur.60.3.393. [DOI] [PubMed] [Google Scholar]
- Bartzokis G, Lu PH, Geschwind DH, Edwards N, Mintz J, Cummings JL. Apolipoprotein E genotype and age-related myelin breakdown in healthy individuals: implications for cognitive decline and dementia. Arch Gen Psychiatry. 2006;63(1):63–72. doi: 10.1001/archpsyc.63.1.63. [DOI] [PubMed] [Google Scholar]
- Bartzokis G, Lu PH, Mintz J. Human brain myelination and amyloid beta deposition in Alzheimer’s disease. Alzheimers Dement. 2007;3(2):122–125. doi: 10.1016/j.jalz.2007.01.019. [DOI] [PMC free article] [PubMed] [Google Scholar]
- Benton AL, Hamsher K, Varney NR, Spreen O. A clinical manual. Oxford University Press; New York: 1983. Contributions to neuropsychological assessment. [Google Scholar]
- Bryan RN, Manolio TA, Scertz LD, Jungreis C, Poirier VC, Elster AD, Kronmal RA. A method for using MR to evaluate the effects of cardiovascular disease on the brain: The cardiovascular health study. Am J Neuroradiol. 1994;15(9):1625–1633. [PMC free article] [PubMed] [Google Scholar]
- Bryan RN, Wells SW, Miller TJ, Elster AD, Jungreis CA, Poirier VC, Lind BK, Manolio TA. Infarctlike lesions in the brain: prevalence and anatomic characteristics at MR imaging of the elderly - data from the Cardiovascular Health Study. Radiology. 1997;202:47–54. doi: 10.1148/radiology.202.1.8988191. [DOI] [PubMed] [Google Scholar]
- Carmichael O, Schwarz C, Drucker D, Fletcher E, Harvey D, Beckett L, Jack CR, Jr, Weiner M, DeCarli C. Longitudinal changes in white matter disease and cognition in the first year of the Alzheimer disease neuroimaging initiative. Arch Neurol. 2010;67(11):1370–1378. doi: 10.1001/archneurol.2010.284. [DOI] [PMC free article] [PubMed] [Google Scholar]
- Cohen J. Statistical Power Analysis for the Behavioral Sciences. 2. Lawrene Erlbaum Associates; Hillsdale, N.J.: 1988. [Google Scholar]
- Cummings JL, Mega M, Gray K, Rosenberg-Thompson S, Carusi DA, Gornbein J. The neuropsychiatric inventory: comprehensive assessment of psychopathology in dementia. Neurol. 1994;44:2308–2314. doi: 10.1212/wnl.44.12.2308. [DOI] [PubMed] [Google Scholar]
- Enzinger C, Fazekas F, Matthews PM, Ropele S, Schmidt H, Smith S, Schmidt R. Risk factors for progression of brain atrophy in aging: six-year follow-up of normal subjects. Neurol. 2005;64(10):1704–1711. doi: 10.1212/01.WNL.0000161871.83614.BB. [DOI] [PubMed] [Google Scholar]
- Euser SM, Schram MT, Hofman A, Westendorp RG, Breteler MM. Measuring cognitive function with age: the influence of selection by health and survival. Epidemiology. 2008;19(3):440–447. doi: 10.1097/EDE.0b013e31816a1d31. [DOI] [PubMed] [Google Scholar]
- Fried LP, Borhani NO, Enright P, Furberg CD, Gardin JM, Kronmal RA, Kuller LH, Manolio TA, Mittelmark MB, Newman A, O’Leary DH, Psaty B, Rautaharju P, Tracy RP, Weiler PG. The Cardiovascular Health Study: Design and Rationale. Ann Epidemiol. 1991;1(3):263–276. doi: 10.1016/1047-2797(91)90005-w. [DOI] [PubMed] [Google Scholar]
- Gallo JJ, Breitner JCS. Alzheimer’s disease in the NAS-NRC Registry of ageing twin veterans, IV. Performance characteristics of a two-stage telephone screening procedure for Alzheimer’s dementia. Psychol Med. 1995;25:1211–1219. doi: 10.1017/s0033291700033183. [DOI] [PubMed] [Google Scholar]
- Godin O, Maillard P, Crivello F, Alperovitch A, Mazoyer B, Tzourio C, Dufouil C. Association of white-matter lesions with brain atrophy markers: the three-city Dijon MRI study. Cerebrovasc Dis. 2009;28(2):177–184. doi: 10.1159/000226117. [DOI] [PubMed] [Google Scholar]
- Godin O, Tzourio C, Rouaud O, Zhu Y, Maillard P, Pasquier F, Crivello F, Alperovitch A, Mazoyer B, Dufouil C. Joint effect of white matter lesions and hippocampal volumes on severity of cognitive decline: the 3C-Dijon MRI study. J Alzheimers Dis. 2010;20(2):453–463. doi: 10.3233/JAD-2010-1389. [DOI] [PubMed] [Google Scholar]
- Grafton ST, Sumi SM, Stimac GK, Alvord EC, Shaw C, Nochlin D. Comparison of postmortem magnetic resonance imaging and neuropsthologic findings in the cerebral white matter. Arch Neurol. 1991;48:293–298. doi: 10.1001/archneur.1991.00530150061019. [DOI] [PubMed] [Google Scholar]
- Greenstein AS, Paranthaman R, Burns A, Jackson A, Malik RA, Baldwin RC, Heagerty AM. Cerebrovascular damage in late-life depression is associated with structural and functional abnormalities of subcutaneous small arteries. Hypertension. 2010;56(4):734–740. doi: 10.1161/HYPERTENSIONAHA.110.152801. [DOI] [PubMed] [Google Scholar]
- Holmes CJ, Hoge R, Collins L, Woods R, Toga AW, Evans AC. Enhancement of MR images using registration for signal averaging. J Comput Assist Tomogr. 1998;22(2):324–333. doi: 10.1097/00004728-199803000-00032. [DOI] [PubMed] [Google Scholar]
- Janota I, Mirsen TR, Hachinski VC, Lee DH, Merskey H. Neuropathologic correlates of leuko-araiosis. Arch Neurol. 1989;46:1124–1128. doi: 10.1001/archneur.1989.00520460118023. [DOI] [PubMed] [Google Scholar]
- Jorm AF, Jacomb PA. The informant questionnaire on cognitive decline in the elderly (IQCODE): socio-demographic correlates, reliability, validity and some norms. Psychol Med. 1989;19:1015–1022. doi: 10.1017/s0033291700005742. [DOI] [PubMed] [Google Scholar]
- Kawas C, Segal J, Stewart WF, Corrada M, Thal LJ. A validation study of the dementia questionnaire. Arch Neurol. 1994;51:901–906. doi: 10.1001/archneur.1994.00540210073015. [DOI] [PubMed] [Google Scholar]
- Kinnunen KM, Greenwood R, Powell JH, Leech R, Hawkins PC, Bonnelle V, Patel MC, Counsell SJ, Sharp DJ. White matter damage and cognitive impairment after traumatic brain injury. Brain. 2011;134(Pt 2):449–463. doi: 10.1093/brain/awq347. [DOI] [PMC free article] [PubMed] [Google Scholar]
- Kobari M, Meyer JS, Ichijo M, Oravez WT. Leukoaraiosis: correlation of MR and CT findings with blood flow, atrophy, and cognition. Am J Neuroradiol. 1990;11:273–281. [PMC free article] [PubMed] [Google Scholar]
- Kraus MF, Susmaras T, Caughlin BP, Walker CJ, Sweeney JA, Little DM. White matter integrity and cognition in chronic traumatic brain injury: a diffusion tensor imaging study. Brain. 2007;130(Pt 10):2508–2519. doi: 10.1093/brain/awm216. [DOI] [PubMed] [Google Scholar]
- Kuller LH, Lopez OL, Newman A, Beauchamp NJ, Burke G, Dulberg C, Fitzpatrick A, Fried L, Haan MN. Risk factors for dementia in the cardiovascular health cognition study. Neuroepidemiology. 2003;22(1):13–22. doi: 10.1159/000067109. [DOI] [PubMed] [Google Scholar]
- Kuller LH, Longstreth WT, Arnold AM, Bernick C, Bryan N, Beauchamp NJ. White matter hyperintensity on cranial magnetic resonance imaging. Stroke. 2004;35:1821–1825. doi: 10.1161/01.STR.0000132193.35955.69. [DOI] [PubMed] [Google Scholar]
- Lezak M. Neuropsychological Assessment. 3. Oxford University Press; New York: 1995. [Google Scholar]
- Longstreth W, Jr, Larsen EK, Klein R, Wong TY, Sharrett AR, Lefkowitz D, Manolio TA. Associations between findings on cranial magnetic resonance imaging and retinal photography in the elderly: the Cardiovascular Health Study. Am J Epidemiol. 2007;165(1):78–84. doi: 10.1093/aje/kwj350. [DOI] [PubMed] [Google Scholar]
- Longstreth WT, Manolio TA, Arnold A, Burke GL, Bryan N, Jungreis CA, Enright PL, O’Leary D, Fried L. Clinical correlates of white matter findings on cranial magnetic resonance imaging of 3301 elderly people. Stroke. 1996;27:1274–82. doi: 10.1161/01.str.27.8.1274. [DOI] [PubMed] [Google Scholar]
- Lopez OL, Jagust WJ, DeKosky ST, Becker JT, Fitzpatrick A, Dulberg C, Breitner J, Lyketsos C, Jones B, Kawas C, Carlson MC, Kuller LH. Prevalence and classification of mild cognitive impairment in the Cardiovascular Health Study Cognitive Study Part 1. Arch Neurol. 2003;60:1385–1389. doi: 10.1001/archneur.60.10.1385. [DOI] [PubMed] [Google Scholar]
- Lopez OL, Kuller LH, Fitzpatrick A, Ives D, Becker JT, Beauchamp N. Evaluations of dementia in the cardiovascular health cognition study. Neuroepidemiology. 2003;22(1):1–12. doi: 10.1159/000067110. [DOI] [PubMed] [Google Scholar]
- Manolio TA, Kronmal RA, Burke GL, Poirier V, O’Leary DH, Garden JM, Fried LP, Steinberg EP, Bryan RN. Magnetic resonance abnormalities and cardiovascular disease in older adults. The Cardiovascular Health Study Stroke. 1994;25:318–327. doi: 10.1161/01.str.25.2.318. [DOI] [PubMed] [Google Scholar]
- Manolio TA, Olson J, Longstreth WT. Hypertension and cognitive function: pathophysiologic effects of hypertension on the brain. Curr Hypertens Rep. 2003;5(3):255–261. doi: 10.1007/s11906-003-0029-6. [DOI] [PubMed] [Google Scholar]
- Marchal G, Rioux P, Petit-Taboue MC, Sette G, Travere JM, Le Poec C, Courtheoux P, Derlon JM, Baron JC. Regional cerebral oxygen consumption, blood flow, and blood volume in healthy human aging. Arch Neurol. 1992;49(10):1013–1020. doi: 10.1001/archneur.1992.00530340029014. [DOI] [PubMed] [Google Scholar]
- Mitchell GF. Effects of central arterial aging on the structure and function of the peripheral vasculature: implications for end-organ damage. J Appl Physiol. 2008;105(5):1652–1660. doi: 10.1152/japplphysiol.90549.2008. [DOI] [PMC free article] [PubMed] [Google Scholar]
- Mok VC, Liu T, Lam WW, Wong A, Hu X, Guo L, Chen XY, Tang WK, Wong KS, Wong S. Neuroimaging predictors of cognitive impairment in confluent white matter lesion: volumetric analyses of 99 brain regions. Dement Geriatr Cogn Disord. 2008;25(1):67–73. doi: 10.1159/000111692. [DOI] [PubMed] [Google Scholar]
- Mueller SG, Mack WJ, Mungas D, Kramer JH, Cardenas-Nicolson V, Lavretsky H, Greene M, Schuff N, Chui HC, Weiner MW. Influences of lobar gray matter and white matter lesion load on cognition and mood. Psychiatry Res. 2010;181(2):90–6. doi: 10.1016/j.pscychresns.2009.08.002. [DOI] [PMC free article] [PubMed] [Google Scholar]
- Muller M, Appelman AP, van der Graaf Y, Vincken KL, Mali WP, Geerlings MI. Brain atrophy and cognition: interaction with cerebrovascular pathology? Neurobiol. Aging. 2011;32(5):885–893. doi: 10.1016/j.neurobiolaging.2009.05.005. [DOI] [PubMed] [Google Scholar]
- Pantoni L, Leys D, Fazekas F, Longstreth WT, Inzitari D, Wallin A, Filippi M, Scheltens P, Erkinjuntti T, Hachinski V. Role of white matter lesions in cognitive impairment of vascular origin. Alzheimer Dis Assoc Disord. 1999;13(Suppl 3):S49–S54. [PubMed] [Google Scholar]
- Rabbitt P, Scott M, Thacker N, Lowe C, Jackson A, Horan M, Pendleton N. Losses in gross brain volume and cerebral blood flow account for age-related differences in speed but not in fluid intelligence. Neuropsychology. 2006;20(5):549–557. doi: 10.1037/0894-4105.20.5.549. [DOI] [PubMed] [Google Scholar]
- Rabbitt P, Lunn M, Wong D. Death, dropout, and longitudinal measurements of cognitive change in old age. J Gerontol B Psychol Sci Soc Sci. 2008;63(5):271–278. doi: 10.1093/geronb/63.5.p271. [DOI] [PubMed] [Google Scholar]
- Rabbitt P, Lunn M, Ibrahim S, McInnes L. Further analyses of the effects of practice, dropout, sex, socio-economic advantage, and recruitment cohort differences during the University of Manchester longitudinal study of cognitive change in old age. Q J Exp Psychol (Colchester) 2009;62(9):1859–1872. doi: 10.1080/17470210802633461. [DOI] [PubMed] [Google Scholar]
- Raji CA, Lopez OL, Kuller LH, Carmichael OT, Becker JT. Age, Alzheimer disease, and brain structure. Neurol. 2009;73(22):1899–1905. doi: 10.1212/WNL.0b013e3181c3f293. [DOI] [PMC free article] [PubMed] [Google Scholar]
- Raz N, Rodrigue KM. Hypertension and the brain: vulernability of the prefrontal regions and executive functions. Behav Neurosci. 2003;117(6):1169–1180. doi: 10.1037/0735-7044.117.6.1169. [DOI] [PubMed] [Google Scholar]
- Raz N, Rodrigue KM. Differential aging of the brain patterns: cognitive correlates and modifiers. Neurosci Behav Rev. 2006;30(6):730–748. doi: 10.1016/j.neubiorev.2006.07.001. [DOI] [PMC free article] [PubMed] [Google Scholar]
- Rodrigue KM, Haacke EM, Raz N. Differential effects of age and history of hypertension on regional brain volumes and iron. Neuroimage. 201l;54(2):750–759. doi: 10.1016/j.neuroimage.2010.09.068. [DOI] [PMC free article] [PubMed] [Google Scholar]
- Rosano C, Naydeck B, Kuller LH, Longstreth WT, Jr, Newman AB. Coronary artery calcium: associations with brain magnetic resonance imaging abnormalities and cognitive status. J Am Geriatr Soc. 2005;53(4):609–615. doi: 10.1111/j.1532-5415.2005.53208.x. [DOI] [PubMed] [Google Scholar]
- Salat DH, Kaye JA, Janowsky JS. Selective preservation and degeneration within the prefrontal cortex in aging and Alzheimer disease. Arch Neurol. 2000;58:1403–1408. doi: 10.1001/archneur.58.9.1403. [DOI] [PubMed] [Google Scholar]
- Salat DH, Buckner RL, Snyder AZ, Greve DN, Desikan RS, Busa E, Morris JC, Dale AM, Fischl B. Thinning of the cerebral cortex in aging. Cereb Cortex. 2004;14(7):721–730. doi: 10.1093/cercor/bhh032. [DOI] [PubMed] [Google Scholar]
- Satz P. Brain reserve capacity on symptom onset after brain injury: a formulation and review of evidence of threshold theory. Neuropsychology. 1991;7(3):273–295. [Google Scholar]
- Scheltens P, Barkhof F, Leys D, Wolters E, Ravid R, Kamphorst W. Histopathologic correlates of white matter changes on MRI in Alzheimer’s disease. Neurol. 1995;45:883–888. doi: 10.1212/wnl.45.5.883. [DOI] [PubMed] [Google Scholar]
- Schwarz C, Fletcher E, DeCarli C, Carmichael O. Fully-automated white matter hyperintensity detection with anatomical prior knowledge and without FLAIR. Inf Process Med Imaging. 2009;21:239–251. doi: 10.1007/978-3-642-02498-6_20. [DOI] [PMC free article] [PubMed] [Google Scholar]
- Smith CD, Snowdon DA, Wang H, Markesbery WR. White matter volumes and periventricular white matter hyperintensities in aging and dementia. Neurol. 2000;54:838–842. doi: 10.1212/wnl.54.4.838. [DOI] [PubMed] [Google Scholar]
- Smith SM. Fast robust automated brain extraction. Hum Brain Mapp. 2002;17(3):143–155. doi: 10.1002/hbm.10062. [DOI] [PMC free article] [PubMed] [Google Scholar]
- Smith SM, Jenkinson M, Woolrich MW, Beckmann CF, Behrens TE, Johansen-Berg H, Bannister PR, De Luca M, Drobnjak I, Flitney DE, Niazy RK, Saunders J, Vickers J, Zhang Y, De Stefano N, Brady JM, Matthews PM. Advances in functional and structural MR image analysis and implementation as FSL. Neuroimage. 2004;23(Suppl 1):S208–219. doi: 10.1016/j.neuroimage.2004.07.051. [DOI] [PubMed] [Google Scholar]
- Spears JR, Greer PJ, Ziolko SK, Aizenstein HJ, Carmichael O, Becker JT, Meltzer CC. Evaluation of an age-specific neurological template. Presented at the Annual Meeting of the Organization of Human Brain Mapping; Toronto, Ontario, Canada. 2005. [Google Scholar]
- Stern Y, Alexander GE, Prohovnik I, Mayeux R. Inverse relationship between education and parietotemporal perfusion deficit in Alzheimer’s disease. Ann Neurol. 1992;32(3):371–375. doi: 10.1002/ana.410320311. [DOI] [PubMed] [Google Scholar]
- Teng EL, Chui HC. The Modified Mini-Mental State (3MS) Examination. J Clin Psychiatry. 1987;48:314–318. [PubMed] [Google Scholar]
- van Dijk EJ, Prins ND, Vrooman HA, Hofman A, Koudstaal PJ, Breteler MM. Progression of cerebral small vessel disease in relation to risk factors and cognitive consequences: Rotterdam scan study. Stroke. 2008;39(10):2712–2719. doi: 10.1161/STROKEAHA.107.513176. [DOI] [PubMed] [Google Scholar]
- van Norden AG, Fick WF, de Laat KF, van Uden IW, van Oudheusden LJ, Tendolkar I, Zwiers MP, de Leeuw FE. Subjective cognitive failures and hippocampal volume in elderly with white matter lesions. Neurol. 2008;71(15):1152–1159. doi: 10.1212/01.wnl.0000327564.44819.49. [DOI] [PubMed] [Google Scholar]
- Vernooij MW, Ikram MA, Vrooman HA, Wielopolski PA, Krestin GP, Hofman A, Niessen WJ, Van der Lugt A, Breteler MM. White matter microstructural integrity and cognitive function in a general elderly population. Arch Gen Psychiatry. 2009;66(5):545–553. doi: 10.1001/archgenpsychiatry.2009.5. [DOI] [PubMed] [Google Scholar]
- Wechsler D. Wechsler Adult Intelligence Scale-Revised. The Psychological Corporation; New York: 1981. [Google Scholar]
- Wen W, Sachdev PS, Chen X, Anstey K. Gray matter reduction is correlated with white matter hyperintensity volume: a voxel-based morphometric study in a large epidemiological sample. Neuroimage. 2006;29(4):1031–1039. doi: 10.1016/j.neuroimage.2005.08.057. [DOI] [PubMed] [Google Scholar]
- Woolrich MW, Jbabdi S, Patenaude B, Chappell M, Makni S, Behrens T, Beckmann C, Jenkinson M, Smith SM. Bayesian analysis of neuroimaging data in FSL. Neuroimage. 2009;45(1 Suppl):S173–186. doi: 10.1016/j.neuroimage.2008.10.055. [DOI] [PubMed] [Google Scholar]
- Wu M, Rosano C, Butters M, Whyte E, Nable M, Crooks R, Meltzer CC, Reynolds CF, Aizenstein HJ. A fully automated method for quantifying and localizing white matter hyperintensities on MR images. Psychiatry Res. 2006;148(2–3):133–142. doi: 10.1016/j.pscychresns.2006.09.003. [DOI] [PMC free article] [PubMed] [Google Scholar]
- Young VG, Halliday GM, Krilm JJ. Neuropathologic correlates of white matter hyperintensities. Neurol. 2008;71(11):804–811. doi: 10.1212/01.wnl.0000319691.50117.54. [DOI] [PubMed] [Google Scholar]