

Non-technical summary
The hippocampus plays a key role in memory formation. Cortical information is conveyed to the hippocampus via specialized axons of the dentate granule cells. These axon terminals contain a high concentration of zinc. Recently vesicular zinc was suggested to be a key modulator of postsynaptic calcium signals. We explored this possibility using fluorescence calcium imaging and electrophysiological recordings. We eliminated endogenous zinc with pharmacological and genetic tools, and found that none of these manipulations altered postsynaptic calcium signals. Our data suggest that the main function of vesicular zinc is not the control of postsynaptic calcium signalling during synaptic interactions.
Abstract
Abstract
The co-release of neuromodulatory substances in combination with classic neurotransmitters such as glutamate and GABA from individual presynaptic nerve terminals has the capacity to dramatically influence synaptic efficacy and plasticity. At hippocampal mossy fibre synapses vesicular zinc is suggested to serve as a cotransmitter capable of regulating calcium release from internal stores in postsynaptic CA3 pyramidal cells. Here we investigated this possibility using combined intracellular ratiometric calcium imaging and patch-clamp recording techniques. In acute hippocampal slices a brief train of mossy fibre stimulation produced a large, delayed postsynaptic Ca2+ wave that was spatially restricted to the proximal apical dendrites of CA3 pyramidal cells within stratum lucidum. This calcium increase was sensitive to intracellularly applied heparin indicating reliance upon release from internal stores and was triggered by activation of both group I metabotropic glutamate and NMDA receptors. Importantly, treatment of slices with the membrane-impermeant zinc chelator CaEDTA did not influence the synaptically evoked postsynaptic Ca2+ waves. Moreover, mossy fibre stimulus evoked postsynaptic Ca2+ signals were not significantly different between wild-type and zinc transporter 3 (ZnT3) knock-out animals. Considered together our data do not support a role for vesicular zinc in regulating mossy fibre evoked Ca2+ release from CA3 pyramidal cell internal stores.
Introduction
Synaptically activated increases in postsynaptic [Ca2+]i can occur due to influx through voltage-gated Ca2+ channels, ligand-gated Ca2+ channels, and Ca2+ release from internal stores. Excitatory inputs can initiate action potentials in the axon hillock that backpropagates to the dendrites (Stuart & Sakmann, 1994; Spruston et al. 1995) generating fast Ca2+ transients in the entire dendritic tree (Jaffe et al. 1992; Schiller et al. 1995; Larkum et al. 2003). Subthreshold signals activate Ca2+ influx through glutamate receptors, in cortical and CA1 pyramidal cells chiefly via NMDA receptors (Emptage et al. 1999; Yuste et al. 1999; Kovalchuk et al. 2000; Schiller et al. 2000; Wei et al. 2001). In contrast, in CA3 pyramidal cells subthreshold Ca2+ transients evoked by single mossy fibre stimulus are mainly due to AMPA receptor-gated depolarization that activates voltage-gated Ca2+ channels (Reid et al. 2001). Additionally, repeated mossy fibre activation leads to a large, delayed postsynaptic increase in [Ca2+]i through release from internal stores (Miller et al. 1996; Yeckel et al. 1999; Kapur et al. 2001).
Hippocampal mossy fibres have several unique morphological and physiological features, including complex presynaptic specializations consisting of several release sites and filopodial extensions, low release probability and pronounced frequency facilitation (Henze et al. 2000; Nicoll & Schmitz, 2005). They also contain an unusually high concentration of zinc (Holm et al. 1988). Recently, it has been reported that vesicular zinc released during repetitive mossy fibre stimulation activates the orphan G-protein coupled receptor 39 (GPR39), a putative postsynaptic zinc receptor, to produce a transient Ca2+ rise in CA3 pyramidal neurones by triggering release from internal stores (Besser et al. 2009). The existence of such a zinc signalling pathway would provide indisputable, functional proof of synaptic zinc release, a topic that remains controversial and hotly contested (Kay & Tóth, 2008; Paoletti et al. 2009). Here we aimed to investigate the presumed modulatory role of vesicular zinc on postsynaptic Ca2+ signals evoked in CA3 pyramidal cells with burst stimulation of mossy fibres. Our data show that neither zinc chelation, nor genetic manipulation of vesicular zinc content in zinc-transporter 3 (ZnT3) knock-out (KO) animals (Cole et al. 1999) leads to any measurable effect on synaptically activated Ca2+ release from internal stores in CA3 pyramidal cells. This suggests that, contrary to previous findings (Besser et al. 2009), vesicular zinc does not play a role in the modulation of postsynaptic calcium signalling at the hippocampal mossy fibre–CA3 pyramidal cell synapse.
Methods
Hippocampal slice preparation
Hippocampal slices (300 μm) were prepared from Sprague–Dawley rats or ZnT3 WT and KO mice (P17–25) using a vibrating-blade microtome (Leica, Germany), as described previously (Lavoie et al. 2007). All protocols were approved by the Animal Protection Committee of Université Laval. The authors have read, and the experiments comply with, the policies and regulations ofThe Journal of Physiologygiven by Drummond (2009). Slices were prepared using ice-cold artificial cerebrospinal fluid (ACSF) containing (mm): NaCl 87, NaHCO3 25, KCl 2.5, NaH2PO4 1.25, MgCl2 7, CaCl2 0.5, glucose 25 and sucrose 75. Right after sectioning, slices were placed in ACSF maintained at 34°C for 40 min, and stored at room temperature prior to imaging experiments. All recordings were performed with extracellular ACSF containing (mm): NaCl 124, NaHCO3 25, KCl 2.5, MgCl2 4, CaCl2 5 and glucose 10; equilibrated with 95% O2–5% CO2, pH7.4 and maintained at 29–32°C. Bicuculine methiodine (1 μm) was always present in extracellular ACSF.
Electrophysiology
Whole-cell current-clamp and voltage-clamp recordings were made with glass electrodes (4–6.5 MΩ) filled with a solution containing (mm): potassium gluconate 120, KCl 20, MgCl2 2, MgATP 4, NaGTP 0.3, Hepes 10, phosphocreatine 7, Fura-2 0.1 and in some cases 2,3-diphosphoglycerate (2,3-DPG). Recordings were made from visually identified CA3 pyramidal neurones, using an Axopatch-200B amplifier (Axon Instruments, Union City, CA, USA), operating under current-clamp and voltage-clamp mode. Data were filtered at 0.5–5 kHz, digitised at 1–16 kHz, and acquired using the Strathclyde electrophysiology software WinWCP (courtesy of Dr J. Dempster, University of Strathclyde, Glasgow, UK). Mossy fibre inputs were electrically stimulated via a patch micropipette placed in the stratum lucidum and identified based on their kinetic properties and profound short-term facilitation. At the end of each experiment (2S,1′R,2′R,3′R)-2-(2,3-dicarboxycyclopropyl)-glycine (DCG-4) was applied to confirm mossy fibre origin of the synaptic input.
Drugs
2.5 mm CaEDTA, 500 μmα-methyl-4-carboxyphenylglycine (MCPG), 50 μm (2R)-amino-5- phosphonovaleric acid (AP5; Sigma- Aldrich, Canada) and 1 μm DCG-4 (Tocris Bioscience, Ellisville, MO, USA) were dissolved in extracellular ACSF and applied through the perfusion system (at least 10 min before imaging). 2,3-DPG at 1 mm (Santa Cruz Biotechnology, Santa Cruz, CA, USA) and 1 mm heparin (Sigma-Aldrich, Canada) were added directly to the patch solution. All reagents were prepared as stock solutions and stored as recommended.
TSQ staining
To label slices for Zn2+, (N-(6-methoxy-8-quiolyl) paratoluenesulphonamide (TSQ)-staining was performed either in fresh slices (right after 40 min incubation at 34°C) or after Ca2+ imaging experiments done in slices stored for 2 and 4 h at room temperature (Vogt et al. 2000). TSQ-stained sections were examined and photographed under fluorescence microscopy (excitation, 360–370 nm; dichromatic beamsplitter, 400 nm, barrier filter, 420 nm). Fluorescence intensity of Zn2+ staining was measured using ImageJ software within five random square regions located in the stratum lucidum, and expressed as %ΔF/F0, whereasF0 was calculated as the averaged background level of fluorescence measured within three random regions in the CA3 pyramidal layer (Supplementary Fig. 1).
Calcium imaging and analysis
Fluorometric Ca2+ imaging was performed after 10 min of dye loading. Ca2+ signals were evoked by repetitive stimulation (2–20 times at 50–100 Hz) and recorded with an interval of at least 2 min to allow Ca2+ store refilling and prevent phototoxicity. Data were obtained using a Zeiss (Oberkochen, Germany) Axioscope equipped with epifluorescence optics, a monochromator and CCD camera (Imago) (T.I.L.L. Photonics, Martinsried, Germany). Regions of interest (ROI) were drawn on clearly distinguishable apical dendrites and basal parts of the soma. Paired images (340 and 380 nm excitation, 510 nm emission) were collected every 56 ms, and pseudocolour ratiometric images were monitored during the experiments. Changes in the fluorescence ratio 340/380 were converted to %ΔF/F0, using T.I.L.L. Photonics software, averaged within ROI and exported to Origin 7.0 (OriginLab Corp., Northampton, MA, USA) for subsequent analysis. To ensure stability of Ca2+ signals at least three consecutive recording were obtained for each condition and only cells with a stable resting fluorescence ratio 340/380 were analysed. As a rule, two to three individual traces from consecutive recordings were averaged to allow more accurate measurements of absolute peak (ΔF/F0,max), time to peak (TTP), half-width and integral (unit of measurement: (%ΔF/F0) s). Hot spots were identified as small dendritic areas with highest integrated increase in the fluorescence. In experiments investigating the threshold of calcium waves (Fig. 5 and 6) individual recordings were analysed using ImageJ software. Pseudo line scans, the generation of line scan-typex–tplot from a 3-D (x, y, t) movies, were obtained along the apical dendrite to capture both spatial and temporal changes of Ca2+ release with increasing number of stimuli. Total Ca2+ signals were measured as the integrated density of fluorescence and expressed as a percentage of maximal recorded response, %(Int. density)max. Data are expressed as means ± SEM Statistical significance was assessed with Student's paired or unpairedttest. The level of significance was set atP< 0.05.
Figure 5. Manipulation of vesicular zinc fails to influence mossy fibre-evoked Ca2+ signals in CA3 pyramidal cells.
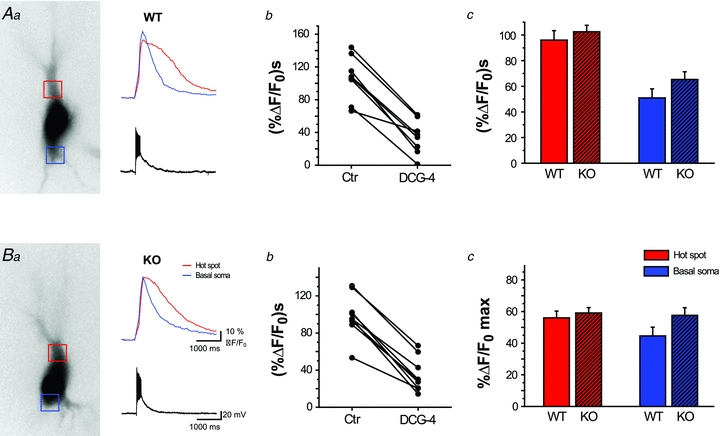
AbandBb, plots showing integral of Ca2+ release from internal stores, evoked by repetitive mossy fibre stimulation (20 times, 100 Hz) in individual pyramidal cells from wild-type (n = 8, A) and ZnT3 KO (n = 9, B) mice. Mossy fibre origin of stimulation was confirmed with DCG-4 application.AcandBc, summary bar graphs showing average integral (Ac) and peak amplitudes (Bc) of Ca2+ signals recorded in wild-type (n = 18) and ZnT3 KO (n = 10) animals. Neither parameter was significantly changed in the absence of vesicular zinc.
Figure 6. Extracellular zinc chelation has no effect on the threshold of Ca2+ release.
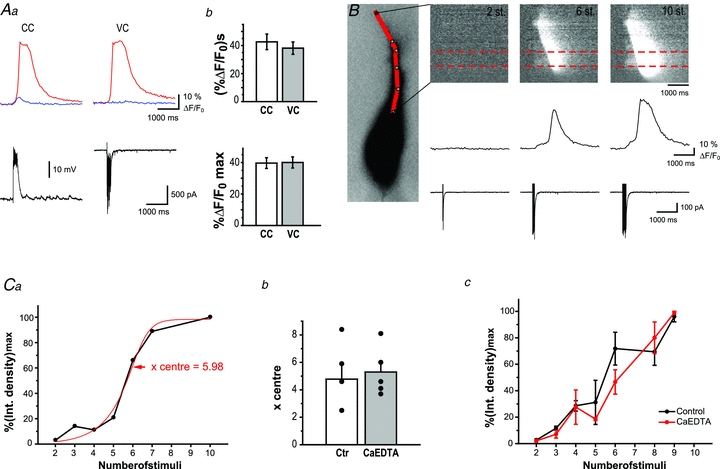
Aa, Ca2+ signals (top) evoked by MF stimulation (10 times, 50 Hz) and recorded in CC (left) and VC (right) mode. Red and blue lines correspond to average calcium signals recorded in the area of the hot spot and the basal soma, respectively. Bottom traces represent associated electrophysiological responses.Ab, bar graphs showing average integral (top) and peak amplitudes (bottom) of Ca2+ signals evoked by repetitive MF stimulation and recorded in CC and VC mode, n = 11. Note, that there is no significant difference between recorded Ca2+ signals.B, Ca2+ signals triggered by 2, 6 and 10 synaptic stimulations (at 50 Hz) and visualized using a pseudo line scan along apical dendrite (left, continuous red line). Corresponding Ca2+ traces and electrophysiological responses are shown at the bottom. Ca2+ signals were averaged in the area of the hot spot indicated by dashed red lines.Ca, individual plot showing correlation of integrated Ca2+ signals, normalized with respect to maximum value and the number synaptic stimulations. Red line corresponds to sigmoidal fitting of data.Cb, bar graph showing individual and averagex-centre for control conditions (4.8 ± 1.1, n = 5) and in the presence of CaEDTA (5.3 ± 0.8, n = 5); no significant difference was observed.Cc, summary plot indicating that threshold for Ca2+ release from internal stores was similar in control conditions (n = 6) and in the presence of CaEDTA (n = 5). Experiments were done in voltage clamp to avoid action potentials using rats.
Results
Repeated stimulation of mossy fibre terminals at 50–100 Hz evoked fast EPSPs or EPSCs recorded from CA3 pyramidal cells in current-clamp or voltage-clamp configuration, respectively. When mossy fibre stimulation evoked only subthreshold EPSPs or EPSCs in the postsynaptic cell, large, delayed [Ca2+] elevations were observed in the proximal apical dendritic region of CA3 pyramidal cells located in the stratum lucidum (Fig. 1). These calcium signals were spatially restricted to this area of mossy fibre termination, spreading only to 46 ± 3 μm from the site of origin (Fig. 1Ac, n = 18). To determine the effect of action potentials on synaptically evoked calcium signals, we compared postsynaptic [Ca2+] elevations between cells exhibiting only EPSPs and neurones where EPSPs triggered action potentials. While subthreshold EPSPs evoked [Ca2+] elevations with a single peak, in cells with action potentials calcium signals showed two temporally segregated peaks (Fig. 1A–C, n = 18 for both groups). The first peak occurred upon action potential generation and the elevation in [Ca2+]i was observed uniformly in the entire cell consistent with Ca2+ influx through VGCCs. The second peak was delayed and corresponded to an increase in [Ca2+]i that was restricted to stratum lucidum similar to events triggered by subthreshold EPSPs only (Fig. 1A–C). Such delayed slow rises in [Ca2+]i upon mossy fibre stimulation are consistent with Ca2+ release from internal stores mainly triggered by inositol trisphosphate (IP3) receptor activation (Miller et al. 1996; Yeckel et al. 1999; Kapur et al. 2001). In order to determine whether this delayed [Ca2+] response is indeed the result of IP3-dependent calcium release from internal stores, we included heparin, an IP3 antagonist, in the recording pipette. Heparin blocked the slow, delayed calcium response while the fast response triggered by action potentials remained unaltered (Fig. 1D–F, n = 6). These data indicate that under our recording conditions we can reliably evoke calcium release from internal stores in CA3 pyramidal cells with stimulation of the mossy fibre pathway.
Figure 1. Spatio-temporal properties of mossy fibre evoked postsynaptic Ca2+ signals in the absence and presence of postsynaptic APs.
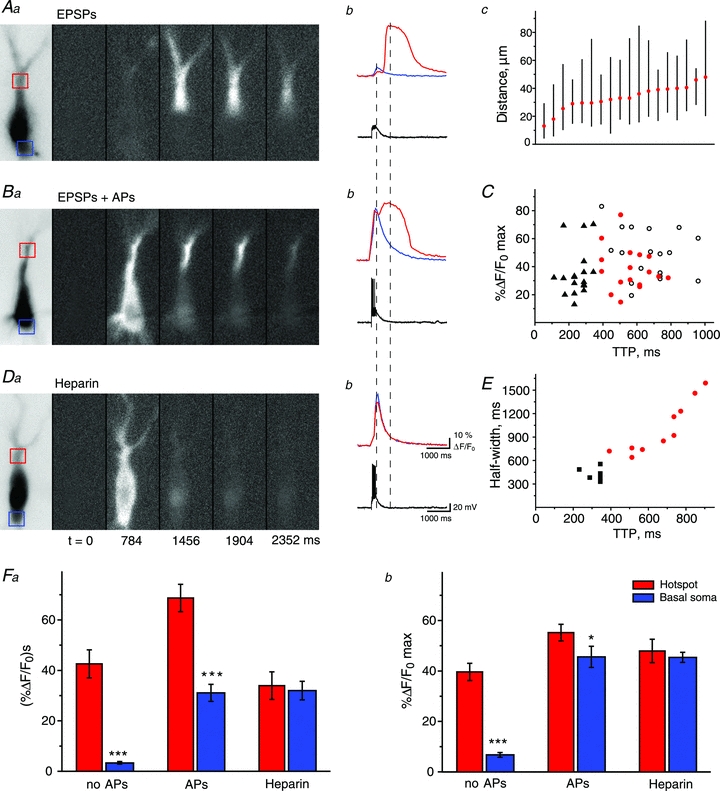
Spatio-temporal distribution of postsynaptic [Ca2+]i changes in control conditions (AaandBa) and in the presence of heparin (Da) evoked by mossy fibre stimulation (10 times, 50 Hz). [Ca2+]i increase corresponding to backpropagating APs distributed uniformly in the cell body (BaandDa) and the apical and basal dendrites, whereas delayed mossy fibre stimulation evoked Ca2+ release from internal stores was restricted to the apical dendrite (AaandBa). Red and blue squares indicate areas where fluorescence signals were measured and averaged. Corresponding Ca2+ traces and electrophysiological responses are shown atAb, BbandDb. Change in [Ca2+]i in basal dendrites showed a dramatic increase only when action potentials were evoked in the postsynaptic cell (Bb).Ac, plot showing the distance the calcium wave, evoked by subthreshold EPSPs, travels from the hot spot (red circle) towards and away from the soma (soma centre = 0); each vertical black line corresponds to the calcium transient spread observed in an individual cell (n = 18).C, data indicating the temporal distribution of peaks in [Ca2+]i observed in stratum lucidum in cells with (black symbols, n = 18) and without (red, n = 18) postsynaptic action potentials. The first peak represents Ca2+ signals initiated by APs (black triangle), while the second (open black circles,) is the result of Ca2+ release from internal stores.Daandb, pharmacological evidence indicating that the second peak in [Ca2+]i is the result of release of Ca2+ from internal stores. When heparin was included in the patch pipette only the first, fast component could be observed, the second was absent in every cell.E, plot showing relationship between time to peak and half width of calcium waves corresponding to store release (evoked by subthreshould EPSPs in control, n = 10, red circles) and to calcium signals evoked by back-propagating APs (in the presence of heparin, n = 6, black squares). Note that temporal properties of these two types of signals are clearly different, thus allowing the analysis of store release even in the presence of APs.F, summary bar graphs showing average integral (a) and peak amplitudes (b) of Ca2+ signals evoked by repetitive mossy fibre stimulation in apical dendrites and basal parts of the soma. Both integral and peak amplitude were significantly larger in the hot spot compared to basal soma (n = 18). This difference was preserved in the presence of APs and completely blocked by heparin (n = 26 andn = 6, respectively). All experiments were done in rats.
We also investigated the use of Fura-2 AM to visualize calcium release from internal stores, as this method would allow the monitoring of several cells simultaneously. First, we incubated the slices in Fura-2 AM (20 μm at 32°C for 20 min, as described; Beierlein et al. 2002). Next, we stimulated the mossy fibre pathway similarly to what has been described previously (200 pA, 10 stimuli at 50 Hz) and monitored changes in intracellular calcium signals in selected cells (Fig. 2). We observed rapid transient calcium signals in the soma of clearly labelled CA3 pyramidal cells (half-width: 498 ± 25 ms, TTP: 385 ± 16 ms, n = 41). However, we were unable to detect calcium signals evoked by the stimulation of the mossy fibre pathway in dendrites. The temporal and spatial properties of calcium signals recorded from cells labelled with Fura-2 AM were similar to those filled with Fura-2 in the presence of heparin. This signifies that the temporal and spatial properties result rather from backpropagating action potentials than from intracellular store release. These data indicate that for the proper detection of calcium release from intracellular stores, cells need to be individually filled with Fura-2 via a patch pipette.
Figure 2. Comparison of calcium signals recorded with membrane permeant Fura-2 AM and membrane-impermeant Fura-2.
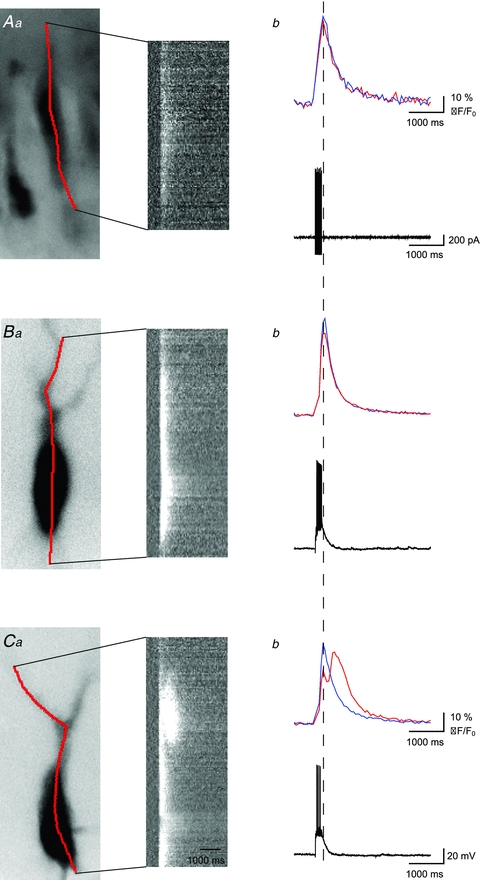
Aa–Ca, fluorescence images of representative CA3 pyramidal cells filled with Fura-2 AM (Aa) and Fura-2 (BaandCa), excitation wavelength 380 nm (left). Continuous red lines indicate position of pseudo line scans shown on the right. Cells were stimulated (10 times, 50 Hz) either by random positioning of stimulation electrode within st. lucidum (A, Fura-2 AM experiments) or by selective stimulation of MF inputs (BandC, Fura-2 experiments).Ab–Cb, corresponding Ca2+ signals (top) and electrophysiological responses recorded in cell-attached (Ab, bottom) and whole-cell mode (BbandCb, bottom). Red and blue lines represent average calcium signals recorded in the area of hot spot and basal soma, respectively. Signals recorded with AM version of Fura have characteristics similar to those recorded in the presence of heparin with Fura-2 and represent rather AP-evoked Ca2+ influx than Ca2+ store release.
Next, we aimed to determine which postynaptic receptor(s) participate in triggering release of Ca2+ from internal stores in CA3 pyramidal cells following mossy fibre stimulation. First we added MCPG (500 μm), an mGluR antagonist, to the bath to investigate the role of mGluRs. MCPG significantly decreased the slow, delayed calcium signals in 3 out of the 6 cells tested (33.3 ± 6.7% of control). In the other three cells, slow calcium waves were not altered significantly in the presence of MCPG (95.7 ± 4.5% of control) (Fig. 3A). In previous studies (Nakamura et al. 1999; Kapur et al. 2001) initial small increases in [Ca2+]i were found to act synergistically with mGluR activation to induce calcium release from internal stores of CA3 pyramidal cells. Thus, we next examined whether Ca2+ influx via NMDA receptors contributes to the initiation of slow calcium transient evoked by mossy fibre stimulation. In the presence of the NMDA receptor antagonist APV (50 μm), [Ca2+] elevations were significantly blocked in 6 out of 10 cells recorded (32.3 ± 5.2% of control) (Fig. 3B). In the remaining four cells where APV did not alter store release significantly (93.8 ± 13% of control), we next applied MCPG to the bath. When both NMDA and mGluR receptors were blocked simultaneously, slow calcium events were decreased significantly in every cell examined (37.7 ± 12.6% of control) (Fig. 3C). These data suggest that activation of either mGluRs or NMDA receptors can be sufficient to trigger calcium release from internal stores upon mossy fibre activation. However, in approximately 50% of the cases these receptors act synergistically to evoke slow calcium transients in CA3 pyramidal cells.
Figure 3. The role of mGluR1 and NMDA receptor activation in mossy fibre-evoked Ca2+ release.
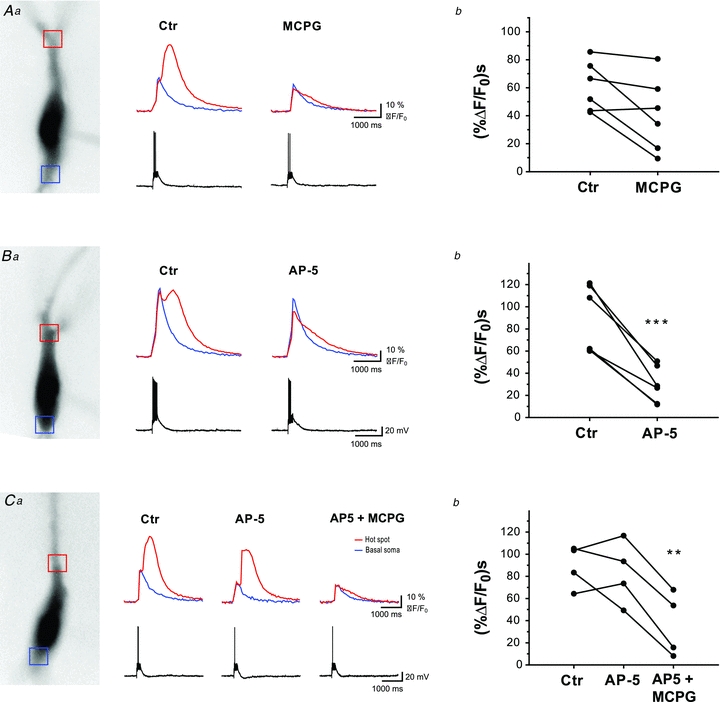
Aa–Ca, fluorescence images of CA3 pyramidal cells filled with Fura-2 (excitation wavelength 380 nm) are shown together with corresponding Ca2+ traces and electrophysiological responses. Fluorescence signals were averaged in the area of hot spot and basal soma, indicated by red and blue squares, respectively. Ca2+ signals evoked by mossy fibre stimulation (10 times, 50 Hz) were recorded in control conditions (left,) and after application of MCPG-4, AP5 or both drugs (right).Ab–Cb, plots showing the effect of applied drugs on integral of Ca2+ signals recorded from individual pyramidal cells. MCPG-4 (n = 6) and AP5 (n = 6) significantly decreased the slow Ca2+ transient associated with Ca2+ release from intracellular stores in ∼50% of cells, while a combination of both drugs together abolished Ca2+ signals in all tested cells (n = 4). All experiments were done in rats.
Synaptically evoked calcium release from internal stores identified and characterised in our experiments has been suggested to be modulated by vesicular zinc sequestered into mossy fibre terminals (Besser et al. 2009). To determine whether synaptically released zinc has any effect on calcium release from internal stores we used two methods to prevent the transynaptic passage of zinc. We used the membrane-impermeant zinc chelator CaEDTA and additionally compared calcium signals in wild-type (WT) and zinc transporter 3 (ZnT3) knock-out (KO) animals that lack vesicular zinc (Cole et al. 1999) (Figs 4 and 5). First, we repeatedly evoked postsynaptic calcium signals with mossy fibre stimulation to demonstrate that stable, reproducible signals can be evoked multiple times under control conditions (Fig. 4A). Next, we applied CaEDTA (2.5 mm) to the bath. In comparing the calcium waves evoked in control ACSF with those obtained in the presence of CaEDTA, we did not observe any significant difference (38 ± 5.4 (%ΔF/F0) s in control, 37.4 ± 4.2 (%ΔF/F0) s in CaEDTA, n = 10) (Fig. 4B). While CaEDTA may chelate zinc in the extracellular space, its binding properties might be too slow to capture zinc in the synaptic cleft (Paoletti et al. 2009), and therefore the genetic ablation of vesicular zinc content was used to confirm our results obtained with CaEDTA. We recorded synaptically evoked calcium signals in WT and in ZnT3 KO animals (n = 28). Large, delayed calcium responses following mossy fibre stimulation were evoked in CA3 pyramidal cells of both WT and KO animals (Fig. 5AandB). Moreover, in comparing both the peak and integral of the calcium events between WT (n = 18) and KO (n = 10) animals, no significant differences were found: integral WT: 96 ± 7.4 (%ΔF/F0) s, integral KO: 102.5 ± 5.1 (%ΔF/F0) s, and peak WT: 56 ± 4.3%ΔF/F0, peak KO: 59.1 ± 3.4%ΔF/F0) (Fig. 5AcandBc). Neither zinc chelation nor the genetic ablation of the vesicular zinc transporter had any measurable effect on the postsynaptic calcium signals registered in CA3 pyramidal cells upon the stimulation of presynaptic mossy fibres. The lack of measurable effect of the manipulation of endogenous zinc levels could be explained simply by the absence of vesicular zinc in our control preparations. In order to exclude this possibility, we used TSQ staining to monitor changes in vesicular zinc levels during our experiments and compared it to the levels we observed immediately after sectioning. When we compared the intensity of the TSQ-staining between control slices and after imaging experiments, no significant difference was observed (Supplementary Fig. 1) indicating that vesicular zinc levels did not diminished due to our recording conditions.
Figure 4. Manipulation of extracellular zinc fails to influence mossy fibre-evoked Ca2+ signals in CA3 pyramidal cells.
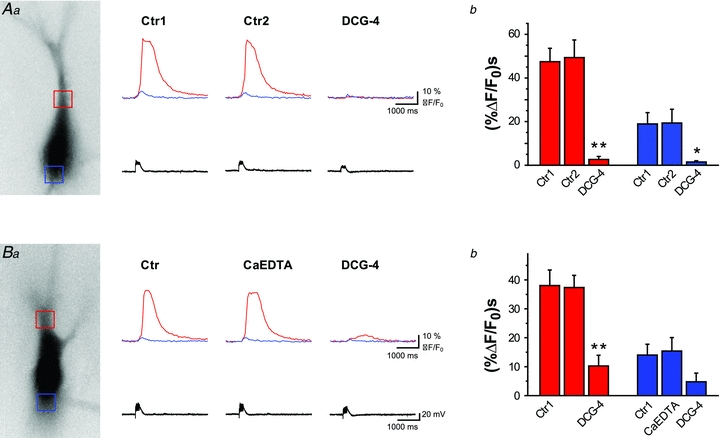
Aa–Da, fluorescence images of representative CA3 pyramidal cells filled with Fura-2 (excitation wavelength 380 nm) (left). Signals were averaged in the area of hot spot and basal soma, indicated by red and blue squares, respectively. Corresponding Ca2+ traces and electrophysiological responses are shown (right).AbandBb, summary bar graphs showing average integral of Ca2+ signals evoked with burst stimulation of the mossy fibre pathway (10 times, 50 Hz). Ca2+ release from internal stores was stable under control conditions (n = 6, A) and was not significantly affected by extracellular zinc chelation with CaEDTA, applied for at least 10 min (n = 7, B). However, Ca2+ signals were drastically diminished by DCG-4, which confirms mossy fibre origin of evoked events. All experiments were done in rats.
In our experiments we failed to detect measurable differences in synaptically evoked calcium signals in the absence of extracellular or vesicular zinc. However, it is possible that vesicular zinc alters the relationship between stimulation intensity and the size of the evoked calcium signals. In this case, in our previous experiments where we used suprathreshold stimulations, the role of vesicular zinc in the regulation of the threshold of calcium release would be masked by the intensity of the stimuli. In order to investigate this possibility, we monitored how changes in stimulus intensity influence synaptically evoked calcium release from internal stores. Our previous experiments were executed in current-clamp configuration as we aimed to study synaptically evoked calcium release under conditions where all voltage-dependent mechanisms can contribute to the observed release. Altering stimulus intensity in current-clamp configuration would lead to high variability in the number of action potentials evoked at each stimulus strength; this would render data interpretation difficult, if not impossible. For this reason, we investigated the relationship between stimulus intensity and calcium release in voltage-clamp mode. Similarly to previously published data (Kapur et al. 2001), synaptically evoked calcium release had comparable amplitude and size in both recording conditions (Fig. 6A, n = 11). We increased the number of stimuli applied to mossy fibres (2 to 10, 50 Hz) and recorded the evoked calcium signals in CA3 pyramidal cells (Fig. 6B). As the number if stimuli increased, the amplitude and spread of calcium waves also increased. The relationship between these two parameters and the stimulus strength was best fitted with a sigmoidal curve (Fig. 6Ca). We used thex-centre (inflection point) of the sigmoidal fit to quantitatively assess the threshold of the calcium waves. We compared the inflection point of the sigmoidal fit (Richards equation) of the stimulus intensity–calcium wave amplitude plots between recordings made in control ACSF and in recording solutions containing 2.5 mm CaEDTA (Fig. 6Cb); thex-centre in the two groups was similar (4.8 ± 1.1 and 5.3 ± 0.8, respectively). Increasing number of stimuli increased synaptically evoked calcium waves in a similar fashion in the absence or presence of CaEDTA (Fig. 6Cc, n = 6 andn = 5, respectively). Next, we aimed to investigate how changes in stimulus intensity affect the amplitude of synaptically evoked calcium waves in the absence of vesicular zinc by comparing these values between wild-type and ZnT3 KO animals (8 to 20, 100 Hz) (Fig. 7A). Surprisingly, correlation between stimulus intensity the amplitude of the synaptically evoked calcium wave in mice was linear rather than sigmoidal (Fig. 7Ba), and therefore we could not reliably determine a deflection point in the plotted results. When the number of stimuli was increased, amplitudes of calcium waves increased at a comparable rate in WT (n = 9) and KO (n = 14) animals, and no detectable difference was observed at any of the stimulus intensities we investigated (Fig. 7Bb).
Figure 7. Lack of vesicular zinc does not alter the relationship between stimulus strength and Ca2+ release.
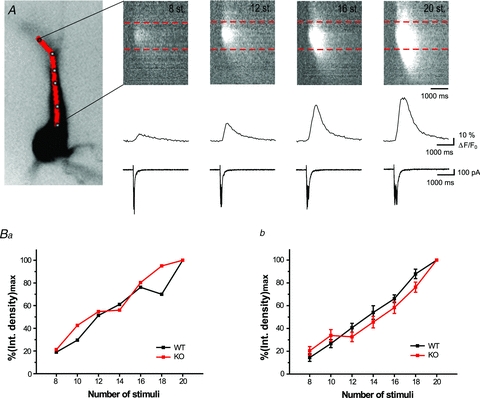
A, Ca2+ signals triggered by 8, 12, 16 and 20 synaptic stimulations (at 100 Hz) and visualized using a pseudo line scan along apical dendrite (continuous red line, left). Corresponding Ca2+ traces and electrophysiological responses are shown at the bottom. Ca2+ signals were averaged within the area of the hot spot indicated by dashed red lines.Ba, plot showing correlation between integrated Ca2+ signals, normalized with the respect to maximum value and the number of synaptic stimuli. Data from an individual cell are shown. Note that in both ZnT3 wild-type and KO mice, linear correlation was observed between the number of stimuli and the amplitude of the Ca2 waves, unlike the data obtained from rats (Fig. 6).Bb, summary plot indicating that Ca2+ signals evoked by different number of synaptic stimuli were not significantly different in ZnT3 KO mice (n = 14) when compared to wild-type animals (n = 9).
These data show that, contrary to a previous report by Besser et al. (2009), vesicular zinc in hippocampal mossy fibre terminals has no impact on postsynaptic calcium signalling in CA3 pyramidal cells.
Discussion
The results presented here do not support a role for release of vesicular zinc from hippocampal mossy fibre terminals in triggering synaptically evoked calcium signals in CA3 pyramidal cells. Our findings directly contradict previous results obtained by Besser et al. (2009), who reported a direct metabotropic action of synaptically released zinc in promoting postsynaptic Ca2+ release from intracellular stores. There are differences in experimental approaches used by Besser et al. and our group. We monitored changes in [Ca2+]i using Fura-2 in individually filled pyramidal cells, while Besser et al. utilized Fura-2 AM in bulk loaded hippocampal slices. Our experiments showed that the delayed slow calcium signals last on average for ∼2 s, in good agreement with previously published data (Miller et al. 1996; Yeckel et al. 1999; Kapur et al. 2001), while Besser et al. observed calcium signals with significantly longer half-width (>10 s). We used animals between the ages P17 and 25, when the mossy fibres are mature (Amaral & Dent 1981), whereas Besser et al. used younger animals (P8–16). We measured calcium release from intracellular stores in dendrites while Besser et al. monitored changes in calcium signals in the somatic region. These differences in experimental approaches could contribute to the discrepancy between our findings.
Mossy fibre activity can evoke fast, spatially restricted and slow, actively spreading Ca2+ signals in the dendrites of CA3 pyramidal cells. Single, subthreshold stimulus evokes fast transient Ca2+ signals which are restricted to the spine (Reid et al. 2001). We used repeated stimulation that evoked delayed, slow Ca2+ waves in the proximal dendrites of pyramidal cells similarly to previously published observations (Miller et al. 1996; Yeckel et al. 1999; Kapur et al. 2001). Our data indicate that both NMDA and mGlu receptors are involved in this process. Previous reports demonstrated the dominant role of mGluRs in the absence of NMDA receptor activity (Kapur et al. 2001). Our data show that calcium entry via NMDA receptors also participates in the initial calcium signal leading to release from internal stores. In several cases, a synergistic action of mGlu and NMDA receptors was necessary to trigger the slow, delayed rise in [Ca2+]i.
The exact functional role of calcium release from intracellular stores is not known. However, backpropagating action potentials have been shown to act synergistically with subthreshold stimulation to evoke Ca2+ release from IP3-sensitive stores (Nakamura et al. 1999) indicating that it could play an important role in the Hebbian form of plasticity.
Experimentally and statistically it is very difficult to prove negative results. It is always possible to argue that the experimental design did not have sufficient ‘n’ to detect small differences. However, we can determine the certainty in which we can reject the null hypothesis. Previous results indicated that in the absence of zinc postsynaptic calcium signals are ∼50% smaller (Besser et al. 2009), and from this value we estimated thatn = 5/per group would have sufficient power to detect at least 40% difference. In our experiments we used even bigger sample size to increase the power of our data. Indeed, post hocpower analysis showed that with the sample size used in our experiments we had more than 80% power to detect a 20% decrease at significance level ofP< 0.05. Is it possible that smaller difference could exist? The power of our data is not high enough to rule out this possibility with certainty. Based on the distribution of our data, one would need 60–70 cells to detect 10% difference, and more than 250 cells to detect 5% difference with reasonable certainty (80% power atP< 0.05). Our data have sufficient power to rule out 20% or greater difference, but a smaller change may exist.
Finally, the limits of the spatial resolution and calcium sensitivity of the imaging technique we used need to be acknowledged. Activation of single synapses can create highly localized calcium microdomains in the dendrites of neocortical fast spiking neurons (Goldberg et al. 2003) where calcium increase can be observed in a 1 μm radius of the dendrite due to calcium influx via calcium-permeable AMPA receptors. The existence of calcium nanodomains following calcium influx through L-type calcium channels in dendrites was also suggested (Yasuda et al. 2003). If additionally to the large calcium waves we observed after mossy fibre stimulation, very localized calcium signals also existed at the nanoscale we would not be able to detect them optically. Given the optical parameters of the imaging system we used, conclusions from our experiments are valid to calcium signals that spread at least 0.5 μm in the dendrites of CA3 pyramidal cells. In the presence of magnesium in the intracellular solution theKd of Fura-2 increases. Under these circumstances Fura-2 can only detect calcium signals that are at least 50 nm; smaller elevations in intracellular concentration could not be reliably observed with this calcium indicator.
In summary, our experiments show that vesicular zinc localized in the presynaptic terminal of hippocampal granule cells does not trigger significant calcium release (>50 nm) from the intracellular stores in postsynaptic CA3 pyramidal cells that spread to large section of the dendritic tree (>0.5 μm).
Acknowledgments
The authors thank Dr Luca Pellegrini and Danny Jeyaraju for their help with genotyping, and Dr Yves DeKoninck (CRULRG, Quebec, Canada) for allowing access to the imaging set-up. We also thank Drs Alan Kay (University of Iowa) and Kenneth A. Pelkey (NIH, NICHD) for the critical reading of the manuscript. This work was supported by CIHR to K.T.; A.E. was supported by a CRCN scholarship.
Glossary
Abbreviations
- AP
action potential
- AP5
((2R)-amino-5-phosphonovaleric acid
- AUC
area under curve
- CC
current clamp
- DCG-4
(2S,1′R,2′R,3′R)-2-(2,3-dicarboxycyclopropyl)-glycine
- 2,3-DPG
2,3-diphosphoglycerate
- EPSC
excitatory postsynaptic current
- EPSP
excitatory postsynaptic potential
- IP3
inositol trisphosphate
- KO
knock out
- MCPG
α-methyl-4-carboxyphenylglycine
- mGluR
metabotropic glutamate receptor
- ROI
region of interest
- TTP
time to peak
- VC
voltage clamp
- VGCC
voltage-gated calcium channel
- WT
wild-type
- ZnT3
zinc transporter
Author contributions
A.E. and K.T. designed the experiments. A.E. performed the experiments and analysed the data. A.E. and K.T. interpreted the results. K.T. wrote the manuscript. All authors approved the final version for publication.
Supplementary material
Supplementary Fig. 1
As a service to our authors and readers, this journal provides supporting information supplied by the authors. Such materials are peer-reviewed and may be re-organized for online delivery, but are not copy-edited or typeset. Technical support issues arising from supporting information (other than missing files) should be addressed to the authors
References
- Amaral DG, Dent JA. Development of the mossy fibers of the dentate gyrus: I. A light and electron microscopic study of the mossy fibers and their expansions. J Comp Neurol. 1981;195:51–86. doi: 10.1002/cne.901950106. [DOI] [PubMed] [Google Scholar]
- Beierlein M, Fall CP, Rinzel J, Yuste R. Thalamocortical bursts trigger recurrent activity in neocortical networks: layer 4 as a frequency-dependent gate. J Neurosci. 2002;22:9885–9894. doi: 10.1523/JNEUROSCI.22-22-09885.2002. [DOI] [PMC free article] [PubMed] [Google Scholar]
- Besser L, Chorin E, Sekler I, Silverman WF, Atkin S, Russell JT, Hershfinkel M. Synaptically released zinc triggers metabotropic signaling via a zinc-sensing receptor in the hippocampus. J Neurosci. 2009;29:2890–2901. doi: 10.1523/JNEUROSCI.5093-08.2009. [DOI] [PMC free article] [PubMed] [Google Scholar]
- Cole TB, Wenzel HJ, Kafer KE, Schwartzkroin PA, Palmiter RD. Elimination of zinc from synaptic vesicles in the intact mouse brain by disruption of the ZnT3 gene. Proc Natl Acad Sci U S A. 1999;96:1716–1721. doi: 10.1073/pnas.96.4.1716. [DOI] [PMC free article] [PubMed] [Google Scholar]
- Drummond GB. Reporting ethical matters inThe Journal of Physiology: standards and advice. J Physiol. 2009;587:713–719. doi: 10.1113/jphysiol.2008.167387. [DOI] [PMC free article] [PubMed] [Google Scholar]
- Emptage N, Bliss TV, Fine A. Single synaptic events evoke NMDA receptor-mediated release of calcium from internal stores in hippocampal dendritic spines. Neuron. 1999;22:115–124. doi: 10.1016/s0896-6273(00)80683-2. [DOI] [PubMed] [Google Scholar]
- Goldberg JH, Tamas G, Aronov D, Yuste R. Calcium microdomains in aspiny dendrites. Neuron. 2003;40:807–821. doi: 10.1016/s0896-6273(03)00714-1. [DOI] [PubMed] [Google Scholar]
- Henze DA, Urban NN, Barrionuevo G. The multifarious hippocampal mossy fiber pathway: a review. Neuroscience. 2000;98:407–427. doi: 10.1016/s0306-4522(00)00146-9. [DOI] [PubMed] [Google Scholar]
- Holm IE, Andreasen A, Danscher G, Pérez-Clausell J, Nielsen H. Quantification of vesicular zinc in the rat brain. Histochemistry. 1988;89:289–293. doi: 10.1007/BF00493154. [DOI] [PubMed] [Google Scholar]
- Jaffe DB, Johnston D, Lasser-Ross N, Lisman JE, Miyakawa H, Ross WN. The spread of Na+ spikes determines the pattern of dendritic Ca2+ entry into hippocampal neurons. Nature. 1992;357:244–246. doi: 10.1038/357244a0. [DOI] [PubMed] [Google Scholar]
- Kapur A, Yeckel M, Johnston D. Hippocampal mossy fiber activity evokes Ca2+ release in CA3 pyramidal neurons via a metabotropic glutamate receptor pathway. Neuroscience. 2001;107:59–69. doi: 10.1016/s0306-4522(01)00293-7. [DOI] [PMC free article] [PubMed] [Google Scholar]
- Kay AR, Tóth K. Is zinc a neuromodulator? Sci Signal. 2008;1:re3. doi: 10.1126/stke.119re3. [DOI] [PMC free article] [PubMed] [Google Scholar]
- Kovalchuk Y, Eilers J, Lisman J, Konnerth A. NMDA receptor-mediated subthreshold Ca2+ signals in spines of hippocampal neurons. J Neurosci. 2000;20:1791–1799. doi: 10.1523/JNEUROSCI.20-05-01791.2000. [DOI] [PMC free article] [PubMed] [Google Scholar]
- Larkum ME, Watanabe S, Nakamura T, Lasser-Ross N, Ross WN. Synaptically activated Ca2+ waves in layer 2/3 and layer 5 rat neocortical pyramidal neurons. J Physiol. 2003;549:471–488. doi: 10.1113/jphysiol.2002.037614. [DOI] [PMC free article] [PubMed] [Google Scholar]
- Lavoie N, Peralta MR, Chiasson M, Lafortune K, Pellegrini L, Seress L, Tóth K. Extracellular chelation of zinc does not affect hippocampal excitability and seizure-induced cell death in rats. J Physiol. 2007;578:275–289. doi: 10.1113/jphysiol.2006.121848. [DOI] [PMC free article] [PubMed] [Google Scholar]
- Miller LD, Petrozzino JJ, Golarai G, Connor JA. Ca2+ release from intracellular stores induced by afferent stimulation of CA3 pyramidal neurons in hippocampal slices. J Neurophysiol. 1996;76:554–562. doi: 10.1152/jn.1996.76.1.554. [DOI] [PubMed] [Google Scholar]
- Nakamura T, Barbara JG, Nakamura K, Ross WN. Synergistic release of Ca2+ from IP3-sensitive stores evoked by synaptic activation of mGluRs paired with backpropagating action potentials. Neuron. 1999;24:727–737. doi: 10.1016/s0896-6273(00)81125-3. [DOI] [PubMed] [Google Scholar]
- Nicoll RA, Schmitz D. Synaptic plasticity at hippocampal mossy fibre synapses. Nat Rev Neurosci. 2005;6:863–876. doi: 10.1038/nrn1786. [DOI] [PubMed] [Google Scholar]
- Paoletti P, Vergnano AM, Barbour B, Casado M. Zinc at glutamatergic synapses. Neuroscience. 2009;158:126–136. doi: 10.1016/j.neuroscience.2008.01.061. [DOI] [PubMed] [Google Scholar]
- Reid CA, Fabian-Fine R, Fine A. Postsynaptic calcium transients evoked by activation of individual hippocampal mossy fiber synapses. J Neurosci. 2001;21:2206–2214. doi: 10.1523/JNEUROSCI.21-07-02206.2001. [DOI] [PMC free article] [PubMed] [Google Scholar]
- Schiller J, Helmchen F, Sakmann B. Spatial profile of dendritic calcium transients evoked by action potentials in rat neocortical pyramidal neurones. J Physiol. 1995;487:583–600. doi: 10.1113/jphysiol.1995.sp020902. [DOI] [PMC free article] [PubMed] [Google Scholar]
- Schiller J, Major G, Koester HJ, Schiller Y. NMDA spikes in basal dendrites of cortical pyramidal neurons. Nature. 2000;404:285–289. doi: 10.1038/35005094. [DOI] [PubMed] [Google Scholar]
- Spruston N, Schiller Y, Stuart G, Sakmann B. Activity-dependent action potential invasion and calcium influx into hippocampal CA1 dendrites. Science. 1995;268:297–300. doi: 10.1126/science.7716524. [DOI] [PubMed] [Google Scholar]
- Stuart GJ, Sakmann B. Active propagation of somatic action potentials into neocortical pyramidal cell dendrites. Nature. 1994;367:69–72. doi: 10.1038/367069a0. [DOI] [PubMed] [Google Scholar]
- Wei DS, Mei YA, Bagal A, Kao JP, Thompson SM, Tang CM. Compartmentalized and binary behavior of terminal dendrites in hippocampal pyramidal neurons. Science. 2001;293:2272–2275. doi: 10.1126/science.1061198. [DOI] [PubMed] [Google Scholar]
- Vogt KE, Mellor J, Tong G, Nicoll R. The actions of synaptically released zinc at hippocampal mossy fiber synapses. Neuron. 2000;26:187–96. doi: 10.1016/s0896-6273(00)81149-6. [DOI] [PubMed] [Google Scholar]
- Yasuda R, Sabatini BL, Svoboda K. Plasticity of calcium channels in dendritic spines. Nat Neurosci. 2003;6:948–955. doi: 10.1038/nn1112. [DOI] [PubMed] [Google Scholar]
- Yeckel MF, Kapur A, Johnston D. Multiple forms of LTP in hippocampal CA3 neurons use a common postsynaptic mechanism. Nat Neurosci. 1999;2:625–633. doi: 10.1038/10180. [DOI] [PMC free article] [PubMed] [Google Scholar]
- Yuste R, Majewska A, Cash SS, Denk W. Mechanisms of calcium influx into hippocampal spines: heterogeneity among spines, coincidence detection by NMDA receptors, and optical quantal analysis. J Neurosci. 1999;19:1976–1987. doi: 10.1523/JNEUROSCI.19-06-01976.1999. [DOI] [PMC free article] [PubMed] [Google Scholar]
Associated Data
This section collects any data citations, data availability statements, or supplementary materials included in this article.