

Background: The serotonin transporter is the site of action of antidepressants and amphetamines.
Results: Single molecular force spectroscopy allowed for mapping the energy landscape involved in MFZ2-12/SERT binding.
Conclusion: Our data indicate that the outer vestibule imposes a barrier on the entry of MFZ2-12 into the SERT substrate binding site.
Significance: Our results provide a useful framework for a further exploration of antidepressant binding.
Keywords: Atomic Force Microscopy, Molecular Docking, Molecular Imaging, Serotonin Transporters, Spectroscopy, Binding Reaction, Force Spectroscopy, MFZ2-12
Abstract
The serotonin transporter (SERT) terminates neurotransmission by removing serotonin from the synaptic cleft. In addition, it is the site of action of antidepressants (which block the transporter) and of amphetamines (which induce substrate efflux). The interaction energies involved in binding of such compounds to the transporter are unknown. Here, we used atomic force microscopy (AFM) to probe single molecular interactions between the serotonin transporter and MFZ2-12 (a potent cocaine analog) in living CHOK1 cells. For the AFM measurements, MFZ2-12 was immobilized on AFM tips by using a heterobifunctional cross-linker. By varying the pulling velocity in force distance cycles drug-transporter complexes were ruptured at different force loadings allowing for mapping of the interaction energy landscape. We derived chemical rate constants from these recordings and compared them with those inferred from inhibition of transport and ligand binding: koff values were in good agreement with those derived from uptake experiments; in contrast, the kon values were scaled down when determined by AFM. Our observations generated new insights into the energy landscape of the interaction between SERT and inhibitors. They thus provide a useful framework for molecular dynamics simulations by exploring the range of forces and energies that operate during the binding reaction.
Introduction
Synaptic transmission in the brain is terminated by enzymatic breakdown or retrieval of the released neurotransmitter. The monoamines dopamine and serotonin are subject to reuptake by closely related transporters, i.e. DAT, NET, and SERT. These transporters belong to the SLC6 (solute carrier-6) family of sodium symporters (1) and are targets for therapeutic drugs (e.g. antidepressants) and addictive compounds that are consumed illicitly (e.g. amphetamines and cocaine). Antidepressants act as transport inhibitors of SERT and NET; amphetamines target monoamine transporters as substrates that induce reverse transport and hence non-exocytotic release of dopamine, serotonin, and norepinephrine (2). SERT has been studied extensively because of its therapeutic relevance and the pharmacological profiles of the selective serotonin reuptake inhibitors (3). A bacterial homolog, LeuTAa, has been crystallized in several conformations (4–8) and has allowed for the development of testable models about the nature of the ligand binding site (9–13). These models capture the salient features of ligand docking (e.g. the presence of a vestibular binding site (S2) and the central substrate binding site (S1)) and suggest candidate permeation pathways (10). However, they fail to capture the communication of the hydrophobic core of the protein with its intracellular N and C termini and with the surrounding lipid phase. Cholesterol, for instance, must be present in the lipid shell surrounding SERT to allow for ligand binding and transport (14). Similarly, both, the N and the C termini affect the binding pocket, e.g. removing the N terminus or restricting its mobility precludes amphetamine-induced transport reversal (15). Moreover, binding of syntaxin-1 to the N terminus abolishes leak currents through the transporter (16) and mutations within the C terminus impair folding, which, however can be restored if ibogaine, a compound that binds to the inward facing confirmation, is in the binding pocket (17, 18). Finally, SERT is a constitutive oligomer (19, 20). The current evidence suggests that this oligomeric nature is required to support amphetamine-induced substrate efflux, suggesting that there is also a dynamic interaction of the individual transporter moieties within the oligomer (21).
In the present study, we explored whether atomic force microscopy (AFM)2 was suitable to directly probe the strength and the dynamics of ligand binding to SERT. AFM allows for imaging at the atomic scale (22) and achieves nanometer topographical resolution of biological samples in a physiological environment (23). AFM-based single molecule force spectroscopy (SMFS) probes the interactions between ligands on the AFM tip and complementary receptor molecules on a sample surface (24–26) and to explore the energy landscape on a molecular level (27–32). Here, we selected the cocaine analog MFZ2-12 (33) as it has previously been reported to tolerate sterically bulky substitutions, e.g. rhodamine (34). We therefore surmised that MFZ2-12 could be attached to the AFM tip in a manner that would allow binding to SERT. The experiments revealed that MFZ2-12 immobilized on the cantilever bound in the absence of competing ligands and the bond between SERT and MFZ2-12 was broken with an unbinding force of ∼50 pN. We determined the kinetic off-rates of MFZ2-12 binding to SERT, by stressing the bonds with varying external forces. Kinetic on-rates were deduced from measuring the binding probability at different resting times of the AFM probe on the surface.
EXPERIMENTAL PROCEDURES
Materials
Maleimide-PEG27-NHS was purchased from Polypure. N-Succinimidyl 3-(2-pyridyldithio)propionate (SPDP) was synthesized according to Ref. 36, MFZ2-12 was prepared as described (33), and MFZ2-12-ethyl-NH2 (8-(2-amino-ethyl)-3β-(3,4-dichloro-phenyl)-8-azabicyclo[3.2.1]octane-2β-carboxylic acid methyl ester) was prepared as described in Ref. 34. CHOK1 were transfected with a YFP-hSERT construct to yield CHOK1-YFPhSERT cells. The addition of YFP to the amino terminus of SERT neither alters its substrate nor its inhibitor pharmacology in HEK293 cells (19, 20), and this was also the case in CHOK1-YFPhSERT cells (data not shown). Cells were grown on ibidi μ-slides (Integrated BioDiagnostics). Si3N4 AFM tips were purchased from Veeco (Santa Barbara, CA). Tritiated 5-hydroxytryptamine (5HT) was purchased from PerkinElmer Life Sciences (Waltham, MA). All other chemicals and standard reagents were obtained from different commercial sources in the highest purity grade available.
MFZ2-12-PDP Synthesis
SPDP (17 mg, 55 μmol) was added to MFZ2-12-ethyl-NH2 hydrochloride (11.6 mg, 27 μmol) suspended in CH2Cl2 (1 ml) (see Fig. 1). After addition of Hünig's base (15 μl, 8.8 μmol), the reaction mixture was stirred under an atmosphere of argon for 2 h. Toluene (2 ml) was added, and the reaction mixture was evaporated. Addition of toluene and evaporation was repeated twice to remove residual amounts of Hünig's base. The crude product was taken up in a mixture of MeOH/H2O/AcOH (0.5/4/0.2), filtered, and subjected to preparative column chromatography on RP-18 material, yielding 12.9 mg (16.5 μmmol) of pure product in its diprotonated form. A gradient of 0.1% TFA in H2O and 0.1% TFA in i-PrOH was used.
FIGURE 1.

Reaction schematic illustrating the strategy employed for tethering of MFZ2-12 to the AFM tips. The heterobifunctional cross-linker maleimide-PEG27-NHS was linked to the AFM tip. The NHS ester function supports the coupling of the linker to the amine groups on the tip. These amine groups were introduced with APTES from the gas phase. Subsequently, MFZ2-12-PDP (prepared from MFZ2-12-NH2 and SPDP) was allowed to react with the terminal maleimide group.
The product was partially deprotonated at the pyridine nitrogen on the TLC plate. Rf (diprotonated) = 0.27, Rf (monoprotonated) = 0.55, TLC solvent: CHCl3/MeOH/AcOH = 8/2/0.1. According to 1H NMR, the product is completely in its diprotonated form. 1H NMR (500 MHz, CDCl3) δ (ppm): 8.61 (1H, d, pyridyl-H), 7.87 (2H, m, pyridyl-H), 7.34 (1H, m, pyridyl-H), 7.41 (1H, d, phenyl); 7.26 (1H, s, phenyl), 6.99 (1H, d, phenyl), 4.42 (2H, m, NH+), 3.83 (1H, m, bicyclic), 3.63 (1H, m, bicyclic), 3.42 (3H, s, CH3), 3.45–3.3 (4H, m, NH+-CH2CH2-NH-), 3.18 (2H, t, -S-CH2-CH2-CO-), 2.90–2.75 (2H, m, bicyclic), 2.83 (2H, t, -S-CH2-CH2-CO-), 2.46 (1H, m, bicyclic), 2.42 (1H, m, bicyclic), 2.16 (1H, m, bicyclic), and 1.98 (1H, d, bicyclic).
Tip Chemistry
Commercially available AFM cantilevers were amino-functionalized as described previously, using the gas phase method for reaction with APTES (35). The MFZ-AFM tip was prepared by attaching a heterobifunctional PEG linker (maleimide-PEG27-NHS) to MFZ2-12-PDP by incubating the tip for 2 h in 0.5 ml chloroform containing 1 mg maleimide-PEG27-NHS and 0.5% triethylamine, resulting in the acylation of surface-linked APTES by the N-hydroxysuccinimide (NHS ester) group. After rinsing with chloroform and drying, the tips were incubated in a solution of 50 μl of MFZ2-12-PDP (4 mm), 6 μl tris(2-carboxyethyl)phosphine (TCEP) (100 mm), and 9 μl of NaOH (100 mm) to achieve a pH of 7.5 overnight at 10 °C (saturated atmosphere of humidity to avoid desiccation of ligand solution (65 μl)) (see Fig. 1). Thereafter, tips were rinsed in PBS buffer and stored at 10 °C for 4 days at the longest.
Cell Culture
CHO-K1 cells were grown in Petri dishes for uptake measurements and in ibidi μ-slides for AFM measurements using Ham's F12 medium containing 1% l-glutamine, 0,1% gentamycin, and 10% FBS Gold. To keep the selection pressure sufficiently high, 0.5% G418 (50 mg/ml) was added to the medium. For AFM measurements, the growth medium was exchanged to a physiological HEPES buffer containing 140 mm NaCl, 5 mm KCl, 1 mm MgCl2, 1 mm CaCl2, and 10 mm HEPES (pH 7.4 with NaOH). All measurements were done at room temperature.
Uptake Measurements
Uptake experiments were performed as described (38). In brief, for the determination of nonspecific uptake by SERT, we used 10 μm paroxetine (preincubation time, 5 min), and [3H]5HT (0.15 μm) was added for 1 min. Prior to the experiment, the cells were washed once in uptake buffer (containing 25 mm HEPES, 120 mm NaCl, 5 mm KCl, 1.2 mm CaCl2, and 1.2 mm MgSO4 supplemented with 5 mm d-glucose) and equilibrated in uptake buffer for 30 min before starting the assay. For assays determining concentration-dependent uptake, the specific activity of the substrate was diluted to cover a concentration range of 0.15 (carrier-free [3H]5HT, specific activity ≈50 cpm/fmol) to 30 μm (≈250 cpm/pmol). After incubation for 1 min at room temperature in 0.1 ml, cells were washed in ice-cold uptake buffer, and the remaining radioactivity was determined by liquid scintillation counting. The inhibitory potency of MFZ2-12 or MFZ2-12-PEG-NHS was determined in the presence of 0.15 μm [3H]5HT; with increasing concentrations of MFZ2-12 or MFZ2-12-PEG-NHS.
Atomic Force Microscopy
All measurements were carried out in HEPES buffer at room temperature by using a PicoPlus 5500 AFM setup (Agilent Technologies, Chandler, AZ). Topographical and deflection images of cells were acquired with contact mode AFM with non-functionalized AFM cantilevers of 0.01 N/m nominal spring constants. Force distance cycles were performed on cell surfaces of living CHO-K1 cells at room temperature with the assistance of an inverted microscope (Zeiss Axiovert 200) for localization of the AFM cantilever on isolated cells. The MFZ-AFM tips had a nominal spring constant of 0.01–0.03 N/m. At a fixed lateral position, the modified cantilever approached (trace) the cell surface and subsequently retracted (retrace). The deflection (Δz) of the cantilever from which the force can be directly calculated according to Hook's law (f = kΔz, with k being the cantilever spring constant) was monitored permanently and plotted versus the tip-surface separation (i.e. distance). Upon trace, the cantilever bending remained zero. When the MFZ-AFM tip has bound to a SERT on the surface, an attractive force developed upon withdrawal causing the cantilever to bend downwards. At a critical force, the unbinding force (fu), the MFZ-AFM tip was detached from SERT, and the cantilever jumped back to its neutral position.
Dynamic force spectroscopy measurements were performed by varying the loading rate r (r is the product of the pulling velocity (v) times the effective spring constant keff). For that purpose, the sweep range was set between 4000 to 6000 nm with a sweep rate of 0.25 to 1 Hz, resulting in loading rates from 10 to 4000 pN/s. Typically, up to 1000 force-distance cycles were performed for one cantilever at a particular loading rate. The spring constants were determined using the thermal noise method (39). Specificity was also determined by blocking SERT with different compounds (MFZ2-12, cocaine, and citalopram). For these blocking experiments, the following stock solutions of the SERT ligands were used: 3 mm citalopram in water, 20 mm cocaine in water, and 20 mm MFZ2-12 in dimethyl sulfoxide. 10 μl of citalopram or cocaine or 5 μl of MFZ2-12 was added to the bath solution (2 ml) and incubated for 30 min to block SERT on the surface.
Force Data Analysis
From force curves showing unbinding events the unbinding force Fi and effective spring constant (slope at rupture) were determined (40). The loading rate ri of every individual curve was calculated by multiplying the previously determined effective spring constant with the pulling speed. The kinetic off-rate constant koff and the distance of the energy barrier form the free equilibrium position xβ was determined using a maximum likelihood approach. For this, the negative log likelihood nll was minimized by varying koff and xβ: nll = −Σt log p(koff, xβ; Ft, rt) with p being defined in the model (27) underlying Equation 1. To increase robustness, the worst five percent of data points were discarded and refitted three times.
For kinetic on-rate analysis, the binding probability P (i.e. fraction of curves showing binding events) at a certain pulling speed and the dwell time t (time the tip is in contact with the surface) were extracted. Those data were fitted against p = A(1 − exp(−(t − t0)/τ)) using a non-linear least-squares procedure, resulting in estimations for A, t0, and τ.
RESULTS
AFM Tip Functionalization with MFZ2-12
For the generation of single molecule AFM force spectroscopy sensors, the sensing molecule MFZ2-12 was covalently attached to the AFM tip through PEG chains. This approach was chosen because of their flexible nature, which supports the detection of unconstrained molecular recognition (26). The surface density of the ligands on the AFM tip was adjusted such that single molecular detection becomes highly probable (∼30% probability) (41). Fig. 1 shows a sketch of the stepwise protocol developed for the covalent binding of MFZ2-12 onto amino-functionalized tips. In brief, amino groups on the silicon nitride tip were first introduced using the APTES gas phase method (35, 42). Then, the heterobifunctional cross-linker maleimide-PEG27-NHS was linked to the AFM tip, resulting in the acylation of surface-linked APTES by the NHS group. MFZ2-12 was first derivatized with SPDP to introduce a group that is reactive to maleimides (Fig. 1) (36); the resulting intermediate subsequently was coupled to the AFM tip via maleimide-PEG27-NHS (41, 43).
Affinity of Derivatized MFZ2-12 for SERT
CHO-K1 cells were stably transfected with a plasmid encoding the wild type human SERT (CHO-SERT): initial uptake rates were measured over a concentration range of 0.2 to 30 μm to estimate a Vmax value of 48.6 ± 1.4 pmol·min−1·10−6 cells and a Km value of 2.0 ± 0.2 μm (mean ± S.E. of three independent determinations). Uptake of [3H]5HT was inhibited by MFZ2-12 with an IC50 value of 5.26 ± 1.5 nm (closed squares in Fig. 2). The addition of the linker moiety affected the affinity of the resulting PEGylated MFZ2-12-NHS. This was the case: its concentration-response curve was shifted to the right by ∼80-fold reduced, resulting in an IC50 value of 395.8 ± 15.4 nm (triangles in Fig. 2).
FIGURE 2.

Uptake inhibition experiments comparing MFZ2-12 and a PEGylated form thereof. CHOK1 cells stably expressing SERT were distributed in 48-well plates (5 × 10⁵ cells). The cells were preincubated in Krebs-Ringer-HEPES buffer (0.1 ml) containing either MFZ2-12 or PEG-MFZ2-12 in the concentrations (conc) indicated. After 5 min, [3H]5HT (150 nm) was added, and uptake was allowed for 1 min at room temperature. Uptake was terminated by removing the buffer and washing the cells with ice-cold buffer, and radioactivity was determined by liquid scintillation counting. Data are means ± S.E. of four independent experiments that were carried out in triplicate. Specific uptake in the absence of any inhibitor was 52.1 ± 1.4 pmol·106 cells·min−1 and was set 100% to normalize interassay variations. Nonspecific uptake in the presence of 10 μm paroxetine was <10% of total uptake and subtracted. The solid lines were generated by fitting the data points by non-linear least squares to an equation for the inhibition at a single class of binding sites according to the law of mass action. The estimated IC50 value were 5.26 ± 1.5 nm and 395.8 ± 15.4 nm for MFZ2-12 and its PEG-modified version, respectively.
Surface Morphology of CHO-K1 Cells
AFM affords imaging of living cells in a non-destructive manner. Monolayers of living CHOK1 cells were grown on ibidi μ-slides and imaged by contact mode AFM in buffer solution. A typical large-scale height image (Fig. 3A, presented in two-dimensional mode here) of such a cell shows that they were ∼30–40 μm in diameter with a characteristic zone (bright area) corresponding to the nuclear region appearing ∼3 μm in height (see also height cross-section, Fig. 3C). From the simultaneously obtained error image (Fig. 3B), some membrane details such as ripples and filaments became visible. Thus, the AFM images yielded structural details without observable distortions, verifying that these cells were stably bound to the surfaces and therefore suitable for force spectroscopy experiments. We also investigated HEK293 cells that expressed SERT. These cells were found to be less well suited because their membrane surface underwent larger excursions during AFM imaging (data not shown).
FIGURE 3.

AFM image of a living CHOK1 cell. Height image (A) and simultaneously recorded error image (B) shown in two dimensions. Height differences are shown in gray level (A, 0 to 4 μm; B, 0 to 2 nm). C, height cross-section taken from the middle of the height image (A). The CHOK1 cells stably expressing YFP-tagged hSERT were grown on ibidi μ-slides. Imaging was done as described under “Experimental Procedures.”
Single Molecule Binding Studies with Immobilized MFZ2-12
Binding of MFZ2-12 to SERT on the single molecular level was studied using AFM-based SMFS. For this purpose, force distance cycles were acquired by approaching an MFZ-AFM tip (Fig. 4A) to the surface of living CHO-K1 cells (Fig. 4B, gray line). This was followed by its retraction (Fig. 4B, black line). Therefore, the tip-sample interaction force was monitored simultaneously (Fig. 4B, y axis) as a function of the distance of the AFM tip from the cellular surface (Fig. 4B, x axis). The horizontal zero-force line in the right part of Fig. 4B corresponded to the region where no interaction force was transmitted to the tip because it was too far away from the cell surface. Upon approaching (Fig. 4B, gray line, from right to left), the tip contacted the cell (distance, 0 nm). This manifested itself in a contact force that increased in a quasi-linear manner (0 ∼ 170 pN, gray line), as the tip progressively indented the cell surface. During subsequent retraction (∼170 to 0 pN, black line, from left to right), the contact force relaxed. If the MFZ2-12 moiety on the AFM tip had engaged a SERT molecule on the cellular surface during the approach phase, the bond between MFZ2-12 and SERT became mechanically loaded as retraction continued. The loading force increased with in a nonlinear manner resulting in a parabolic relation. This is accounted for by the elastic extension of the distensible PEG cross-linker (black line, 0 to ∼450 nm) through which the MFZ2-12 molecule is connected to the AFM tip and, even more prominent, by the stretching of the highly elastic cellular membrane. Finally, the bond between MFZ2-12 and SERT was ruptured at a characteristic force. This unbinding force amounted to ∼50 pN. After unbinding, the tip immediately returned to the resting position (Fig. 4B black line, at ∼450 nm). The force trace shown contains the unique signature of a single molecule dissociation. Multiple ruptures (29) were observed rarely and not taken into account for further analysis. If cells were incubated in the presence of citalopram (shown in the inset to Fig. 4B) or other SERT-specific inhibitors (data not shown, see also below), the recordings only showed the contact force cycle: the traces were essentially devoid of unbinding events resulting in overlapping retraction (black line in the inset to Fig. 4B) and approach curves (black line). This was also the case when experiments were performed on non-transfected cells.
FIGURE 4.

Force spectroscopy of single MFZ2-12-SERT interactions. A, schematic rendering of the experimental approach. The AFM tip was functionalized with MFZ2-12, as outlined in Fig. 1. B, example of a force-distance cycle showing specific MFZ2-12-SERT unbinding. The CHOK1 cells stable expressing YFP-tagged hSERT were grown on ibidi μ-slides. The piezo movement in the approach-and-retraction cycles was ±2000 nm in 1 s, the force constant of the cantilever was 12.95 pN/nm. Unbinding occurred at a rupture force of 64 pN (inset in B). Shown is an example of a force-distance cycle performed in the presence of free citalopram (30 μm final concentration in HEPES buffer). C, probability density function (pdf) of the unbinding forces observed in 396 of 965 force-distance cycles (solid line, 40.9% binding probability). The intrinsic width of the distribution reflects the stochastic nature of the unbinding process.
The data shown in the inset to Fig. 4B document that the interaction forces that were recorded for MFZ2-12 and SERT were specific. The stochastic nature of the unbinding force (27) requires the analysis of many force-distance cycles. Accordingly, we monitored several hundred events under identical conditions and constructed a Gaussian of unitary area for each unbinding force value with the width representing its measuring uncertainty (mainly arising from the thermal vibrations of the AFM cantilever). All Gaussians from one experimental setting were accordingly positioned on a force axis. Their sum yielded an experimental probability density function of unbinding forces. These probability density functions represent the original data. Accordingly, they can be viewed as the equivalent of continuous histograms. We did not resort to any fittings. This approach offers the advantage that data accuracy is taken into account and that binning artifacts can be excluded. Hence, the probability density functions are more accurate than conventional histograms (26, 29). The probability density function in Fig. 4C (black curve) is an example for one data set of 965 recorded force curves; 396 thereof showed an unbinding force event yielding a binding probability of 40.9%. From the maximum and the width of the distribution, a most probable unbinding force of 46 ± 14 pN was derived. Addition of free citalopram inhibited the binding of the tip-bound MFZ2-12 moiety, and only 4 of 607 force-distance cycles showed apparent unbinding events: accordingly, the binding probability was decreased to 0.7%. This confirmed the specificity of the unbinding force events observed. Many similar datasets were collected to substantiate this conclusion on statistical grounds. In these measurements, SERT was blocked to with different compounds. The substrate concentrations were chosen such that saturating conditions were applied (44, 45), i.e. citalopram (30 μm), cocaine (200 μm), and MFZ2-12 (100 μm, see also Fig. 2). Blocking efficiencies were determined from many force experiments and, as expected, were comparable for citalopram (88%), cocaine (87%), and MFZ2-12 (85%) (Fig. 5).
FIGURE 5.

Comparison of different inhibiting agents for SERT. Force-distance cycles were recorded in the absence and presence of 30 μm citalopram, 200 μm cocaine, and 100 μm MFZ2-12, respectively. Shown are the percentage of these cycles that were associated with a fruitful interaction with the immobilized MFZ2-12.
Kinetic On-rate Binding Constant
The kinetic on-rate for binding of MFZ2-12 to SERT was investigated by varying the dwell time of the ligand over the cell. This allowed for determining the binding probability (Fig. 6). Longer contact times of the MFZ-AFM tip on the cellular surface resulted in a significant increase in the binding probability. Assuming that the ligand-transporter interaction can be approximated with first-order kinetics, an estimation of the kinetic on-rate constant kon from single molecule unbinding force measurements requires that the interaction time τ and the effective concentration ceff be determined for kon = (τ × ceff)−1 (29, 32, 46). The interaction time was calculated from the binding probability at different dwell times by using p = A(1 − exp(−(t − t0)/τ)), with t0 representing the lag time and with A representing the maximum achievable binding probability. A equals 1 if unbinding events are found in every force distance cycle (i.e. binding probability 1). A least-squares fit to the data shown in Fig. 6 yielded τ = 1 s. The effective concentration was estimated assuming that the molecule bound to the AFM tip can access a certain volume for free equilibrium interaction determined by the length of the tether. This volume was approximated by a sphere with radius reff, being the sum of the equilibrium tether length (4.5 nm) and the diameter of the MFZ2-12 (1 nm). Using those parameters, kon was estimated to be 410 m−1 s−1.
FIGURE 6.

Kinetic on-rate plot. Experiments were done as described in the legend to Fig. 4B. Force approach-and-retraction cycles were recorded of the indicated contact times, and the binding probability was determined from the number of fruitful interactions. This binding probability was plotted as a function of the contact time. The solid line is the result of a least-squares fit of a monoexponential rise.
Energy Landscape of MFZ2-12-SERT Interaction
A mechanical force that acts on a binding complex deforms the interaction energy landscape and lowers the activation barrier, similar to the effect of enzymes. Therefore, it is more likely to overcome the activation barrier and to reach the unbound state under an applied mechanical load. In SMFS, the force is ramped up at a certain speed until the complex dissociates (cf. Fig. 4B, retraction curve). When the rate of this ramp (loading rate r) is slower, the complex dissociates at lower forces and vice versa. This behavior can be most easily described with the so-called single energy barrier binding model (27). This model describes the probability p that the complex breaks at a certain force F (47),
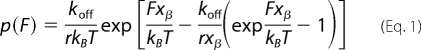 |
where koff is the kinetic off rate constant, xβ is the distance from the free-energy minimum to the barrier, and kBT is the thermal energy. The loading rate r is calculated from the retraction velocity v times the effective spring constant keff, where keff is the slope of the force distance curve at unbinding (i.e. r = v·keff). The effective spring constant keff is comprised of the linear spring constant of the AFM cantilever and of the non-linear spring constants of the PEG cross-linker and the cellular surfaces.
In previous force spectroscopy studies for every pulling velocity, experimental unbinding force distributions were calculated, and the maximum of the distribution was used for further analysis. This procedure assumes that the loading rate is constant for a fixed pulling velocity, i.e. keff does not vary significantly. In our case, keff showed a broad distribution (S.D./mean ≈ 50%; most likely caused by locally varying spring constants of the cell surfaces), which resulted in a convolution of the force rupture distribution with keff distribution and biased estimates for koff and xβ. Therefore, we determined the parameters koff and xβ using a maximum likelihood approach (cf. “Experimental Procedures”). Fig. 7 shows a scatter plot of the unbinding force as a function of the loading rate of all measured binding events. From those data, koff and xβ were determined to be 0.65 ± 0.02 s−1 and 2.88 ± 0.03 nm, respectively.
FIGURE 7.

Loading rate of unbinding force. From force curves showing unbinding events the unbinding force Fi was plotted versus the loading rate ri of every individual curve, with the latter being calculated by multiplying the effective spring constant with the pulling speed. The corresponding scatter plot thus shows the rupture force as a function of loading rate for all measured binding events (4624 events). From those data, koff and xβ were determined to be 0.65 ± 0.02 s−1 and 2.88 ± 0.03 nm, respectively. With the kinetic on-rate as determined above to 410.05 m−1 s−1, the dissociation constant KD = koff/kon was calculated to be 1.6 mm.
DISCUSSION
In this study, we showed that AFM single-molecule recognition force spectroscopy is a suitable method to obtain quantitative information on the binding of ligands to transporters on the surface of living cells. Our single-molecule approach offers several advantages: (i) single-molecule recordings provide dynamic and statistical information, for they assess all fluctuations of the system; this is often hidden in ensemble averaged results. (ii) Due to their unprecedented sensitivity and specificity, they allow probing low affinity interactions directly, which are difficult or impossible to capture with conventional methods. (iii) The distributions of interaction forces can be explored by conducting many sequential measurements. (iv) Finally, varying the dynamics of the experiment yields interaction energy landscapes and chemical rate constants.
We investigated the interaction of MFZ2-12 and the serotonin transporter with single-molecule resolution. These measurements were analyzed to reveal the interaction forces and the kinetic rate constants that govern the bond stability. For this purpose, MFZ2-12 was attached to the AFM tip via a flexible polyethylene glycol cross-linker; this allowed force measurements to be done on living cells under quasi-physiological conditions. The polyethylene glycol linker does not interact with or penetrate into the lipid membrane of living cells. Hence, the measured interaction solely reflected the binding of the MFZ2-12 molecule that was tethered to the tip of the cantilever and SERT. This was also verified by experiments in which the binding site was occupied by an excess concentration of the SERT ligands. As expected, the three compounds tested (citalopram, cocaine, MFZ2-12) effectively reduced the probability that the tip-tethered MFZ2-12 engaged SERT. We did not observe any appreciable difference between the three ligands, which is consistent with the fact that they block the same binding site and thus render the transporter unavailable for an interaction with tip-tethered MFZ2-12.
The force spectroscopy results obtained in this work allowed for extracting a kinetic off-rate for the dissociation of MFZ2-12 from SERT. This AFM-based koff derived from single-molecule experiments was estimated at 0.658 ± 0.024 s−1. The affinity of PEG-modified MFZ2-12 is too low to allow for measuring its affinity for SERT directly in radioligand binding experiments, which demonstrates the potential of our method with respect to sensitivity and specificity when compared with ensemble techniques. For comparison, an independent estimate of koff was taken from the concentration that inhibited uptake by 50% (IC50 = 395.8 ± 15.4 nm) under the following assumptions: (i) this IC50 value is comparable with the Ki (KD) value, because the concentration of [3H]5HT employed in the assay (0.15 μm) was far below its Km (1–2 μm). (ii) The kinetic on-rate for transporter inhibitors is similar for all inhibitors; this appears justified because two chemically different ligands, namely the cocaine-related compound β-[3H]carbomethoxy-3β-(4-iodophenyl)tropane and the tricyclic antidepressants have kon rates in the range of 5.8 × 10⁶ m−1 s−1 (48) and 5.6 × 10⁶ m−1 s−1 (15), respectively, when assayed under similar conditions. If we thus substituted the kon value determined for imipramine (i.e. 5.6 × 10⁶ m−1 s−1, 15) in the relation KD = koff/kon, we estimated koff for PEG-modified MFZ2-12 as 2.2 s−1. This value is in reasonable agreement with the koff estimate derived from the AFM experiment. In contrast, the value for the kon determined by single-molecule force spectroscopy (410 m−1s−1) was four orders of magnitude lower than the reported for imipramine or β-carbomethoxy-3β-(4-iodophenyl)tropane (5.6 − 5.8 × 10⁶ m−1 s−1).
This discrepancy can be rationalized as follows. (i) The critical parameter is the effective volume visited by the tip-tethered ligand (i.e. effective radius). The geometry of this volume and its size is essentially unknown; an estimate can be derived from the tether length. Thus, this uncertainty is a major source of error in determining the true kinetic on-rate value by single molecule force spectroscopy (29). (ii) The linker employed in the current study allows covering a distance of 9 nm, if the backbone is fully extended. This length was chosen because it should suffice to bridge the distance between the tip of the cantilever and the central substrate binding site (S1), which is thought to reside in the middle of the hydrophobic milieu of the bilayer, at a distance halfway between the extra- and intracellular aqueous phase (9, 10, 12). It is, however, clear that there is both a vestibular (S2) and a central (S1) binding site (13, 49). SERT inhibitors differ in their capacity to occupy the substrate binding site and the outer vestibule (9–13, 49). It is likely that the outer vestibule imposes a barrier on the entry of compounds into the substrate binding site. This may contribute to the fact that binding of inhibitors proceeds with a rate that is substantially slower than the diffusion controlled rate.
In addition, this entry pathway also contributes to selective recognition of a compound by the closely related transporters SERT, NET, and DAT. Molecular dynamics simulations of the β1- and β2-adrenergic receptors suggest that in these proteins the vestibule has major role in both the energetics of the binding reaction and in providing a selectivity filter (37). Our immobilization strategy should afford an experimental test of this hypothesis because the length of the spacer can be varied. It is for instance conceivable that if the length of the tether is reduced by half, this would allow us to probe the energy landscape within the vestibule. Because MFZ2-12 binds to SERT and DAT with different affinities (DAT, Ki 2.3 nm; SERT, Ki 12 nm (34)), it should be of interest to compare unbinding forces of MFZ2-12 immobilized by linkers of different length.
The many conformations in which LeuTAa has been crystallized (4–8) have inspired models for neurotransmitter transporters, and in particular, SERT (9, 10, 12). Molecular dynamics simulations generate testable hypotheses on the nature of the binding process, of substrate translocation and of the underlying movements within the protein. However, single molecules differ stochastically. This is exemplified by the plot in Fig. 7, which highlights the large variation in individual unbinding rates. This variability does not arise from the imprecision of the method, but it rather reflects the range of energy changes that individual transporters undergo when transiting the energy barrier from the bound to the unbound state. It is evident that this information is inaccessible to ensemble methods such as radioligand binding experiments because they can only provide average values. The energy landscape, however, is defined by the entropic and enthalpic changes experienced by individual molecules. This energy landscape defines the boundary conditions for molecular dynamics simulations. Thus, data that we acquired by single molecule force spectroscopy should provide a useful framework for exploring the molecular dynamics of transporter models because they provide an estimate for the range of forces and kinetic rate constants that operate during the binding reaction.
Acknowledgment
We are indebted to Professor Norbert Müller for use of NMR spectrometer facilities.
This work was supported by Austrian Science Fund Grant F35 and the National Institute on Drug Abuse-Intramural Research Program, NIH (to A. H. N. and M.-F. Z.).
- AFM
- atomic force microscopy
- SMFS
- single molecule force spectroscopy
- pN
- piconewtons
- SPDP
- N-succinimidyl 3-(2-pyridyldithio)propionate
- NHS
- N-hydroxysuccinimide
- hSET
- human serotonin transporters
- APTES
- 3-aminopropyltriethoxysilane.
REFERENCES
- 1. Kristensen A. S., Andersen J., Jørgensen T. N., Sørensen L., Eriksen J., Loland C. J., Strømgaard K., Gether U. (2011) Pharmacol. Rev. 63, 585–640 [DOI] [PubMed] [Google Scholar]
- 2. Sitte H. H., Freissmuth M. (2010) J. Neurochem. 112, 340–355 [DOI] [PMC free article] [PubMed] [Google Scholar]
- 3. Rudnick G. (2006) J. Membr. Biol. 213, 101–110 [DOI] [PubMed] [Google Scholar]
- 4. Yamashita A., Singh S. K., Kawate T., Jin Y., Gouaux E. (2005) Nature 437, 215–223 [DOI] [PubMed] [Google Scholar]
- 5. Singh S. K., Yamashita A., Gouaux E. (2007) Nature 448, 952–956 [DOI] [PubMed] [Google Scholar]
- 6. Zhou Z., Zhen J., Karpowich N. K., Goetz R. M., Law C. J., Reith M. E., Wang D. N. (2007) Science 317, 1390–1393 [DOI] [PMC free article] [PubMed] [Google Scholar]
- 7. Singh S. K., Piscitelli C. L., Yamashita A., Gouaux E. (2008) Science 322, 1655–1661 [DOI] [PMC free article] [PubMed] [Google Scholar]
- 8. Zhou Z., Zhen J., Karpowich N. K., Law C. J., Reith M. E., Wang D. N. (2009) Nat. Struct. Mol. Biol. 16, 652–657 [DOI] [PMC free article] [PubMed] [Google Scholar]
- 9. Beuming T., Shi L., Javitch J. A., Weinstein H. (2006) Mol. Pharmacol. 70, 1630–1642 [DOI] [PubMed] [Google Scholar]
- 10. Forrest L. R., Zhang Y. W., Jacobs M. T., Gesmonde J., Xie L., Honig B. H., Rudnick G. (2008) Proc. Natl. Acad. Sci. U.S.A. 105, 10338–10343 [DOI] [PMC free article] [PubMed] [Google Scholar]
- 11. Kaufmann K. W., Dawson E. S., Henry L. K., Field J. R., Blakely R. D., Meiler J. (2009) Proteins 74, 630–642 [DOI] [PMC free article] [PubMed] [Google Scholar]
- 12. Sinning S., Musgaard M., Jensen M., Severinsen K., Celik L., Koldsø H., Meyer T., Bols M., Jensen H. H., Schiøtt B., Wiborg O. (2010) J. Biol. Chem. 285, 8363–8374 [DOI] [PMC free article] [PubMed] [Google Scholar]
- 13. Sarker S., Weissensteiner R., Steiner I., Sitte H. H., Ecker G. F., Freissmuth M., Sucic S. (2010) Mol. Pharmacol. 78, 1026–1035 [DOI] [PMC free article] [PubMed] [Google Scholar]
- 14. Scanlon S. M., Williams D. C., Schloss P. (2001) Biochemistry 40, 10507–10513 [DOI] [PubMed] [Google Scholar]
- 15. Sucic S., Dallinger S., Zdrazil B., Weissensteiner R., Jørgensen T. N., Holy M., Kudlacek O., Seidel S., Cha J. H., Gether U., Newman A. H., Ecker G. F., Freissmuth M., Sitte H. H. (2010) J. Biol. Chem. 285, 10924–10938 [DOI] [PMC free article] [PubMed] [Google Scholar]
- 16. Quick M. W. (2003) Neuron 40, 537–549 [DOI] [PubMed] [Google Scholar]
- 17. El-Kasaby A., Just H., Malle E., Stolt-Bergner P. C., Sitte H. H., Freissmuth M., Kudlacek O. (2010) J. Biol. Chem. 285, 39201–39210 [DOI] [PMC free article] [PubMed] [Google Scholar]
- 18. Jacobs M. T., Zhang Y. W., Campbell S. D., Rudnick G. (2007) J. Biol. Chem. 282, 29441–29447 [DOI] [PubMed] [Google Scholar]
- 19. Schmid J. A., Scholze P., Kudlacek O., Freissmuth M., Singer E. A., Sitte H. H. (2001) J. Biol. Chem. 276, 3805–3810 [DOI] [PubMed] [Google Scholar]
- 20. Just H., Sitte H. H., Schmid J. A., Freissmuth M., Kudlacek O. (2004) J. Biol. Chem. 279, 6650–6657 [DOI] [PubMed] [Google Scholar]
- 21. Seidel S., Singer E. A., Just H., Farhan H., Scholze P., Kudlacek O., Holy M., Koppatz K., Krivanek P., Freissmuth M., Sitte H. H. (2005) Mol. Pharmacol. 67, 140–151 [DOI] [PubMed] [Google Scholar]
- 22. Binning T., Miller M. (1986) Clin. Podiatr. Med. Surg. 3, 769–780 [PubMed] [Google Scholar]
- 23. Müller D. J., Engel A. (2007) Nat. Protoc. 2, 2191–2197 [DOI] [PubMed] [Google Scholar]
- 24. Lee G. U., Chrisey L. A., Colton R. J. (1994) Science 266, 771–773 [DOI] [PubMed] [Google Scholar]
- 25. Florin E. L., Moy V. T., Gaub H. E. (1994) Science 264, 415–417 [DOI] [PubMed] [Google Scholar]
- 26. Hinterdorfer P., Baumgartner W., Gruber H. J., Schilcher K., Schindler H. (1996) Proc. Natl. Acad. Sci. U.S.A. 93, 3477–3481 [DOI] [PMC free article] [PubMed] [Google Scholar]
- 27. Evans E., Ritchie K. (1997) Biophys. J. 72, 1541–1555 [DOI] [PMC free article] [PubMed] [Google Scholar]
- 28. Evans E., Ritchie K. (1999) Biophys. J. 76, 2439–2447 [DOI] [PMC free article] [PubMed] [Google Scholar]
- 29. Baumgartner W., Hinterdorfer P., Ness W., Raab A., Vestweber D., Schindler H., Drenckhahn D. (2000) Proc. Natl. Acad. Sci. U.S.A. 97, 4005–4010 [DOI] [PMC free article] [PubMed] [Google Scholar]
- 30. Marshall B. T., Long M., Piper J. W., Yago T., McEver R. P., Zhu C. (2003) Nature 423, 190–193 [DOI] [PubMed] [Google Scholar]
- 31. Moy V. T., Florin E. L., Gaub H. E. (1994) Science 266, 257–259 [DOI] [PubMed] [Google Scholar]
- 32. Rankl C., Kienberger F., Wildling L., Wruss J., Gruber H. J., Blaas D., Hinterdorfer P. (2008) Proc. Natl. Acad. Sci. U.S.A. 105, 17778–17783 [DOI] [PMC free article] [PubMed] [Google Scholar]
- 33. Newman A. H., Zou M. F., Ferrer J. V., Javitch J. A. (2001) Bioorg. Med. Chem. Lett. 11, 1659–1661 [DOI] [PubMed] [Google Scholar]
- 34. Cha J. H., Zou M. F., Adkins E. M., Rasmussen S. G., Loland C. J., Schoenenberger B., Gether U., Newman A. H. (2005) J. Med. Chem. 48, 7513–7516 [DOI] [PubMed] [Google Scholar]
- 35. Ebner A., Hinterdorfer P., Gruber H. J. (2007) Ultramicroscopy 107, 922–927 [DOI] [PubMed] [Google Scholar]
- 36. Kamruzzahan A. S., Ebner A., Wildling L., Kienberger F., Riener C. K., Hahn C. D., Pollheimer P. D., Winklehner P., Hölzl M., Lackner B., Schörkl D. M., Hinterdorfer P., Gruber H. J. (2006) Bioconjug. Chem. 17, 1473–1481 [DOI] [PubMed] [Google Scholar]
- 37. Dror R. O., Pan A. C., Arlow D. H., Borhani D. W., Maragakis P., Shan Y., Xu H., Shaw D. E. (2011) Proc. Natl. Acad. Sci. U.S.A. 108, 13118–13123 [DOI] [PMC free article] [PubMed] [Google Scholar]
- 38. Hilber B., Scholze P., Dorostkar M. M., Sandtner W., Holy M., Boehm S., Singer E. A., Sitte H. H. (2005) Neuropharmacology 49, 811–819 [DOI] [PubMed] [Google Scholar]
- 39. Hutter J. L., Bechhoefer J. (1993) Rev. Sci. Instrum. 64, 1868–1873 [Google Scholar]
- 40. Rankl C., Kienberger F., Gruber H., Blaas D., Hinterdorfer P. (2007) Jap. J. Appl. Physics 46, 5536–5539 [Google Scholar]
- 41. Ebner A., Wildling L., Zhu R., Rankl C., Haselgrübler T., Hinterdorfer P., Gruber H. (2008) Functionalization of Probe Tips and Supports for Single-molecule Recognition Force Microscopy STM and AFM Studies on (Bio)molecular Systems: Unraveling the Nanoworld (Samorì P., ed) pp. 29–76, Springer Berlin/Heidelberg, Germany: [DOI] [PubMed] [Google Scholar]
- 42. Riener C. K., Stroh C. M., Ebner A., Klampfl C., Gall A. A., Romanin C., Lyubchenko Y. L., Hinterdorfer P., Gruber H. J. (2003) Anal. Chim. Acta 479, 59–75 [Google Scholar]
- 43. Riener C. K., Kienberger F., Hahn C. D., Buchinger G. M., Egwim I. O. C., Haselgrübler T., Ebner A., Romanin C., Klampfl C., Lackner B., Prinz H., Blaas D., Hinterdorfer P., Gruber H. J. (2003) Anal. Chim. Acta 497, 101–114 [Google Scholar]
- 44. Kuhar M. J., McGirr K. M., Hunter R. G., Lambert P. D., Garrett B. E., Carroll F. I. (1999) Drug Alcohol Depend. 56, 9–15 [DOI] [PubMed] [Google Scholar]
- 45. Scholze P., Zwach J., Kattinger A., Pifl C., Singer E. A., Sitte H. H. (2000) J. Pharmacol. Exp. Ther. 293, 870–878 [PubMed] [Google Scholar]
- 46. Rankl C., Wildling L., Neundlinger I., Kienberger F., Gruber H., Blaas D., Hinterdorfer P. (2011) Methods Mol. Biol. 736, 197–210 [DOI] [PubMed] [Google Scholar]
- 47. Izrailev S., Stepaniants S., Balsera M., Oono Y., Schulten K. (1997) Biophys. J. 72, 1568–1581 [DOI] [PMC free article] [PubMed] [Google Scholar]
- 48. Korkhov V. M., Holy M., Freissmuth M., Sitte H. H. (2006) J. Biol. Chem. 281, 13439–13448 [DOI] [PubMed] [Google Scholar]
- 49. Schmitt K. C., Mamidyala S., Biswas S., Dutta A. K., Reith M. E. (2010) J. Neurochem. 112, 1605–1618 [DOI] [PMC free article] [PubMed] [Google Scholar]