

Background: Leukemic cell differentiation is blocked in vivo but can be reversed in vitro.
Results: A new signaling sequence involving specific kinases and phospholipases along the path to cell differentiation.
Conclusion: PLD shortens the differentiation time of cells becoming mature neutrophils.
Significance: Achieving a shortened time is highly beneficial for the induction therapy of acute myelocytic leukemia patients.
Keywords: Cell Differentiation; Leukemia; Leukocyte; Myeloid Cell; Protein Kinases; Signal Transduction; Neutrophils, Macrophages; Cell Differentiation; Protein-Protein Binding; Tyrosine Kinase
Abstract
Cell differentiation is compromised in acute leukemias. We report that mammalian target of rapamycin (mTOR) and S6 kinase (S6K) are highly expressed in the undifferentiated promyelomonocytic leukemic HL-60 cell line, whereas PLD2 expression is minimal. The expression ratio of PLD2 to mTOR (or to S6K) is gradually inverted upon in vitro induction of differentiation toward the neutrophilic phenotype. We present three ways that profoundly affect the kinetics of differentiation as follows: (i) simultaneous overexpression of mTOR (or S6K), (ii) silencing of mTOR via dsRNA-mediated interference or inhibition with rapamycin, and (iii) PLD2 overexpression. The last two methods shortened the time required for differentiation. By determining how PLD2 participates in cell differentiation, we found that PLD2 interacts with and activates the oncogene Fes/Fps, a protein-tyrosine kinase known to be involved in myeloid cell development. Fes activity is elevated with PLD2 overexpression, phosphatidic acid or phosphatidylinositol bisphosphate. Co-immunoprecipitation indicates a close PLD2-Fes physical interaction that is negated by a Fes-R483K mutant that incapacitates its Src homology 2 domain. All these suggest for the first time the following mechanism: mTOR/S6K down-regulation → PLD2 overexpression → PLD2/Fes association → phosphatidic acid-led activation of Fes kinase → granulocytic differentiation. Differentiation shortening could have a clinical impact on reducing the time of return to normalcy of the white cell counts after chemotherapy in patients with acute promyelocytic leukemia.
Introduction
Differentiation of the promyelomonocytic leukemic cell line HL-60 along the granulocytic lineage is a complex mechanism. However, the study of the differentiation process of HL-60 cells has provided new insights in the molecular events associated with this process (1). HL-60 cells can be induced to differentiate in response to many stimuli, including DMSO, all-trans-retinoic acid, vitamin D, and others (2–7). Induction of differentiation with all-trans-retinoic acid is currently used in patients with acute promyelocytic leukemia, although some malignant cells become resistant and chemotherapy is often needed. During chemotherapy, there is always the risk of higher morbidity and infections due to the depressed number of white blood cells until the bone marrow returns to normalcy.
Several authors have implicated phospholipase D (PLD)2 as having a role in cell differentiation (3, 8–13), but the precise mechanism is far from understood. PLDs are phosphatidylcholine-specific phospholipases that catalyze the hydrolysis of this substrate to generate phosphatidic acid (PA) and choline (14). In mammals, at least two genes, named PLD1 and PLD2, encode for all splice variants of PLD1 and PLD2. PLD1 and its variants are highly regulated enzymes that are expressed in most tissues and cell lines, including HL-60 (12, 15). On the contrary, PLD2 is a constitutively active enzyme with a more restricted pattern of expression (16). Both PLD1 and PLD2 participate in regulated cellular secretion, cytoskeletal organization, gene expression regulation, cell cycle control, growth, proliferation, and differentiation (17). PA, the main enzymatic product of PLD, is the second messenger involved in most but not all of these actions (18). Phosphorylation of mTOR/S6K is important for survival, cell migration, growth, proliferation, and differentiation (14, 17, 19–21).
Differentiation of HL-60 cells correlates with increased phosphorylation of Akt (22) and p70S6K (23), both targets of PLD2 and/or mTOR (18, 24–28), as well as phosphorylation of the tuberous sclerosis protein 2 (TSC2, tuberin), the molecular and functional link between the PI3K/Akt pathway and mTOR function (29). Interestingly, the PI3K/Akt and mTOR/S6K pathways appear to be activated by feline sarcoma/Fujinami poultry sarcoma (Fes/Fps) (30, 31), a nonreceptor tyrosine kinase postulated to be an essential component of HL-60 cell differentiation (32–34).
Fes/Fps, a cytoplasmic protein-tyrosine kinase (35), was originally identified as an oncogene from feline retroviruses and as Src homology 2 (SH2) domain-containing protein expressed (36) predominantly but not exclusively in cells of the myeloid lineage (37–39), where it is proposed to have an essential role in regulating cell survival and terminal differentiation (40–43). Although Fes/Fps can be activated via tyrosine phosphorylation upon association with growth factor and cytokine receptors (43), the impact of PLD on Fes/Fps function is unknown. This is important as Fes/Fps activation has the potential to rescue differentiation of leukemic cells (32, 33).
Our results demonstrate the sequential interplay between mTOR/S6K/PLD2 in HL-60 cell differentiation. Furthermore, we have uncovered a new target of PLD2, Fes/Fps, the “effector” in terminal differentiation of leukemic cells and the mechanism involving the SH2 domain of Fes.
MATERIALS AND METHODS
HL-60 Cell Culture and Induction and Assessment of Differentiation
HL-60 cells were grown at 37 °C in a 5% CO2 incubator in RPMI 1640 medium supplemented with 10% (v/v) heat-inactivated fetal bovine serum, 2 mm l-glutamine, and 5 μg/ml gentamicin. Cells were induced to differentiate by incubation with 1.25% (v/v) DMSO for several days to achieve the neutrophilic phenotype. Viability assays were routinely conducted with 0.4% trypan blue stain in cell preparations prior to all analyses. Average counts were as follows: undifferentiated HL-60 = 2.3 × 10⁶ cells/ml (viability ∼96%); 4-day DMSO: differentiated HL-60 = 1.7.4 × 106 cells/ml (viability ∼94%). Aliquots were sampled daily and assessed for differentiation. In standard procedures with HL-60, at 72 h of DMSO incubation, ∼85% of the cells had matured to at least the myelocytic stage and had acquired the ability to release superoxide anion in response to bacterial extract challenge. To ascertain that DMSO produced the desired neutrophilic phenotype in HL-60 cells, cells were assayed as follows. (i) Flow cytometric analysis of surface expression of differentiation-related antigens was performed with fluorescein isothiocyanate (FITC)-conjugated monoclonal antibody against CD16b. (ii) Cytopreparations of nitro blue tetrazolium-treated preparations of cells were stimulated with 5 μl of nonviable bacterial extracts. Positive cells contained formazan deposits as dark, irregularly shaped crystal inclusions in the cytoplasm. (iii) For chemotaxis in Transwell, cells resuspended in chemotaxis buffer (Hanks' balanced salt solution + 1 mm CaCl2, 1 mm MgCl2, and 0.1% BSA) were placed on the upper chambers of 6.5-mm Transwell dishes (from Costar, Cambridge, MA) that are separated from the lower chambers by a 5-μm pore Nucleopore polycarbonate membrane.
Monocytic leukemia THP-1 cells were also used in this study. THP-1 cells were induced to differentiate into mature monocyte-macrophages after continued culture exposure to 50 ng/ml PMA. Mature cells (macrophages) became adherent to plastic surfaces and were CD14+/CD11b+. The number of adherent cells were counted under a microscope in five different and separate fields, and the average was reported.
S6K Assay
The phosphoacceptor peptide substrate for this assay was 75 mm of the S6 kinase substrate peptide KKRNRTLTK in freshly prepared kinase buffer (13.4 mm HEPES, pH 7.3, 25 mm MgCl2, 30 mm Na2VO3, 5 mm p-nitrophenyl phosphate, 2 mm EGTA, 2 mm cAMP-dependent kinase inhibitor TTYADFIASGRTGRRNAIHD, 0.420 μCi of [γ-32P]ATP (7 nm), and 68 mm unlabeled ATP). To initiate the phosphotransferase reaction, aliquots (20 ml) of kinase buffer containing the appropriate substrates were mixed 1:3 (v/v) with the cell lysates or immunocomplex beads. The reaction was carried out at 30 °C for 20 min and terminated by blotting 40 ml of the reaction mixture onto P81 ion exchange chromatography cellulose phosphate papers.
Immunoprecipitation and Western Blotting
Cell were washed in Hanks' balanced salt solution (to eliminate any potential autocrine cytokine production) and incubated with GM-CSF at 37 °C. Aliquots were spun down for 30 s at 7,000 × g, and pellets were resuspended in 200 μl of lysis buffer (12 mm Tris-HCl, pH 7.2, 0.75 mm NaCl, 100 μm sodium orthovanadate, 10 μm phenylmethylsulfonyl fluoride, 5 μg/ml each of aprotinin, pepstatin A, and leupeptin, and 0.12% Triton X-100) and sonicated on ice. Total cell lysates were centrifuged (14,000 × g, 2 min, 4 °C), and supernatants (∼1 μg/μl protein) were saved for immunoprecipitation and Western blotting.
Gene Expression Silencing and Nucleofection
Two different sets of silencing siRNAs (one each for a particular exon) from Ambion (Austin, TX) (“Silencer Pre-designed”) were used for mTOR exon 12, 5′-GCU CGU AAG UUG GGA UAA CAtt-3′, and exon 15, 5′-CAU UCG CAU UCA GUC CAU Att-3′. For S6K1, the following sequences were used: exon 2, 5′-GGA CAU GGC AGG AGU GUU Utt-3′, and exon 3, 5′-GGU UUU UCA AGU ACG AAA Att-3′. A negative control for siRNA was also from Ambion. Neg-siRNA2 is a 19-bp scrambled sequence with 3′-dT overhangs (sequence not disclosed by Ambion). The protocol for gene silencing involved first induction of differentiation of HL-60 cells with 1.5% DMSO on “day 0.” Then on “day 1,” cells were transfected with siRNA. To initiate the transfection, siRNA was mixed with OptiMEM and incubated at room temperature for 5 min. siRNAs were added to an Amaxa (Gaithersburg, MD) electroporation cuvette with 2 × 10⁶ HL-60 cells/100 μl in nucleofector solution V. Cells were nucleofected in program T-019 (as per the manufacturer's instructions) after which they were resuspended in 1 ml of Iscove's modified Eagle's medium + 20% FBS + 1.5% DMSO (to continue differentiation). Cells were immediately plated into 6-well plates and incubated at 37 °C for 48 h to allow for maximum gene expression silencing. Finally, on “day 4” the cells were harvested and used for the experiments described herein.
Real Time (Quantitative) RT-PCR (qRT-PCR)
Total RNA was isolated from HL-60 cells with the RNeasy minikit. RNA concentrations were determined by fluorometric assay with Fusion and Ribogreen RNA quantitation kit (Packard Instrument Co.), and samples were normalized to 20 ng/μl RNA. Reverse transcription coupled to qPCR was performed following published technical details (44).
In Vitro PLD Assay
Phospholipase D activity (transphosphatidylation) in cell sonicates was measured in liposomes of short chain PC, 1,2-dioctanoyl-sn-glycero-3-phosphocholine (PC8), and [3H]butanol (45). Approximately 50 μg of cell sonicates were added to microcentrifuge Eppendorf tubes containing the following assay mix (120 μl final volume): 3.5 mm PC8 phospholipid, 1 mm PIP2, 75 mm HEPES, pH 7.9, and 2.3 μCi (4 mm) of [3H]butanol. The mixture was incubated for 20 min at 30 °C, and the reaction was stopped by adding 300 μl of ice-cold chloroform/methanol (1:2) and 70 μl of 1% perchloric acid. Lipids were extracted and dried for thin layer chromatography (TLC). TLC lanes that migrated as authentic PBut were scraped, dissolved in 3 ml of Scintiverse II scintillation mixture, and counted. Background counts (boiled samples) were subtracted from experimental samples.
mTOR Enzyme Activity
Enzyme activity of mTOR was based on its ability to phosphorylate 4E-BP1 protein using radiolabeled [γ-32P]ATP (44). Cell lysates (0.8–1.2 μg/μl protein) were resuspended in kinase buffer (50 mm HEPES-KOH, pH 7.4, 100 mm KCl, 40% glycerol, 20 mm MgCl2, 8 mm MnCl2, 2 mm DTT), and the reactions were incubated with 4E-BP1 protein in the presence of 2 μCi of [γ-32P]ATP/μl and 100 μm ATP unlabeled ATP per reaction. Positive controls used COS7 cell lysates overexpressing fully active mTOR constructs (44). Negative controls had no peptide substrate in the reaction mixture. Incorporation of [γ-32P]ATP into 4E-BP1 was quantified by liquid scintillation.
Fes Kinase Activity
In the in vitro kinase assay, the phosphoacceptor peptide substrate was the Fes substrate peptide, poly(Glu4-Tyr) biotin-conjugated (Billerica, MA) in freshly prepared kinase buffer (8 mm MOPS, pH 7.2, 9 mm MgAc, 30 μm Na2VO3, 5 mm p-nitrophenyl phosphate, 1 mm EDTA, 2 μm cAMP-dependent kinase inhibitor TTY ADF IAS GRT GRR NAI HD, 0.420 μCi of [γ-32P]ATP (7 nm), and 100 μm unlabeled ATP). To initiate the phosphotransferase reaction, aliquots (20 μl) of kinase buffer containing the Fes substrate peptide were mixed 1:2 (v/v) with the cell lysates (∼20 μg of protein). The reaction was carried out at 37 °C for 20 min in a rotator and terminated by adding 5 μl of 3% phosphoric acid, and blotting 30 μl of the reaction mixture onto SAM-2 biotin capture membranes (Promega, Madison, WI). Membrane squares were extensively washed with methanol and water, dried, and counted for radioactivity. Positive controls used recombinant fully active Fes (Upstate, MA). Negative controls were run in parallel with no Fes substrate peptide.
Mutagenesis of Fes
A comparison between several SH2 domains yielded the following residues (underlined) that are conserved in the SH2 domain of Fes kinase with other known SH2 domains: 460WYHGAIPRAEVAELLVHSGDFLVRESQGKQEYVLSVLWDGLPRHFIIQSLD510. We concentrated on the Arg483 as an invariant arginine as most likely involved in binding to its target(s) and mutated it to lysine. Mutations were inserted following the QuickChange Site-directed mutagenesis protocol (Stratagene, La Jolla, CA). The sense oligonucleotide sequence was 5′-GGG GAC TTC CTG GTG AAG GAG AGC CAG GGC AAG-3′ and the antisense was 5′-CTT GCC CTG GCT CTC CTT CAC CAG GAA GTC CCC-3′ (underlines indicate a new restriction site, EcoNI; boldface indicates the targeted mutagenesis). All primers were PAGE/HPLC-purified (Integrated DNA Technologies, Coralville, IA).
Statistical Analysis
The difference between means has been assessed by the single factor analysis of variance test. Probability of less that 0.05 was considered to indicate a significant difference. Several p values are given in the figure legends.
RESULTS
PLD/mTOR/S6K Transcript Expression Pattern in Differentiating HL-60 Cells
Reverse transcription coupled to quantitative PCR was used to determine PLD1, PLD2, mTOR, and S6K transcript expression levels in HL-60 cells induced to differentiate in the presence of DMSO (day 0 to day 4). As shown in Fig. 1A, treatment of HL-60 cells with DMSO for several days results in differential expression patterns for PLD1, PLD2, S6K, and mTOR transcript. Both lipases (PLD1 and PLD2) are increasing expression, but PLD2 showed the biggest increase. Conversely, both kinases (mTOR and S6K), whose expression is high in undifferentiated cells, experienced decreased expression along with increased differentiation.
FIGURE 1.
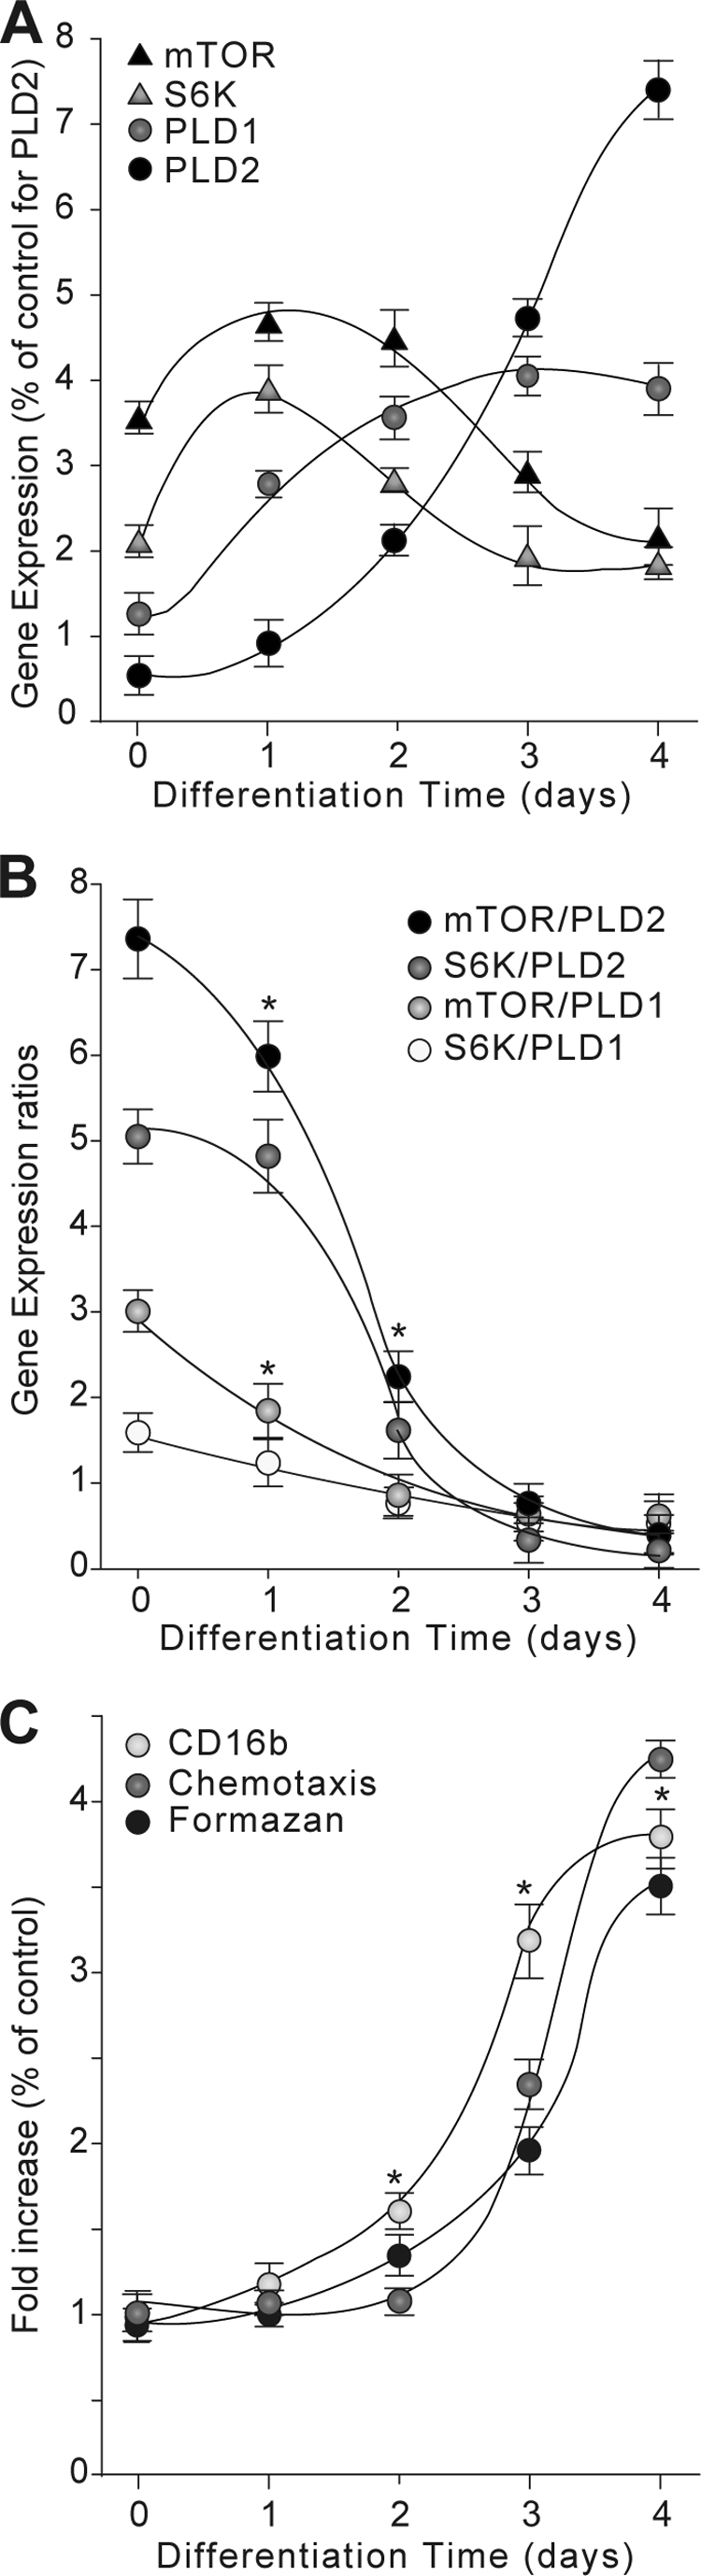
Kinetics of mRNA expression ratios of mTOR/PLD2-PLD1 and S6K/PLD2-PLD1 in HL-60 cells in response to DMSO. HL-60 cells in suspension were induced to differentiate in the presence of 1.25% DMSO for the indicated days. At each time point, total RNA was extracted from differentiated HL-60 cells, reverse-transcribed to cDNA, and probed with fluorescein amidite-tagged PLD1, PLD2, mTOR, or S6K primers. Gene fold expression was calculated from ΔCt as indicated under “Materials and Methods” (error bars are S.E. with n = 4 in duplicate). A, individual gene expression of PLD1, PLD2, mTOR, and S6K expressed as % of Control for PLD1. B, endogenous expression of PLD1, PLD2, mTOR, and S6K in the presence of DMSO as a function of time expressed as ratios mTOR/PLD2, mTOR/PLD1, S6K/PLD1, and S6K/PLD2. Asterisks denote statistically significant (p < 0.05) differences to controls (zero time) by analysis of variance. C, analysis of the differentiation potential of HL-60 cells in response to DMSO. Differentiation was assessed at the molecular level by determining expression kinetics of CD16b by flow cytometry as a function of time of DMSO exposure and at a functional level by determining cell migration in 6.5-mm Transwell plates and phagocytosis (formazan). Cells that migrated to the bottom wells after 90 min were counted. Results are the mean ± S.E. from four independent experiments conducted in duplicate.
Fig. 1B depicts the data of Fig. 1A expressed as ratios of kinase/phospholipase and indicates clearly an inverse correlation between expression of both groups. The basal expression ratios (i.e. at day 0) corresponding to mTOR/PLD2 and S6K/PLD2 were the highest (∼7 and ∼5, respectively). However, these expression ratios gradually decreased and were significantly changed in HL-60 cells after 4 days of DMSO treatment (i.e. differentiated HL-60 cells) to less than ∼0.5 in both cases.
A decrease in the expression ratios of mTOR-S6K/PLD2 in HL-60 cells treated with DMSO suggests an inverse relationship between mTOR and S6K expression and PLD2 mRNA levels during the differentiation process of these cells. The kinetics for the expression ratios involving PLD1 follows a similar pattern but were not as pronounced as the ones involving PLD2, suggesting that PLD1 mRNA expression may not be related to S6K expression levels and that mTOR may partially regulate PLD1 independently of S6K. At any rate, given the larger increase of PLD2 relative to PLD1 (Fig. 1, A and B), we decided to concentrate on PLD2 for the subsequent experiments.
To determine the functional significance of these results, we ascertained that HL-60 cells, growing in suspension, do differentiate toward the neutrophilic phenotype in response to DMSO. To this end, we determined expression levels of CD16b, a neutrophilic marker, as well as the phagocytic and chemotactic potentials of HL-60 cells before DMSO treatment (day 0) and at different time points post-DMSO (days 1–4). As shown in Fig. 1C, HL-60 cells incubated with DMSO for several days show gradual increase in CD16b mRNA expression levels, as expected (3). Increased CD16b transcript expression in HL-60 cells correlated with the phagocytic and chemotactic potential of these cells. Together, these results suggest that DMSO-induced differentiation of HL-60 cells toward the neutrophilic lineage results in specific expression patterns of mTOR, S6K, PLD1, and PLD2 and that the expression ratios mTOR/PLD2 are inversely related to the differentiation stage of the cells.
Molecular Silencing or Pharmacological Inhibition of mTOR Up-regulates PLD2 mRNA Expression in HL-60 Cells Committed to Differentiate
We have previously shown that molecular or pharmacological inhibition of mTOR results in higher expression levels of PLD2 transcripts, protein, and enzymatic activity in fully differentiated HL-60 cells (44). However, no information is available regarding the molecular and functional role of mTOR on PLD2 mRNA expression during the differentiation process of these cells. Because the expression ratio mTOR/PLD2 dramatically decreases whereas the HL-60 cells are committed to differentiate (Fig. 1A), we tested the hypothesis that mTOR keeps PLD2 expression initially repressed in HL-60 cells. Thus, PLD2 mRNA expression was followed daily in differentiating HL-60 cells where mTOR was either silenced or inhibited.
Fig. 2A shows that molecular silencing or pharmacological inhibition of mTOR results in a gradual increase in PLD2 mRNA levels when compared with the ones obtained in the absence of mTOR silencing (si-Control) or inhibition (Vehicle). This effect is also substantiated as observed using Western blot analysis of samples that were probed with monoclonal antibodies specific for PLD2, as shown in Fig. 2A, inset. As shown in Fig. 2B, total PLD enzymatic activity gradually increased in HL-60 cells where mTOR was silenced, and these levels were higher when compared with control cells (i.e. cells treated with scrambled siRNAs (si-Control)).
FIGURE 2.

mTOR-mediated regulation of PLD2 gene expression and enzymatic activity in differentiating HL-60 cells. HL-60 cells in suspension were transfected (time 0) with either scrambled siRNAs (si-Control) or siRNAs against mTOR (si-mTOR) or treated with 10 nm rapamycin or vehicle alone and immediately induced to differentiate by culturing them in fresh media in the presence of 1.25% DMSO. Total RNA for gene expression analysis by qRT-PCR or protein extracts for enzymatic activity assays in vitro was obtained at each time point, including at time 0. Results are the mean ± S.E. from three independent experiments conducted in duplicate. A, PLD2 transcript levels normalized with respect to time 0. The symbols * and # denote statistically significant (p < 0.05) differences (increases or decreases, respectively) between stimulated samples and controls, respectively. A, inset, Western blot (W.B.) of the effect of mTOR silencing on endogenous PLD2 expression as a function of increasing time. The top panel represents endogenous PLD2 protein levels using mouse anti-PLD2 monoclonal IgG antibody, and the bottom panel is the equal loading control that shows approximately equal amounts of protein in the lysates used for electrophoresis, as ascertained with rabbit anti-actin IgG antibodies. B, PLD lipase activity expressed as % of control (time 0) versus days of DMSO stimulation. C, mTOR mRNA expression levels normalized with respect to time 0. C, inset, Western blot of the effect of mTOR silencing on endogenous mTOR expression as a function of increasing time. The top panel represents endogenous mTOR protein levels using a rabbit anti-mTOR monoclonal IgG antibody, and the bottom panel is the equal loading control that shows approximately equal amounts of protein in the lysates used for electrophoresis, as ascertained with rabbit anti-actin monoclonal IgG antibodies. D, total mTOR kinase activity expressed as % of control (time 0) versus days of DMSO stimulation.
As expected, silencing of mTOR in HL-60 cells results in a gradual decrease of mTOR mRNA expression levels (Fig. 2C) and mTOR protein expression levels (Fig. 2C, inset), which correlated with decreased mTOR enzymatic activity (Fig. 2D), reaching a minimum 2 days after DMSO treatment. Transfection of HL-60 cells with si-Control did not result in reduced mTOR mRNA expression levels (Fig. 2C) or enzymatic activity (Fig. 2D). These results suggest that PLD2 mRNA up-regulation during the differentiation process (Fig. 1A) requires functional expression of mTOR; and as a corollary, high expression levels of mTOR and its enzymatic activity may keep PLD2 expression repressed in undifferentiated HL-60 cells.
Active mTOR and S6K Keep Low PLD2 mRNA Levels in Differentiating HL-60 Cells
To corroborate that functionally active mTOR keeps PLD2 mRNA expression down-regulated during the initial stages of the differentiation process of HL-60 cells, PLD2 mRNA expression was determined in these cells transfected with fully active (WT) or inactive (KD) mTOR constructs and subsequently treated with DMSO for 2 days. As shown in Fig. 3A, overexpression of mTOR-WT but not mTOR-KD resulted in down-regulation of PLD2 mRNA expression in HL-60 cells 2 days post-DMSO treatment despite similar levels of protein expression for both the mTOR-WT and mTOR-KD (Fig. 3B, top panel). As predicted, molecular silencing of mTOR (Fig. 3B, middle panel) was highly suppressed in differentiating cells and resulted in increased PLD2 transcript levels, an effect partially rescued by co-transfecting a fully active mTOR-WT construct (Fig. 3A). However, the latter effect could not be observed when an inactive mTOR-KD was co-transfected (Fig. 3A), suggesting that the enzymatic activity of mTOR participates in keeping PLD2 mRNA levels repressed during the initial stages of HL-60 differentiation in response to DMSO.
FIGURE 3.

mTOR overexpression rescues the action of mTOR silencing on PLD2 mRNA expression in differentiating HL-60 cells. HL-60 cells in suspension were transfected (time 0) with either siRNAs against mTOR (si-mTOR) or S6K (si-S6K), constructs encoding fully active mTOR (mTOR-WT), S6K (S6K-WT), or a kinase-dead mutant mTOR (mTOR-KD) alone or in combination with si-mTOR or si-S6K. Immediately after transfection, HL-60 cells were induced to differentiate in fresh media containing 1.25% DMSO. Total RNA for PLD2 mRNA quantification by qRT-PCR was obtained at each indicated time point. Results are the mean ± S.E. from three independent experiments conducted in duplicate. A, stimulatory effect of mTOR silencing on PLD2 mRNA levels; PLD2 transcript expression levels after 3 days of treatment with DMSO are expressed as % increase with respect to mock-transfected cells. B, Western blot (W.B.) of the effect of mTOR overexpression or silencing. The top and middle panels represent recombinant HA-tagged mTOR or endogenous mTOR protein levels, respectively, and the bottom panel is the equal loading control that shows approximately equal amount of protein in the lysates used for electrophoresis, as ascertained with rabbit anti-actin monoclonal IgG antibodies. C, stimulatory effect of S6K silencing on PLD2 mRNA levels. The asterisk denotes statistically significant (p < 0.05) differences between si-mTOR- or si-S6K-treated groups with respect to mock-transfected cells. D, Western blot of the effect of S6K overexpression or silencing. The top and middle panels represent recombinant Myc-tagged S6K or endogenous S6K protein levels, respectively, and the bottom panel is the equal loading control that shows approximately equal amounts of protein in the lysates used for electrophoresis, as ascertained with rabbit anti-actin monoclonal IgG antibodies.
In a similar fashion, overexpression of S6K (Fig. 3D, top panel), the downstream target of mTOR kinase activity, resulted in down-regulation of PLD2 transcript levels (Fig. 3C), whereas silencing of endogenous S6K expression (Fig. 3D, middle panel) in HL-60 cells resulted in increased PLD2 mRNA expression (Fig. 3C). Furthermore, co-expression of S6K and siRNAs against mTOR (si-mTOR) in these HL-60 cells resulted in partial recovery of the derepressor effects of mTOR when compared with cells co-expressing fully active mTOR constructs and siRNA against S6K (si-S6K) (Fig. 3, C and D). These results suggest that S6K cannot fully account for the inhibitory actions of mTOR on PLD2 mRNA expression.
Analysis of Promoter Region of the Human PLD2 Gene
The fact that mTOR and S6K are involved in the control of PLD2 mRNA expression of PLD2, likely at the transcriptional level, prompted the analysis of the promoter region of the human PLD2 gene (hPLD2, NT_010718). The 5′-flanking sequences upstream of the predicted transcription start site (TSS) (nucleotides −101 to −1,000 relative to the first coding A1TG codon) were analyzed in silico. As shown in Fig. 4, this promoter region presents the characteristics of a TATA-less promoter. The genomic region analyzed is heavy in GC content (>80%) and contains several GC-rich DNA sequence motifs or elements particularly in the region between the predicted core promoter and TSS. Indeed, a cluster of five GC-rich elements was found immediately upstream of the TSS, which was the farthest GC motif in this group of clusters and is also the activator/mediator/TBP-dependent core promoter element for RNA polymerase II-mediated transcription from TATA-less promoters (46). In addition, four consensus binding sites for Myc-associated zinc finger proteins (MAZ) (47) were found, three of them located in direct overlap with SP1-responsive elements (Fig. 4). The analysis also identifies an element for the Cys2–His2 (C2H2)-type zinc finger protein family member EGR-1 (a member of the early growth response gene family), the repressor element CDE (cell cycle-dependent element/cell cycle gene homology region) (48), and a consensus site for p53-mediated transcriptional regulation (49, 50), both located in the vicinity of the TSS. This analysis suggests that the hPLD2 is a constitutively expressed gene, but one that nevertheless may have the potential to be regulated by transcription factors known to be involved in HL-60 cell growth and differentiation (51–55).
FIGURE 4.

Analysis of promoter region of human PLD2 gene. Approximately 1.1 kb of distal genomic sequences corresponding to the human PLD2 gene upstream of the first coding exon ATG was analyzed in silico using the Genomatix software suite version 2.3. Depicted are the relevant sequences of the analysis corresponding to nucleotides 75–198. Each predicted element box is indicated as a forward arrow. The TSS is indicated as a dark arrowhead on top of the PLD2 mRNA (black right-truncated arrow).
PLD2 Overexpression Per Se Induces Differentiation of HL-60
It is known that PLD function and expression increases in HL-60 cells upon induction of differentiation in response to many different stimuli (2–7). However, the question remains as to whether PLD increases as a consequence of the differentiation process of HL-60 cells or HL-60 cells differentiate in response to increased PLD levels. The impact of PLD per se on HL-60 cell differentiation (i.e. in the absence of differentiating agent) was thus tested in these cells by overexpressing PLD2 constructs encoding fully active (PLD2-WT) (Fig. 5A, left panels) or inactive (PLD2-K758R) enzymes (Fig. 5A, right panels), whereas CD16b transcript expression is followed for 4 days. As shown in Fig. 5B, overexpression of PLD2-WT in HL-60 cells (in the absence of DMSO) resulted in increased CD16b mRNA expression levels when compared with mock-transfected HL-60 cells (DMSO-treated). The effect of PLD2 overexpression per se on HL-60 differentiation was not observed when these cells were transfected with the lipase-deficient PLD2-K758R.
FIGURE 5.

PLD2 overexpression induces and accelerates differentiation of HL-60 cells. HL-60 cells in suspension were mock-transfected (only transfection reagents and no vectors) or transfected with plasmids encoding for fully active or inactive PLD2 proteins (PLD2 WT or PLD2 K758R, respectively). Immediately after transfection, mock- and PLD2-transfected HL-60 cells were induced to differentiate in fresh media containing 1.25% DMSO. A, Western blot (W.B.) of the effect of recombinant PLD2-WT (left) and -K758R (right) overexpression as a function of increasing time. The top panel represents recombinant PLD2 protein levels using a mouse anti-Myc monoclonal IgG antibody; the middle panel represents total (endogenous + recombinant) PLD2 protein levels using a mouse anti-PLD2 monoclonal IgG antibody, and the bottom panel is the equal loading control that shows approximately equal amount of protein in the lysates used for electrophoresis as ascertained with rabbit anti-actin IgG antibodies. B, total RNA for CD16b transcript quantification by qRT-PCR was obtained at each indicated time point. Results are the mean ± S.E. from three independent experiments conducted in duplicate. CD16b transcript expression levels at each time point of treatment with DMSO are expressed as % increase with respect to transcript levels obtained at time 0. The symbols denote statistically significant (p < 0.05) differences between PLD2-WT, PLD2-K758R, si-PLD2, and mock-transfected cells. C, silencing of PLD2 protein expression following treatment with si-RNA specific for PLD2. The top panel represents endogenous PLD2 protein levels, respectively, and the bottom panel is the equal loading control that shows approximately equal amounts of protein in the lysates used for electrophoresis, as ascertained with rabbit anti-actin monoclonal IgG antibodies. D, transcript levels of PLD2, mTOR, and S6K in HL-60 cells transfected with PLD2 WT. Transcript expression levels after 4 days of treatment with DMSO are expressed as % increase with respect to mock-transfected cells.
To corroborate that the differentiating effects of PLD2 per se are not related to changes in mTOR/S6K expression, their transcripts levels were determined in HL-60 cells transfected with PLD2-WT and incubated for 2 days in the presence of DMSO. As shown in Fig. 5D, overexpression of PLD2-WT does not result in changes in mTOR or S6K mRNA expression beyond the ones presented in Fig. 1A. We show here that PLD2 plays a crucial role in the differentiation process, which is then abrogated in the presence of si-RNA specific for PLD2 (Fig. 5, B, open triangles, and C, Western blot of similar samples). These results indicate that overexpression of constitutively active PLD2 by itself but not a dead enzyme is able to provoke differentiation of HL-60 cells.
PLD2 Activates Fes
After demonstrating the effect of PLD2 overexpression on HL-60 cell differentiation, we wanted to ascertain what mechanism was involved. It has been established that Fes/Fps expression is necessary for HL-60 cells to differentiate (32–34). Undifferentiated HL-60 cells were mock-transfected or transfected with PLD2-WT and then induced to differentiate in response to DMSO. The effect of increasing concentrations of PLD2 plasmid DNA on PLD2 protein expression as a function of time was verified by Western blot analysis using antibodies directed against endogenous PLD2 (Fig. 6A, top panels). Total Fes protein expression and activation by phosphorylation were followed by Western blot using antibodies directed against Fes and Fes phosphorylated on tyrosine residues. As shown in Fig. 6A, expression of endogenous Fes gradually increases in mock-transfected HL-60 cells that were induced to differentiate with DMSO. Upon PLD2-WT transfection, however, HL-60 cells showed a marked increase in Fes protein expression as well as its phosphorylation (Fig. 6, days 1–4).
FIGURE 6.

PLD2 overexpression in differentiating HL-60 cells increases Fes expression and phosphorylation. HL-60 cells were nucleofected with constructs encoding for PLD2-WT or mock-transfected and immediately induced to differentiate in fresh media with 1.25% DMSO. A, protein expression and phosphorylation were ascertained in protein extracts obtained at days 1–4. Protein samples were subjected to SDS-PAGE and electroblotted. Membranes were developed by using antibodies directed against PLD2, Fes, or phosphorylated Fes on tyrosine residues (PY-Fes). To ensure equal loading, the same membranes were probed against α-actin. Sample size for each experiment was n = 3. B, densitometric analysis of Fes phosphorylation. The densitometric ratios for phospho-Fes/Fes/β-actin are plotted. Data are means ± S.E. AUs, arbitrary units.
To determine the significance of the PLD2-dependent increase in Fes protein and phosphorylation in HL-60 cells induced to differentiate in response to DMSO, total tyrosine kinase activity associated with Fes was determined in protein extracts of HL-60 cells either induced to differentiate (Fig. 7A) or overexpressing PLD2-WT (Fig. 7B). As shown in Fig. 7A, tyrosine kinase activity of Fes increases in differentiating HL-60 cells in response to DMSO, which is in agreement with previous work (34). However, PLD2-WT overexpression in HL-60 cells resulted in higher levels of Fes kinase activity when compared with DMSO-treated cells (Fig. 7B). This latter effect was not observed when cells were transfected with either of three different lipase-inactive mutants of PLD2 (K444R, K758R, and K444R/K758R (Fig. 7C)), even though protein expression of these PLD2 mutants was relatively similar to that of the wild type (Fig. 7D).
FIGURE 7.

Differentiation of HL-60 cells or PLD2 overexpression correlates with increased Fes kinase activity. A, HL-60 cells in suspension were induced to differentiate in fresh media containing 1.25% DMSO. Protein samples were obtained immediately after DMSO treatment (day 0) and each day post-induction of differentiation (days 1–4). Kinase assay results are the means ± S.E. from three independent experiments conducted in duplicate. Asterisks represent statistically significant (p < 0.05) differences between kinase activity values respective to day 0. B, effect of PLD2 overexpression in differentiating HL-60 cells on endogenous kinase activity associated with Fes. HL-60 cells growing in suspension were transfected with the indicated amounts of plasmid DNA encoding for fully active PLD2 and induced to differentiate in fresh media containing 1.25% DMSO. C, effect of lipase-dead mutants of PLD2 on Fes-associated kinase activity in differentiated HL-60 cells. Suspensions of HL-60 cells were nucleofected with 2.5 μg of plasmid DNA encoding for fully active PLD2 (WT) or lipase-inactive versions of PLD2 (K444R, K758R, and K444R/K758R) and induced to differentiate. Data are mean ± S.E.; asterisks represent statistically significant (p < 0.05) differences between kinase activity values respective to the values obtained in nontransfected HL-60 cells. D, Western blot (W.B.) of the effect of PLD2 overexpression. The top and middle panels represent recombinant Myc-tagged PLD2 or endogenous PLD2 protein levels, respectively, and the bottom panel is the equal loading control that shows approximately equal amounts of protein in the lysates used for electrophoresis, as ascertained with rabbit anti-actin monoclonal IgG antibodies.
Taken together, these results support the hypothesis that it is the lipase activity of PLD2 (i.e. the production of PA) that activates Fes in HL-60 cells and commits the cells to differentiation. To confirm this, HL-60 cells growing in suspension were incubated with varying concentrations of PA, PIP2, or PC, and tyrosine kinase activity associated with Fes was determined after 20 min. As shown in Fig. 8A, PA and PIP2 (although to a lesser extent) but not PC increased Fes kinase activity in HL-60 cells. Similar results were obtained when using HL-60 cell lysates instead of cells in culture (Fig. 8B), thus minimizing the possibility of an indirect effect of PA on Fes kinase activity. Together, these results suggest that PA, the main product of PLD2, is involved in the activation of Fes tyrosine kinase.
FIGURE 8.

PA and PIP2 but not PC activate Fes kinase activity. A, HL-60 cells growing in suspension were incubated with the indicated concentration of dioleoylphosphatidic acid (Do-PA), phosphatidylinositol 4–5-bisphosphate (PIP2), or dioleoylphosphatidylcholine (Do-PC) for 20 min. After incubation, cell lysates were obtained and 20 μg were analyzed for kinase activity associated with Fes. B, in vitro activation of Fes kinase activity. Protein extracts of untreated HL-60 cells were obtained and 20 μg were assayed for the ability of dioleoylphosphatidic acid, PIP2, or dioleoylphosphatidylcholine to activate Fes-associated tyrosine kinase activity directly added to the kinase reaction media at the indicated concentrations. C, effect of PLD2 overexpression in differentiating THP-1 cells associated with Fes. THP-1 cells in suspension were mock-transfected or transfected with 2 μg of PLD2-WT plasmid DNA, 300 nm si-Fes, or both and were then induced to differentiate in fresh media containing 50 ng/ml PMA. Differentiated (adhered) cells were immediately fixed in 24-well plates after PMA treatment (time 0) and at varying times post-induction of differentiation (12–72 h). Adhesion assay results are the means ± S.E. from three independent experiments conducted in duplicate. The symbols * and # denote statistically significant (p < 0.05) differences between PLD2 overexpression or silenced samples and controls, respectively.
Although the experiments presented in this study use HL-60 cells, the mechanism as originally stated can be translated to other leukemic cell lines. As shown in Fig. 8C, we have included data from differentiated THP-1 cells, a human acute monocytic leukemia derived from peripheral blood (56). Differentiation of these cells using PMA yields a morphological change in phenotype from that of an immature monocyte to that of a macrophage, which additionally results in increased adhesion to cell culture plasticware surfaces (Fig. 8C). As differentiation of THP-1 cells (that were CD14+/CD11b+) can be correlated as a function of cell adhesion, we document that THP-1 differentiation is augmented in the presence of PLD2 overexpression as shown by the significant increase in adhesion (Fig. 8C). However, this positive effect on differentiation can be reversed in the presence of si-RNA specific for Fes, as shown by the significant decreases in adhesion, which confirms what was observed earlier for neutrophil-like HL-60 cells. Thus, Fes knockdown prevents PLD2-driven differentiation.
Molecular Association between Fes and PLD2
Fes is an SH2-containing tyrosine kinase protein (36), and this domain enhances catalytic activity and substrate recognition (57), which is probably related to its close proximity to the catalytic site of the kinase (Fig. 9A). Phosphorylation of PLD2 at specific tyrosine residues results in docking of SH2-containing proteins (58) and SH2-mediated interaction of Fes in pYEX(V/I) targets (36). Hence, we tested the hypothesis that PLD2 and Fes physically interact.
FIGURE 9.

PLD2 interacts with Fes in vivo. A, schematic drawings of human Fes (NP_001996, top) and PLD2 (NP_002654, bottom) proteins to show the predicted motifs (F-BAR and FX (a module that recognizes positive membrane curvature), SH2 (Src homology domain 2 recognizes phosphotyrosine residues with an invariant arginine) and kinase Tyr (the putative tyrosine kinase domain)). PLD2 protein drawing shows its classic domains, PH (pleckstrin homology domain), PX (phosphoinositide-binding domain, p40phox/p47phox-homology domain), and HKD1 and HKD2 (the two catalytic sites of PLD2). B and C, cells were transiently transfected with plasmids encoding for Myc-tagged PLD2 (myc-PLD2), human Fes (WT (B) or SH2-compromised R483K (C)) alone or in combination. Two days post-transfection, protein lysates were obtained and immunoprecipitated (I.P.) with anti-human Fes or anti-Myc antibodies. Immunoprecipitates were separated by SDS-PAGE and immunoblotted with anti-Myc antibodies or anti-Fes, respectively. W.B., Western blot.
Positive results were demonstrated in co-immunoprecipitation analyses. As shown in Fig. 9B, Fes could be immunologically detected (or “pulled down”) in cell lysates immunoprecipitated with antibodies directed against Myc-tagged PLD2 (3rd row, right lane). The 1st and 2nd rows of Fig. 9B are positive controls showing robust expressions of PLD2 and Fes, respectively; the 4th row of Fig. 9B is a control for equal protein loading. We also performed immunoprecipitation with a Fes-R483K mutant that incapacitated the SH2 binding domain by targeting this invariant arginine. Fig. 9C shows that no Fes could be pulled down with anti-Myc antibodies when cells were overexpressing Fes-R483K, pointing at the key role of the SH2 domain in a Fes-PLD2 interaction. Taken together, these results suggest that PLD2 and Fes might be physically associated, which could be beneficial for a quick transduction of the activating signal within the cell.
DISCUSSION
HL-60, a human cell line derived from acute promyelocytic leukemia, differentiates toward the neutrophilic lineage in response to many stimuli in vitro (2–7). This potential has made HL-60 cells an excellent model in which to study human myeloid cell differentiation (59). Cell differentiation is a tightly controlled phenomenon where modification in the pattern of gene expression determines the final phenotype of the differentiated cell.
HL-60 cells can be differentiated to neutrophil-like cells in ∼4–5 days by stimulating the cells with 1.25% DMSO in the culture medium (60) with expression of markers (like CD16b), whereas the cells also gain the ability to produce a respiratory burst (formazan formation) (61). Our results show that PLD1, PLD2, mTOR, and S6K mRNAs are differentially expressed in HL-60 cells committed to differentiate in response to DMSO (Fig. 1A). Under our experimental conditions, DMSO decreases mTOR and S6K transcript levels, whereas HL-60 cells differentiate and PLD2 mRNA expression increases. The expression kinetics of transcripts for PLD in HL-60 cells has been defined previously (3, 8–13). Furthermore, increased levels of PLD mRNAs in response to the differentiating agent DMSO in HL-60 correlated with increased protein levels and/or PLD activity (3).
These observations have defined a consensus picture where the common player in differentiating HL-60 cells is PLD2 up-regulation and activation. However, we have now added an extra layer of complexity to this picture as follows: expression of mTOR and its target, S6K, following a kinetic of expression that is the opposite of the one observed for PLD2 expression and uncovering an inverse relationship between mTOR/S6K and PLD2 mRNA levels during the differentiation process of HL-60 cells. This could be observed by determining the expression ratios of mTOR/PLD2 and S6K/PLD2. We have previously shown that the mTOR/S6K signaling cascade negatively regulates PLD2 expression at the transcript, protein, and catalytic levels in HL-60 (44). This concept finds additional support in the fact that in undifferentiated HL-60 cells, mTOR and S6K transcripts are maximally expressed, whereas PLD mRNA levels are minimal (Fig. 1A). However, upon induction of differentiation with DMSO, mTOR and S6K derepress PLD2.
It can be argued that the pattern of mTOR/S6K and PLD2 mRNA expression cannot be directly related in the experiments performed. However, the casual impact of mTOR/S6K on PLD2 mRNA expression is minimized by the fact that catalytically inactive versions of mTOR, silencing of mTOR, or pharmacological inhibition of mTOR with rapamycin cannot repress PLD2 mRNA expression in HL-60 cells committed to differentiate in response to DMSO. The expression ratio of mTOR/PLD2 decreases, and HL-60 cells are committed to differentiate. These results suggest that mTOR/S6K is functionally linked to PLD2 mRNA up-regulation during the differentiation process, thus explaining a high expression ratio of mTOR/S6K to PLD2 in undifferentiated HL-60 cells, whereas a decrease in these ratios is observed upon differentiation of these cells in response to DMSO.
Recent in silico studies have shown that 72% of human promoters are associated with CpG islands (62, 63). The human PLD2 gene promoter is not the exception, particularly at the vicinity of predicted or experimentally estimated TSS. Bioinformatic alignment of full-length human PLD2 cDNAs using MAFFT algorithm in Genious Pro Suite version 5.3.6 (Biomatters Ltd., New Zealand) suggest that the TSS of hPLD2 locates ∼100 bp upstream of the ATG (RefSeq NM_002663). We have analyzed the hPLD2 promoter region comprising nucleotides −100 to 1000 that is 1.1 kb of sequence upstream of the first coding codon ATG. Our results show that the PLD2 gene promoter is a TATA-less one, rich in CpG islands and with at least two core promoter sites located 362 and 77 bp upstream of the TSS. A similar promoter configuration has been described for the mouse PLD2 gene (64). Interestingly, the human version of the PLD2 gene promoter contains a cluster of GC-rich regions between the closest core promoter site and TSS. These elements are predicted to bind different general transcription factors, such as SP-1, MAZ, EGR-1, as well as factors related to cell cycle progression/regulation (e.g. p53).
The transcription factor MAZ is expressed in most, if not all, tissues (65, 66). MAZ and SP-1 are often found regulating identical genes often binding to the same promoter elements (47). Interestingly, immature WT HL-60 cells express minimal functional levels of SP-1, whereas differentiation correlated with increased functional levels of SP-1 (51, 55). Furthermore, it has been proposed that functional SP-1 may be required to maintain the differentiated state once the cells have been committed to this process via other factors (67). The presence of a perfect match for EGR-1 (5′-CGCCCCCGC-3′) overlapping the predicted core promoter of the human PLD2 gene is intriguing. EGR-1 recognizes and binds its responsive elements promoting transcriptional activation of target genes whose products are required for mitogenesis and differentiation (68). EGR-1 is rapidly induced after mitogenic stimulation of diverse cell types, including HL-60 (53). Interestingly, EGR-1 is absent in undifferentiated HL-60 cells. However, its functional activity increases in these cells after several days of treatment with DMSO, thus contributing to terminal HL-60 differentiation (52, 54).
It is known that EGR-1 and p53 interact to regulate gene expression (69). Furthermore, exogenous overexpression of p53 in HL-60 cells induces differentiation (70). Because the functional links between EGR-1/p53 and the mTOR/S6K signaling network have been established (71–73), these findings support the idea of a discrete network of transcription factors potentially involved in expression and regulation of PLD2 in an mTOR/S6K-dependent manner. It remains to be determined if EGR-1/p53 is/are directly required for mTOR/S6K-mediated induction of PLD2 gene expression in HL-60 cells induced to differentiate in response to DMSO.
The impact of S6K per se on PLD transcript expression is not clear. Contrary to expression ratios involving PLD2, no significant decrease in the S6K/PLD1 ratio was observed in HL-60 cells induced to differentiate in response to DMSO. However, the mTOR/PLD1 ratio gradually decreased in these cells treated with DMSO. These results suggest that PLD1 mRNA expression may be partially regulated by mTOR, although in an S6K-independent manner.
The positive impact of PLD2 overexpression per se on HL-60 cell differentiation is a new finding. Indeed, undifferentiated HL-60 cells transfected with catalytically active PLD2-WT required 3 days to fully express the differentiation marker CD16b. This was achieved in the absence of a differentiation agent (DMSO requires 4 days for the same effect). Interestingly, the CD16b expression pattern in HL-60 cells overexpressing a lipase-dead version of PLD2-K758R (58) or treated with DMSO was similar suggesting that catalytically active PLD2 is able to reproduce and boost the differentiating potential of HL-60 cells. The differentiating potential of PLD2-WT does not appear to be related to further down-regulation of either mTOR or S6K because overexpression of PLD2-WT does not result in changes in mTOR or S6K mRNA expression. These results indicate that overexpression of constitutively active PLD2 by itself is able to provoke and accelerate differentiation of HL-60 cells.
After unveiling the inverse correlation between mTOR/S6K, we next asked ourselves about the effector of PLD2 overexpression that could carry over the full differentiation of cells and closed in on the tyrosine kinase Fes. A connection between Fes/PLD2 in differentiation has not yet been described, only that of a Fes related kinase (Fer) in cell migration (74). Fes/Fps is involved in cell differentiation, involving PU.1 and other transcription factors (32–34). In this study, we have established for the first time a direct link between PLD2 lipase activity and Fes in cell differentiation. PLD2 overexpression in HL-60 cells resulted in a marked increase in Fes protein, as well as its phosphorylation, an index of its activation (75). Indeed, total Fes tyrosine kinase activity also increased in HL-60 cells overexpressing fully active PLD2 but not lipase-dead PLD2s (Fig. 6). Interestingly, human Fer tyrosine kinase (NP_005237) contains a PA-binding domain, which maps to discrete residues (Arg417, Arg425, and His426) within the central region of the protein (417RLSKFESIRH426) (58, 74).
The novel data in this study in regard to Fes is that not only PA is needed for Fes activation but PIP2 enhances its activity possibly indirectly through activation of PLD2 itself. Other novel data of this study are that PLD2 and Fes form a physical interaction, as the co-immunoprecipitation of Fig. 8 indicates. We went one step further and found that the SH2 domain in Fes is required for such interaction. We posit that a PLD2-Fes interaction occurs first and that once PA is produced by PLD2, this, too, serves to keep Fes activated.
Altogether, the results presented herein support the model illustrated in Fig. 10, whereby PLD2 via activation of Fes promotes HL-60 cell differentiation. In addition to the molecular deciphering of the mechanism followed by PLD2 during differentiation, the results presented in this study point at ways by which differentiation can be shortened. This could have an obvious clinical impact on reducing the time of return to normalcy of white cell counts after chemotherapy in patients with myelogenous leukemia that are resistant to induction of differentiation, as often occur in acute promyelomonocytic leukemia. Shortening the window of bone marrow recovery will lower the risk of higher morbidity and infections in the treatment of these leukemias.
FIGURE 10.

Model highlighting the biological significance of findings in this study. mTOR/S6K are highly expressed in undifferentiated cells and keep PLD2 levels at a minimum. Conversely, when levels of mTOR/S6K are low, PLD2 is de-repressed and PLD2 itself takes part in the drive to differentiation. A PLD2-led differentiation uses the Fes kinase pathway to mediate its effects, which is fully functional due to the stimulation of PA and positive feedback by PIP2. This is the first report that has established a sequential link between mTOR/S6K de-repression, PLD2 expression, and Fes activation as fundamental for myeloid differentiation. Understanding the molecular mechanism that drives (and even hastens) differentiation could have beneficial consequences for the treatment of patients with acute promyelocytic leukemias subjected to chemotherapy after differentiation induction.
Acknowledgment
We thank Qing Ye for her help with the THP-1 cells.
This work was supported, in whole or in part, by National Institutes of Health Grant HL056653 (to J. G.-C.). This work was also supported by Research Challenge 668372 (Ohio Board of Regents) (to J. G.-C.).
- PLD
- phospholipase D
- Fes
- feline sarcoma tyrosine kinase
- PA
- phosphatidic acid
- mTOR
- mammalian target of rapamycin
- S6K
- S6 kinase
- KD
- kinase-dead
- PIP2
- phosphatidylinositol bisphosphate
- PC
- phosphatidylcholine
- SH2
- Src homology 2
- TSS
- transcriptional start site
- PMA
- phorbol 12-myristate 13-acetate
- qRT
- quantitative RT.
REFERENCES
- 1. Collins S. J. (1987) Blood 70, 1233–1244 [PubMed] [Google Scholar]
- 2. Meyer P. A., Kleinschnitz C. (1990) Environ. Health Perspect. 88, 179–182 [DOI] [PMC free article] [PubMed] [Google Scholar]
- 3. Di Fulvio M., Gomez-Cambronero J. (2005) J. Leukocyte Biol. 77, 999–1007 [DOI] [PubMed] [Google Scholar]
- 4. Ryves W. J., Dimitrijevic S., Gordge P. C., Evans F. J. (1994) Carcinogenesis 15, 2501–2506 [DOI] [PubMed] [Google Scholar]
- 5. Matsuhisa T., Mori Y. (1995) Blood Cells Mol. Dis. 21, 42–48 [DOI] [PubMed] [Google Scholar]
- 6. Janick-Buckner D., Barua A. B., Olson J. A. (1991) FASEB J. 5, 320–325 [DOI] [PubMed] [Google Scholar]
- 7. Tsolmon S., Kurita Y., Yamada P., Shigemori H., Isoda H. (2009) Planta Med. 75, 49–54 [DOI] [PubMed] [Google Scholar]
- 8. Bechoua S., Daniel L. W. (2001) J. Biol. Chem. 276, 31752–31759 [DOI] [PubMed] [Google Scholar]
- 9. El Marjou M., Montalescot V., Buzyn A., Geny B. (2000) Leukemia 14, 2118–2127 [DOI] [PubMed] [Google Scholar]
- 10. Guillemain I., Exton J. H. (1998) Biochim. Biophys. Acta 1405, 161–170 [DOI] [PubMed] [Google Scholar]
- 11. Nakamura M., Nakashima S., Katagiri Y., Nozawa Y. (1998) J. Leukocyte Biol. 63, 781–789 [DOI] [PubMed] [Google Scholar]
- 12. Nakashima S., Ohguchi K., Frohman M. A., Nozawa Y. (1998) Biochim. Biophys. Acta 1389, 173–177 [DOI] [PubMed] [Google Scholar]
- 13. Ohguchi K., Nakashima S., Nozawa Y. (1999) Biochim. Biophys. Acta 1439, 215–227 [DOI] [PubMed] [Google Scholar]
- 14. McDermott M., Wakelam M. J., Morris A. J. (2004) Biochem. Cell Biol. 82, 225–253 [DOI] [PubMed] [Google Scholar]
- 15. Yoshimura S., Nakashima S., Ohguchi K., Sakai H., Shinoda J., Sakai N., Nozawa Y. (1996) Biochem. Biophys. Res. Commun. 225, 494–499 [DOI] [PubMed] [Google Scholar]
- 16. Meier K. E., Gibbs T. C., Knoepp S. M., Ella K. M. (1999) Biochim. Biophys. Acta 1439, 199–213 [DOI] [PubMed] [Google Scholar]
- 17. Foster D. A., Xu L. (2003) Mol. Cancer Res. 1, 789–800 [PubMed] [Google Scholar]
- 18. Foster D. A. (2009) Biochim. Biophys. Acta 1791, 949–955 [DOI] [PMC free article] [PubMed] [Google Scholar]
- 19. Knoepp S. M., Chahal M. S., Xie Y., Zhang Z., Brauner D. J., Hallman M. A., Robinson S. A., Han S., Imai M., Tomlinson S., Meier K. E. (2008) Mol. Pharmacol. 74, 574–584 [DOI] [PubMed] [Google Scholar]
- 20. Lee C. S., Kim K. L., Jang J. H., Choi Y. S., Suh P. G., Ryu S. H. (2009) Biochim. Biophys. Acta 1791, 862–868 [DOI] [PubMed] [Google Scholar]
- 21. Lehman N., Di Fulvio M., McCray N., Campos I., Tabatabaian F., Gomez-Cambronero J. (2006) Blood 108, 3564–3572 [DOI] [PMC free article] [PubMed] [Google Scholar]
- 22. Yamada O., Ozaki K., Nakatake M., Akiyama M., Kawauchi K., Matsuoka R. (2008) J. Leukocyte Biol. 83, 1240–1248 [DOI] [PubMed] [Google Scholar]
- 23. Bettoun D. J., Lu J., Khalifa B., Yee Y., Chin W. W., Nagpal S. (2004) J. Steroid Biochem. Mol. Biol. 89, 195–198 [DOI] [PubMed] [Google Scholar]
- 24. Di Fulvio M., Frondorf K., Gomez-Cambronero J. (2008) Cell. Signal. 20, 176–185 [DOI] [PMC free article] [PubMed] [Google Scholar]
- 25. Fang Y., Vilella-Bach M., Bachmann R., Flanigan A., Chen J. (2001) Science 294, 1942–1945 [DOI] [PubMed] [Google Scholar]
- 26. Lehman N., Ledford B., Di Fulvio M., Frondorf K., McPhail L. C., Gomez-Cambronero J. (2007) FASEB J. 21, 1075–1087 [DOI] [PubMed] [Google Scholar]
- 27. Dufner A., Thomas G. (1999) Exp. Cell Res. 253, 100–109 [DOI] [PubMed] [Google Scholar]
- 28. Wullschleger S., Loewith R., Hall M. N. (2006) Cell 124, 471–484 [DOI] [PubMed] [Google Scholar]
- 29. Ravitz M. J., Chen L., Lynch M., Schmidt E. V. (2007) Cancer Res. 67, 11209–11217 [DOI] [PMC free article] [PubMed] [Google Scholar]
- 30. Izuhara K., Feldman R. A., Greer P., Harada N. (1996) Blood 88, 3910–3918 [PubMed] [Google Scholar]
- 31. Voisset E., Lopez S., Dubreuil P., De Sepulveda P. (2007) Blood 110, 2593–2599 [DOI] [PubMed] [Google Scholar]
- 32. Manfredini R., Balestri R., Tagliafico E., Trevisan F., Pizzanelli M., Grande A., Barbieri D., Zucchini P., Citro G., Franceschi C., Ferrari S. (1997) Blood 89, 135–145 [PubMed] [Google Scholar]
- 33. Manfredini R., Grande A., Tagliafico E., Barbieri D., Zucchini P., Citro G., Zupi G., Franceschi C., Torelli U., Ferrari S. (1993) J. Exp. Med. 178, 381–389 [DOI] [PMC free article] [PubMed] [Google Scholar]
- 34. Smithgall T. E., Yu G., Glazer R. I. (1988) J. Biol. Chem. 263, 15050–15055 [PubMed] [Google Scholar]
- 35. Greer P. (2002) Nat. Rev. Mol. Cell Biol. 3, 278–289 [DOI] [PubMed] [Google Scholar]
- 36. Songyang Z., Shoelson S. E., McGlade J., Olivier P., Pawson T., Bustelo X. R., Barbacid M., Sabe H., Hanafusa H., Yi T., et al. (1994) Mol. Cell. Biol. 14, 2777–2785 [DOI] [PMC free article] [PubMed] [Google Scholar]
- 37. Feldman R. A., Gabrilove J. L., Tam J. P., Moore M. A., Hanafusa H. (1985) Proc. Natl. Acad. Sci. U.S.A. 82, 2379–2383 [DOI] [PMC free article] [PubMed] [Google Scholar]
- 38. MacDonald I., Levy J., Pawson T. (1985) Mol. Cell. Biol. 5, 2543–2551 [DOI] [PMC free article] [PubMed] [Google Scholar]
- 39. Haigh J., McVeigh J., Greer P. (1996) Cell Growth Differ. 7, 931–944 [PubMed] [Google Scholar]
- 40. Yu G., Smithgall T. E., Glazer R. I. (1989) J. Biol. Chem. 264, 10276–10281 [PubMed] [Google Scholar]
- 41. Hackenmiller R., Simon M. C. (2002) Dev. Biol. 245, 255–269 [DOI] [PubMed] [Google Scholar]
- 42. Kim J., Ogata Y., Feldman R. A. (2003) J. Biol. Chem. 278, 14978–14984 [DOI] [PubMed] [Google Scholar]
- 43. Yates K. E., Gasson J. C. (1996) Stem Cells 14, 117–123 [DOI] [PubMed] [Google Scholar]
- 44. Tabatabaian F., Dougherty K., Di Fulvio M., Gomez-Cambronero J. (2010) J. Biol. Chem. 285, 18991–19001 [DOI] [PMC free article] [PubMed] [Google Scholar]
- 45. Horn J. M., Lehman J. A., Alter G., Horwitz J., Gomez-Cambronero J. (2001) Biochim. Biophys. Acta 1530, 97–110 [DOI] [PubMed] [Google Scholar]
- 46. Weis L., Reinberg D. (1997) Mol. Cell. Biol. 17, 2973–2984 [DOI] [PMC free article] [PubMed] [Google Scholar]
- 47. Song J., Ugai H., Nakata-Tsutsui H., Kishikawa S., Suzuki E., Murata T., Yokoyama K. K. (2003) Int. J. Mol. Med. 11, 547–553 [PubMed] [Google Scholar]
- 48. Lange-zu Dohna C., Brandeis M., Berr F., Mössner J., Engeland K. (2000) FEBS Lett. 484, 77–81 [DOI] [PubMed] [Google Scholar]
- 49. el-Deiry W. S., Kern S. E., Pietenpol J. A., Kinzler K. W., Vogelstein B. (1992) Nat. Genet. 1, 45–49 [DOI] [PubMed] [Google Scholar]
- 50. Ho J., Benchimol S. (2003) Cell Death Differ. 10, 404–408 [DOI] [PubMed] [Google Scholar]
- 51. Borellini F., Aquino A., Josephs S. F., Glazer R. I. (1990) Mol. Cell. Biol. 10, 5541–5547 [DOI] [PMC free article] [PubMed] [Google Scholar]
- 52. Chen F., Wang Q., Wang X., Studzinski G. P. (2004) Cancer Res. 64, 5425–5433 [DOI] [PubMed] [Google Scholar]
- 53. Kharbanda S., Nakamura T., Stone R., Hass R., Bernstein S., Datta R., Sukhatme V. P., Kufe D. (1991) J. Clin. Invest. 88, 571–577 [DOI] [PMC free article] [PubMed] [Google Scholar]
- 54. Nguyen H. Q., Hoffman-Liebermann B., Liebermann D. A. (1993) Cell 72, 197–209 [DOI] [PubMed] [Google Scholar]
- 55. Rao J., Zhang F., Donnelly R. J., Spector N. L., Studzinski G. P. (1998) J. Cell. Physiol. 175, 121–128 [DOI] [PubMed] [Google Scholar]
- 56. Tsuchiya S., Kobayashi Y., Goto Y., Okumura H., Nakae S., Konno T., Tada K. (1982) Cancer Res. 42, 1530–1536 [PubMed] [Google Scholar]
- 57. Filippakopoulos P., Kofler M., Hantschel O., Gish G. D., Grebien F., Salah E., Neudecker P., Kay L. E., Turk B. E., Superti-Furga G., Pawson T., Knapp S. (2008) Cell 134, 793–803 [DOI] [PMC free article] [PubMed] [Google Scholar]
- 58. Di Fulvio M., Lehman N., Lin X., Lopez I., Gomez-Cambronero J. (2006) Oncogene 25, 3032–3040 [DOI] [PMC free article] [PubMed] [Google Scholar]
- 59. Birnie G. D. (1988) Br. J. Cancer Suppl. 9, 41–45 [PMC free article] [PubMed] [Google Scholar]
- 60. Maianski N. A., Geissler J., Srinivasula S. M., Alnemri E. S., Roos D., Kuijpers T. W. (2004) Cell Death Differ. 11, 143–153 [DOI] [PubMed] [Google Scholar]
- 61. van Raam B. J., Sluiter W., de Wit E., Roos D., Verhoeven A. J., Kuijpers T. W. (2008) PloS ONE 3, e2013. [DOI] [PMC free article] [PubMed] [Google Scholar]
- 62. Bajic V. B., Tan S. L., Christoffels A., Schönbach C., Lipovich L., Yang L., Hofmann O., Kruger A., Hide W., Kai C., Kawai J., Hume D. A., Carninci P., Hayashizaki Y. (2006) PLoS Genet. 2, e54. [DOI] [PMC free article] [PubMed] [Google Scholar]
- 63. Sandelin A., Carninci P., Lenhard B., Ponjavic J., Hayashizaki Y., Hume D. A. (2007) Nat. Rev. Genet. 8, 424–436 [DOI] [PubMed] [Google Scholar]
- 64. Redina O. E., Frohman M. A. (1998) Biochem. J. 331, 845–851 [DOI] [PMC free article] [PubMed] [Google Scholar]
- 65. Shmueli O., Horn-Saban S., Chalifa-Caspi V., Shmoish M., Ophir R., Benjamin-Rodrig H., Safran M., Domany E., Lancet D. (2003) C. R. Biol. 326, 1067–1072 [DOI] [PubMed] [Google Scholar]
- 66. Song J., Murakami H., Tsutsui H., Tang X., Matsumura M., Itakura K., Kanazawa I., Sun K., Yokoyama K. K. (1998) J. Biol. Chem. 273, 20603–20614 [DOI] [PubMed] [Google Scholar]
- 67. Marin M., Karis A., Visser P., Grosveld F., Philipsen S. (1997) Cell 89, 619–628 [DOI] [PubMed] [Google Scholar]
- 68. Boyle K. B., Hadaschik D., Virtue S., Cawthorn W. P., Ridley S. H., O'Rahilly S., Siddle K. (2009) Cell Death Differ. 16, 782–789 [DOI] [PMC free article] [PubMed] [Google Scholar]
- 69. Liu J., Grogan L., Nau M. M., Allegra C. J., Chu E., Wright J. J. (2001) Int. J. Oncol. 18, 863–870 [DOI] [PubMed] [Google Scholar]
- 70. Soddu S., Blandino G., Citro G., Scardigli R., Piaggio G., Ferber A., Calabretta B., Sacchi A. (1994) Blood 83, 2230–2237 [PubMed] [Google Scholar]
- 71. Abdel-Malak N. A., Mofarrahi M., Mayaki D., Khachigian L. M., Hussain S. N. (2009) Arterioscler. Thromb. Vasc. Biol. 29, 209–216 [DOI] [PubMed] [Google Scholar]
- 72. Horton L. E., Bushell M., Barth-Baus D., Tilleray V. J., Clemens M. J., Hensold J. O. (2002) Oncogene 21, 5325–5334 [DOI] [PubMed] [Google Scholar]
- 73. Sarker K. P., Lee K. Y. (2004) Oncogene 23, 6064–6070 [DOI] [PubMed] [Google Scholar]
- 74. Itoh T., Hasegawa J., Tsujita K., Kanaho Y., Takenawa T. (2009) Sci. Signal. 2, ra52. [DOI] [PubMed] [Google Scholar]
- 75. Jiang H., Foltenyi K., Kashiwada M., Donahue L., Vuong B., Hehn B., Rothman P. (2001) J. Immunol. 166, 2627–2634 [DOI] [PubMed] [Google Scholar]