Background: Mineralocorticoid aldosterone controls ENaC-mediated Na+ reabsorption in the distal nephron.
Results: Ang II stimulates production of reactive oxygen species to stimulate ENaC, and this effect is preserved when mineralocorticoids are high.
Conclusion: Ang II directly controls ENaC activity and expression in murine distal nephrons.
Significance: Ang II may have a specific role in regulation of sodium handling in the distal nephron during variations in dietary Na+ intake.
Keywords: ENaC, NADPH Oxidase, Reactive Oxygen Species (ROS), Renin-Angiotensin System, Sodium Transport, Renin-Angiotensin-Aldosterone System, Connecting Tubule, Cortical Collecting Duct, Sodium Reabsorption
Abstract
Dietary salt intake controls epithelial Na+ channel (ENaC)-mediated Na+ reabsorption in the distal nephron by affecting status of the renin-angiotensin-aldosterone system (RAAS). Whereas regulation of ENaC by aldosterone is generally accepted, little is known about whether other components of RAAS, such as angiotensin II (Ang II), have nonredundant to aldosterone-stimulatory actions on ENaC. We combined patch clamp electrophysiology and immunohistochemistry in freshly isolated split-opened distal nephrons of mice to determine the mechanism and molecular signaling pathway of Ang II regulation of ENaC. We found that Ang II acutely increases ENaC Po, whereas prolonged exposure to Ang II also induces translocation of α-ENaC toward the apical membrane in situ. Ang II actions on ENaC Po persist in the presence of saturated mineralocorticoid status. Moreover, aldosterone fails to stimulate ENaC acutely, suggesting that Ang II and aldosterone have different time frames of ENaC activation. AT1 but not AT2 receptors mediate Ang II actions on ENaC. Unlike its effect in vasculature, Ang II did not increase [Ca2+]i in split-opened distal nephrons as demonstrated using ratiometric Fura-2-based microscopy. However, application of Ang II to mpkCCDc14 cells resulted in generation of reactive oxygen species, as probed with fluorescent methods. Consistently, inhibiting NADPH oxidase with apocynin abolished Ang II-mediated increases in ENaC Po in murine distal nephron. Therefore, we concluded that Ang II directly regulates ENaC activity in the distal nephron, and this effect complements regulation of ENaC by aldosterone. We propose that stimulation of AT1 receptors with subsequent activation of NADPH oxidase signaling pathway mediates Ang II actions on ENaC.
Introduction
Since the seminal work of Guyton (1), it has been recognized that kidneys play central role in controlling circulating volume and consequently blood pressure by regulating the total amount of extracellular sodium via the pressure-natriuresis mechanism. The inability of the kidney to regulate tubular Na+ reabsorption properly leads to sodium imbalance and blood pressure abnormalities (2). Sodium reabsorption in the aldosterone-sensitive distal nephron (ASDN),3 which includes the connecting tubule and the cortical collecting duct (CCD), determines final concentration of Na+ excreted in urine (3–5). Activity of the epithelial Na+ channel (ENaC) accounts for electrogenic Na+ reabsorption at this segment (3, 4, 6, 7). Therefore, ENaC is critical for regulation of sodium balance and circulating volume (4, 7–10). The physiological importance of ENaC to regulation of blood pressure in humans is emphasized by inheritable forms of hypertension (Liddle syndrome) resulting from gain-of-function mutations of the channel (5, 9, 11–14). Loss-of-function mutations, in contrast, lead to salt wasting and low blood pressure (pseudohypoaldosteronism type I) (9, 13). ENaC-mediated Na+ reabsorption also provides the electrical driving force for K+ secretion mediated by the renal outer medullary K+ (ROMK) channel and the “big conductance” K+ channel (15).
ENaC activity in the ASDN is regulated by the renin-angiotensin-aldosterone system (RAAS) in response to variations in dietary Na+ intake with aldosterone being the primary ENaC activator (4, 6, 7). Elevations in circulating aldosterone levels increase α-ENaC expression and redistribution of β- and γ-ENaC from cytosol to the apical membrane (16, 17). Aldosterone secretion can be stimulated in response to volume depletion (dietary Na+ restriction) and hyperkalemia (elevated K+ intake). However, the functional consequences of these elevations are drastically different, leading to salt retention with little K+ wasting and kaliuresis with little Na+ retention, respectively (for review, see Ref. 18), causing the so-called “aldosterone paradox.” This leads to the hypothesis that other signaling components of RAAS, such as Ang II, may synergistically contribute to a greater ENaC activation in response to volume contraction. Indeed, correlating evidence suggests that Ang II can stimulate apical Na+ entry in perfused CCD of rabbits and rats (19). The exact mechanism and signaling pathway of this putative Ang II regulation of ENaC remain obscure. It is also unclear whether this regulation complements antinatriuretic actions of aldosterone on sodium transport in the distal nephron.
The physiological actions of Ang II are mediated by AT1 and AT2 receptors (AT1Rs and AT2Rs). Activation of AT1Rs promotes proliferation, vasoconstriction, antinatriuresis, and salt appetite (20). AT2Rs antagonize many of the biological effects of AT1Rs by causing vasodilation, apoptosis, and prostaglandin release (21). AT1 and AT2 receptors are expressed at both apical and basolateral sides in the ASDN cells, although AT2R expression is considerably lower (22–24). Stimulation of AT1Rs can activate a number of downstream signaling cascades, and many of these effects are highly cell-specific. In vasculature smooth muscle cells, AT1Rs are mainly coupled to Gq/11-PLC cascade leading to elevations in [Ca2+]i and muscle contraction (25). In addition, AT1R stimulation can also activate PI3K, affect arachidonic acid metabolism and promote the formation of reactive oxygen species (ROS) (26). However, little is known about signaling mechanisms that mediate antinatriuretic actions of Ang II in the ASDN.
In this study, we used patch-clamp electrophysiology, immunohistochemistry and ratiometric [Ca2+]i imaging in freshly isolated split-opened distal nephrons of mice to directly probe regulation of ENaC by Ang II. We found that Ang II increases ENaC activity, and this effect is independent of aldosterone status. Stimulation of AT1 receptors with subsequent generation of ROS via stimulation of NADPH oxidase mediates Ang II actions on ENaC. Overall, our results provide the first direct support to the idea that the Ang II cascade has its own specific role in stimulating ENaC-mediated sodium reabsorption in response to volume depletion and RAAS activation.
EXPERIMENTAL PROCEDURES
Reagents and Animals
All chemicals and materials were from Sigma, VWR (Radnor, PA), and Tocris (Ellisville, MO) unless noted otherwise and were of reagent grade. Animal use and welfare adhered to the National Institutes of Health Guide for the Care and Use of Laboratory Animals following a protocol reviewed and approved by the Institutional Laboratory Animal Care and Use Committee of the University of Texas Health Science Center at Houston. For experiments, male C57BL/6 mice (purchased from Charles River Laboratories, Wilmington, MA) 6–8 weeks old, were used. Animals were maintained on standard rodent regimen (PURINA 5001) and had free access to tap water. For some experiments, mice were injected with deoxycorticosterone acetate (DOCA) for 3 consecutive days (2.4 mg/injection per animal) prior to the experimentation as we have done previously (29).
Tissue Isolation
The procedure for isolation of the ASDNs containing the connecting tubule and the CCD suitable for electrophysiology and Ca2+-imaging has been described previously (27–29). Briefly, mice were sacrificed by CO2 administration followed by cervical dislocation; the kidneys were removed immediately. Kidneys were cut into thin slices (<1 mm) with slices placed into ice-cold physiologic saline solution buffered with HEPES (pH 7.4). The ASDN was identified as merging of the connecting tubule into CCD and was mechanically isolated from cortical sections of kidney slices by microdissection using watchmaker forceps under a stereomicroscope. Isolated ASDN was attached to a 5 × 5-mm coverglass coated with poly-l-lysine. A coverglass containing ASDN was placed in a perfusion chamber mounted on an inverted Nikon Eclipse Ti microscope and perfused with room temperature HEPES-buffered (pH 7.4) saline solution. ASDNs were split-opened with two sharpened micropipettes, controlled with different micromanipulators, to gain access to the apical membrane. The tubules were used within 1–2 h of isolation.
Electrophysiology
ENaC activity in principal cells was determined in cell-attached patches on the apical membrane made under voltage clamp conditions (−Vp = −60 mV) using standard procedures (28–30). Current recordings were made in a permanently perfused bath (1.5 ml/min). Drug application times are shown with bars on the top of representative single channel traces. Recording pipettes had resistances of 8–10 megohms. Typical bath and pipette solutions were: 150 mm NaCl, 5 mm KCl, 1 mm CaCl2, 2 mm MgCl2, 5 mm glucose, and 10 mm HEPES (pH 7.4); and 140 mm LiCl, 2 mm MgCl2 and 10 mm HEPES (pH 7.4), respectively. For each experimental condition, ASDNs from at least three different mice were assayed. Gap-free single-channel current data from gigaohm seals were acquired (and subsequently analyzed) with an Axopatch 200B (Axon Instruments) patch clamp amplifier interfaced via a Digidata 1440 (Axon Instruments) to a PC running the pClamp 10.2 suite of software (Axon Instruments). Currents were low pass-filtered at 100 Hz with an eight-pole Bessel filter (Warner Instruments.). Unitary current was determined, as normal, from all-point amplitude histograms fitted with single- or multi-Gaussian curves using the standard 50% threshold criterion to differentiate between events. Events were inspected visually prior to acceptance. ENaC activity was analyzed over a span of 60–120 s for each experimental condition after reaching a new steady state in response to a treatment. Channel activity, defined as NPo, was calculated using the following equation: NPo = (t1 + 2t2 + … +ntn), where N and Po are the number of ENaC in a patch and the mean open probability of these channels, respectively, and tn is the fractional open time spent at each of the observed current levels. Po was calculated by dividing NPo by the number of active channels within a patch as defined by all-point amplitude histograms. For calculating Po in paired experiments, N was fixed as the greatest number of active channels observed in control or experimental conditions. To estimate the mean open and closed times of ENaC in ASDN cells carefully from mice kept on standard rodent regimen, we performed dwell time analysis from 56 patch clamp recordings of ENaC activity containing one active channel. The mean open time was 585 ± 58 ms (n = 3,422), and the mean closed time was 2,775 ± 148 ms (n = 3,404). It is known that the number of channels in a patch can be underestimated when Po is low. To ensure that this was not the case for our experimental conditions, we used an analysis similar to that previously described (31) assuming the estimated open and closed times. From the analysis, we can reliably estimate the maximal number of ENaC in a patch (p < 0.05) with observing one visible channel for recording times 1–2 min (90 s average). To further assure reliable calculation of Po, we measured Po in patches containing five or fewer channels. Changes in ENaC NPo in response to a particular treatment in cell-attached experiments most likely reflect changes in Po because the effects were readily reversible, and we did not observe changes in the number of active states in the majority of recordings. However, the possible changes in ENaC numbers (N) due to trafficking, although improbable, should also be considered.
Immunohistochemistry
Split-opened tubules were fixed with 4% paraformaldehyde in PBS (pH 7.4) for 20 min at room temperature. After fixation, the samples were permeabilized by addition of 0.1% Triton X-100 in PBS for 5 min and washed in PBS three times for 5 min. Nonspecific staining was blocked with 10% normal goat serum (Jackson Immunoresearch) in PBS for 30 min at room temperature. After washing with PBS (three times for 5 min), the samples were incubated for 1.5 h at room temperature in the dark with the primary antibodies against α-ENaC subunit (1:1,000 dilution, generously granted by Mark Knepper's laboratory) dissolved in 1% normal goat serum + 0.1% Triton X-100 in PBS for 3 h at room temperature. Subsequently, samples were incubated for 3 h at room temperature in the dark with goat anti-rabbit IgG labeled with Alexa Fluor 488 (1:400 dilution; Invitrogen) in 1% normal goat serum + 0.1% Triton X-100 in PBS. After washing with PBS (three times for 5 min) the samples were stained with 4′,6-diamidino-2-phenylindole (DAPI) (300 nm concentration; Calbiochem) to visualize nuclei. Subsequently the samples were dehydrated and mounted with permanent mounting medium (Thermo Scientific). Labeled tubules were examined with an inverted Nikon Eclipse Ti fluorescent microscope using a 40× Plan-Fluor oil immersion (1.3 NA) objective. Samples were excited with 488 and 561 nm laser diodes and emission captured with a 16-bit Cool SNAP HQ2 camera (Photometrics) interfaced to a PC running NIS elements software. Three-dimensional stacks of split-opened ASDNs were generated from series of confocal plane images with 0.25-μm binning step.
[Ca2+]i Measurements
Intracellular calcium levels were measured in cells of the split-opened ASDNs using Fura-2 fluorescence ratiometric imaging as described previously (32, 33). Split-opened ASDNs were loaded with Fura-2 by incubation with 2 μm Fura-2/AM in a bath solution for 40 min at room temperature. Subsequently, the ASDNs were washed and incubated for an additional 10–15 min prior to experimentation. The ASDNs were then placed in an open top imaging study chamber (Warner RC-10) with a bottom coverslip viewing window and the chamber attached to the microscope stage of an InCa Imaging Work station (Intracellular Imaging). Cells were imaged with a 20× Nikon Super Fluor objective and regions of interest drawn for individual cells. The Fura-2 fluorescence intensity ratio was determined by excitation (an average for ∼300 ms) at 340 nm and 380 nm and calculating the ratio of the emission intensities at 511 nm in the usual manner every 5 s. We observed no significant Fura-2 bleaching and minimal Fura-2 leakage at both wavelengths during the experiments. The changes in the ratio were converted to intracellular Ca2+ concentrations using the calibration methods as we have done before (34, 35). Experimental traces from individual cells were inspected visually prior to acceptance. Typically, three individual ASDNs from an average of three mice were used for each experimental set.
Cell Culturing
Immortalized mouse cortical collecting duct (mpkCCDc14) principal cells were kindly provided by Dr. A. Vandewalle (INSERM, Paris, France) and grown in defined medium on permeable supports (Costar Transwells; 0.4-μm pore, 24-mm diameter) as described previously (36). The cells were maintained with FBS and corticosteroids allowing them to polarize and form a monolayer with high resistance and avid Na+ reabsorption. The cells were seeded onto permeable supports (Costar Transwells; 0.4-μm pore, 24-mm diameter) at a density of 0.2–0.3 × 10⁶ cells/filter. The mpkCCDc14 cells were kept on filter supports for at least 7 days, and the medium was changed every other day. Growth medium was composed of equal volumes of DMEM and Ham's F12, 60 nm Na+ selenate, 5 μg/ml transferrin, 50 nm dexamethasone, 1 nm triiodothyronine, 10 ng/ml EGF, 5 μg/ml insulin, 2% FCS, and 100 μg/ml Pen/Strep. The cells were grown in a 5% CO2/95% air atmosphere incubator at 37 °C. Typically, after 7 days a confluent transporting cell monolayer developed which was subsequently assessed by recording open circuit voltage and trans-epithelial resistance.
Equivalent Open Circuit Current Experiments
A Millicel Electrical Resistance System (Millipore Corp.) was used to measure voltage and resistance across the mpkCCDc14 cell monolayers grown on permeable supports (Costar Transwells, 0.4-μm pore, 24-mm diameter), as described previously (36, 37). Equivalent trans-epithelial Na+ currents were calculated as the quotient of trans-epithelial voltage to trans-epithelial resistance under open-circuit conditions as we reported previously (36).
Total ROS Detection with Fluorescent Microscopy
MpkCCDc14 cells were maintained via standard culture practice. The day before the experiment, the cells were seeded onto glass slides to ensure 50–70% confluence on the day of the experiment. The cells were loaded with ROS Detection Solution (Enzo Life Sciences, ENZ-51011) in the DMEM without serum, antibiotics, or supplements according to the manufacturer's protocol and incubated for 1 h. Experimental agents were added to the cells 10 min (vehicle (H2O) and experimental test agent (Ang II, 1 μm)) or 30 min (ROS inducer (pyocyanin) and negative control reagent (N-acetyl-l-cysteine)) prior to the end of the incubation. MpkCCDc14 cells loaded with the ROS detection reagent were visualized with fluorescence microscope Eclipse E-600 (Nikon) using a 20× objective equipped with a CCD camera (Princeton Instruments). All images were taken with the same exposure time. The signal was excited at 490 nm, and emission was collected at 525 nm. Fluorescent images were processed with Metamorph 7.5 software (Molecular Devices) and open source software ImageJ 1.42.
Data Analysis
All summarized data are reported as mean ± S.E. Data from before and after treatment within the same experiment were compared using the paired t test. Data from different experiments were compared, with a Student's (two-tailed) t test or a one-way ANOVA as appropriate. p < 0.05 considered significant.
RESULTS
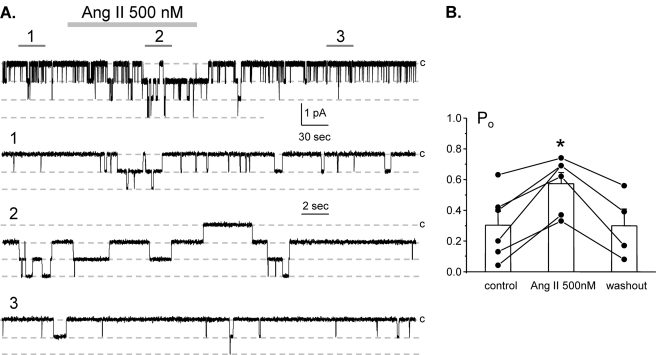
It is well known that elevations of circulating Ang II in response to volume depletion promote aldosterone secretion from zona glomerulosa of the adrenal gland to activate ENaC in the ASDN. Correlative evidence suggests that Ang II might also have more acute effect on Na+ transport at this nephron segment (19, 38). To test this directly, we used patch clamp electrophysiology in split-opened murine ASDNs to examine Ang II actions on ENaC in situ. Fig. 1A documents a representative current trace from a cell-attached patch monitoring ENaC activity in the control, during application of 500 nm Ang II and following washout. As can be seen from this paired experiment and the summary graph in Fig. 1B, Ang II acutely increases ENaC open probability (Po) in a reversible manner. The mean Po was 0.30 ± 0.08, 0.57 ± 0.07, and 0.30 ± 0.10 in the control, during Ang II treatment, and washout, respectively (n = 6; n = 4 mice).
FIGURE 1.
Angiotensin increases ENaC Po in freshly isolated split-opened ASDNs. A, representative continuous current trace from a cell-attached patch containing at least three ENaCs in the control, under application of 500 nm Ang II, and following washout with regular bath solution. This patch was held at a test potential of Vh = −Vp = −60 mV. Areas of control (1), upon Ang II treatment (2), and washout (3) are shown below at an expanded time scale. Inward Li+ currents are downward. Dashed lines indicate the respective current state with a c denoting the closed state. B, summary graph of ENaC Po changes in response to Ang II and following washing out from paired patch clamp experiments similar to that shown in A. *, significant increase versus control. Error bars, S.E.
We next determined the concentration diapason of Ang II regulation of ENaC activity. Fig. 2 summarizes changes in ENaC Po in paired patch clamp experiments in response to application of different concentrations of Ang II. As is clear, Ang II in concentrations of 20 nm or higher significantly increased ENaC Po, whereas 5 nm Ang II had no measurable effect on ENaC.
FIGURE 2.
Angiotensin increases ENaC Po in a dose-dependent manner. Summary graph of absolute changes in ENaC Po in response to application of 5, 20, 100, and 500 nm Ang II in paired patch clamp experiments is shown. For each individual experiment the absolute changes were calculated as a difference in ENaC Po in the control and after application of a respective concentration of Ang II. Error bars, S.E.
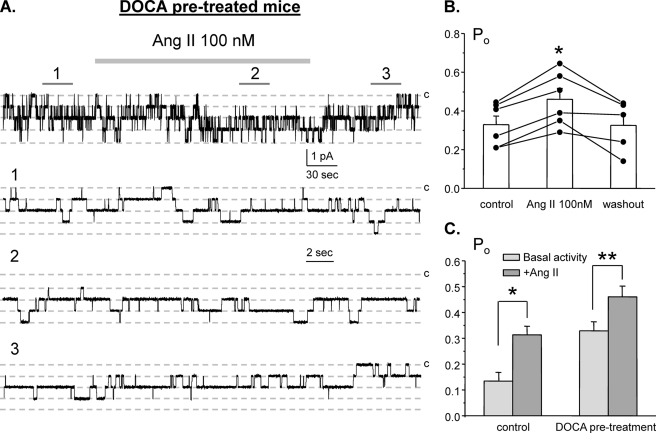
We next probed whether Ang II and aldosterone are synergistic with regard to stimulation of ENaC in the ASDN. For this, we saturated mineralocorticoid status by injecting mice with DOCA for 3 consecutive days prior to experimentation. Fig. 3A contains representative paired experiment monitoring ENaC activity in DOCA-treated animals in the control, during application of Ang II (100 nm), and following washout. As summarized in Fig. 3B, the mean Po was 0.32 ± 0.04, 0.46 ± 0.04, and 0.32 ± 0.05 in the control, following application of Ang II, and washout, respectively (n = 6, n = 5 mice). The comparison of Ang II effects in the control and in DOCA-treated mice is shown in Fig. 3C. As is clear from the results in Fig. 3, the effect of Ang II on ENaC is preserved when mineralocorticoid levels are clamped high.
FIGURE 3.
Clamping mineralocorticoids at a high level does not interfere with Ang II actions on ENaC. A, representative continuous current trace from a cell-attached patch monitoring ENaC activity in the control, under application of 100 nm Ang II, and following washout with regular bath solution. For these experiments animals were injected with DOCA for 3 consecutive days prior to the experimentation. Areas of control (1), after Ang II treatment (2), and washout (3) are shown below at an expanded time scale. All other conditions are identical to those described in Fig. 1A. B, summary graph of ENaC Po changes in response to 100 nm Ang II and following washing out from paired patch clamp experiments similar to that shown on A. *, significant increase versus control. C, summary graph comparing actions of 100 nm Ang on average ENaC Po in control and in DOCA-treated mice. *, significant increase versus control basal activity; **, significant increase versus DOCA pretreatment basal activity. Error bars, S.E.
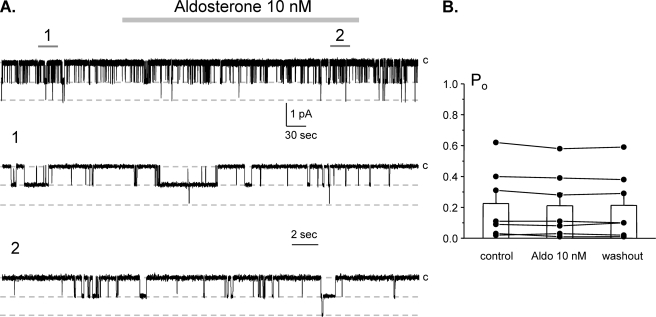
To probe further whether Ang II and aldosterone have distinct stimulatory actions on ENaC, we determine the acute effects of aldosterone on ENaC Po. Fig. 4A demonstrates a representative experiment monitoring changes in ENaC activity in cell-attached configuration in the control, during application of 10 nm aldosterone (5 min) and following washout. As can be seen from this representative experiment and the summary graph in Fig. 4B, aldosterone failed to stimulate ENaC acutely in these native preparations. The mean Po was 0.23 ± 0.08 and 0.21 ± 0.08 in the control and following aldosterone application, respectively (n = 7, n = 3 mice). This contrasts with the acute activation of ENaC by Ang II (Figs. 1–3), suggesting that aldosterone and Ang II have different time frames of ENaC stimulation and, thus, distinct mechanisms of actions.
FIGURE 4.
Aldosterone does not acutely affect ENaC Po in freshly isolated split-opened ASDNs. A, representative continuous current trace from a cell-attached patch containing two ENaCs in the control, under application of 10 nm aldosterone, and following washout with regular bath solution. Areas of control (1) and after aldosterone (2) are shown below at an expanded time scale. All other conditions are identical to those described in Fig. 1A. B, summary graph of ENaC Po changes in response to 10 nm aldosterone from paired patch clamp experiments similar to that shown in A. Error bars, S.E.
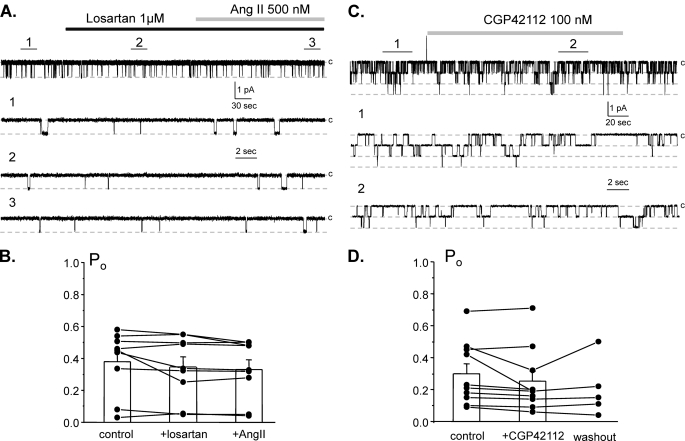
We next tested the signaling determinants of Ang II regulation of ENaC in the distal nephron. Fig. 5A shows a representative current trace containing a single ENaC in the control, during inhibition of AT1R with losartan (1 μm), and following application of Ang II (500 nm) in the continued presence of the antagonist. As summarized in Fig. 5B, Ang II fails to increase ENaC activity when AT1Rs are inhibited.
FIGURE 5.
Ang II increases ENaC activity by stimulating AT1 receptors. A, representative continuous current trace from a cell-attached patch containing a single ENaC in the control, after inhibition of AT1 receptors with a selective antagonist, 1 μm losartan, and following application of 500 nm Ang II in the continued presence of the AT1R antagonist. Areas of control (1), after losartan (2), and following Ang II (3) are shown below with an expanded scale. B, summary graph of ENaC Po changes in response to the AT1R antagonist and following Ang II treatment from paired patch clamp experiments similar to those shown in A. C, representative continuous current trace from a cell-attached patch monitoring ENaC activity in the control, after stimulation of AT2 receptors with a selective agonist, 100 nm CGP42112, and following washout with control solution. Areas of control (1) and after CGP42112 (2) are shown below with an expanded time scale. D, summary graph of ENaC Po changes in response to the AT2R agonist and following washout from paired patch clamp experiments similar to shown in C. Error bars, S.E.
We further tested whether AT2R has a complementary role in regulation of ENaC by Ang II. Fig. 5C shows a continuous patch clamp experiment monitoring ENaC activity in the control, after direct stimulation of AT2R with a selective agonist, CGP42112 (100 nm), and following washout. As summarized in Fig. 4D, stimulation of AT2Rs has little effect on ENaC Po. The mean Po was 0.29 ± 0.06 and 0.25 ± 0.06 in the control and following CGP42112 application, respectively (n = 10, n = 7 mice). Overall, we concluded that Ang II increases ENaC activity by stimulating AT1 but not AT2 receptors.
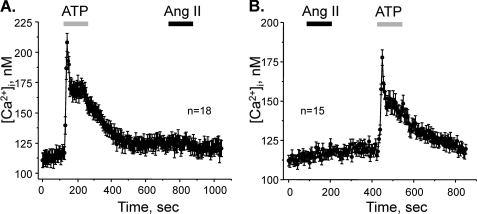
AT1Rs are typically coupled to Gq/11 in vasculature cells leading to stimulation of PLC and elevations of [Ca2+]i via an IP3-sensitive mechanism (25). To test whether stimulation of AT1Rs initiates similar signaling cascade in ASDN, we directly monitored changes in [Ca2+]i in individual cells within a split-opened area using Ca2+-sensitive dye Fura-2. As a positive control, we stimulated purinergic cascade with ATP to elevate [Ca2+]i in ASDN cells as we reported previously (35, 39). Application of 10 μm ATP produces a transient peak followed by a sustained plateau (Fig. 6A). In contrast, subsequent application of 500 nm Ang II fails to induce measurable [Ca2+]i elevations. To exclude a possibility that Ang II-mediated Ca2+ changes might be compromised by the prior exposure to ATP, we reversed the order of agonist applications. Consistently, Ang II failed to increase [Ca2+]i whereas subsequent purinergic stimulation induced prominent elevation of [Ca2+]i (Fig. 6B). We concluded that Ang II does not activate PLC-IP3-[Ca2+]i cascade in ASDN cells.
FIGURE 6.
Ang II does not increase [Ca2+]i in ASDN cells. A, average time course of [Ca2+]i changes in individual cells of ASDN in response to 2-min application of 10 μm ATP (shown with a gray bar) and 500 nm Ang II (shown with a black bar). B, average time course of [Ca2+]i changes in individual cells of distal nephron in response to 2-min application of 500 nm Ang II (shown with a black bar) and 10 μm ATP (shown with a gray bar).
AT1R-mediated signal transduction cascades can also involve activation of PI3K and PLA2 (26). To determine whether Ang II increases ENaC Po via a PI3K-sensitive mechanism, we treated split-opened ASDN with a selective PI3K inhibitor, LY294002 (20 μm). LY294002 application significantly decreased ENaC Po from 0.52 ± 0.06 to 0.14 ± 0.03 (n = 8, n = 4 mice). However, Ang II was capable of increasing ENaC Po to 0.32 ± 0.05 in the continued presence of the inhibitor (Fig. 7A). We concluded that PI3K plays a minor role in signaling pathway of ENaC regulation by Ang II.
FIGURE 7.
Ang II regulation of ENaC does not involve PI3K and PLA2. A, summary graph of ENaC open probability changes in response to inhibition of PI3K with LY294002 (20 μm), application of 500 nm Ang II in the continued presence of the antagonist, and following washout with control solution from paired patch clamp experiments performed on isolated split-opened ASDNs. *, significant decrease versus control; **, significant increase versus +LY294002. B, summary graph of ENaC Po changes in response to inhibition of PLA2 with AACOCF3 (30 μm), application of 500 nm Ang II in the continued presence of the antagonist, and following washout with control solution from paired patch clamp experiments performed on isolated split-opened ASDNs. *, significant decrease versus control; **, significant increase versus + AACOCF3. Error bars, S.E.
We next tested whether Ang II increases ENaC Po in a PLA2-dependent manner. Inhibition of PLA2 with a selective inhibitor, AACOCF3 (30 μm), decreases ENaC Po from 0.41 ± 0.04 to 0.20 ± 0.04 (n = 13, n = 6 mice). Ang II significantly increased ENaC Po to 0.38 ± 0.05 on the background of the PLA2 inhibitor (Fig. 7B). These results exclude PLA2 as having a role in signaling pathway coupling Ang II actions to changes in ENaC activity.
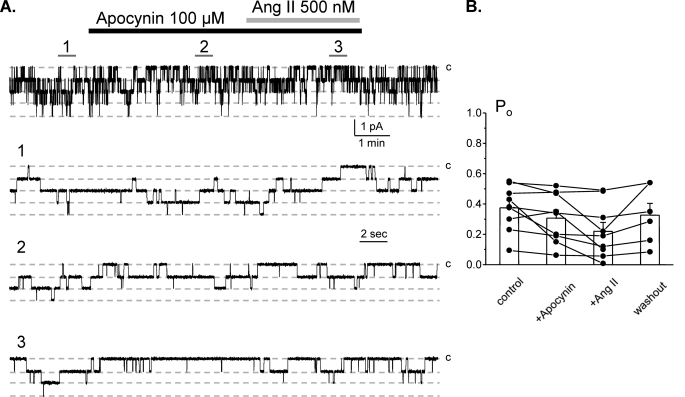
Ang II is known to increase production of ROS via activation of NADPH oxidase complex in many cell types (26). Therefore, we next probed whether activation of NADPH oxidase mediates Ang II actions on ENaC. Fig. 8A contains a representative patch clamp experiment monitoring ENaC activity in the control, after application of apocynin (100 μm), application of 500 nm Ang II in the continued presence of the former, and following washout. Apocynin, which blocks NADPH oxidase subunit assembly (40), does not affect ENaC activity by itself. However, treatment with apocynin abolished stimulatory action of Ang II on ENaC. The mean Po was 0.37 ± 0.04, 0.31 ± 0.05, and 0.22 ± 0.06 (n = 9, n = 5 mice) in the control, during apocynin application, and following Ang II in the continued presence of the inhibitor, respectively (Fig. 8B). These results are consistent with Ang II stimulating ENaC Po in a NADPH oxidase-dependent manner.
FIGURE 8.
Stimulatory effect of Ang II on ENaC is mediated by NADPH oxidase. A, representative continuous current trace from a cell-attached patch containing monitoring ENaC activity in the control, after inhibition of NADPH oxidase with 100 μm apocynin, application of 500 nm Ang II in the continued presence of the former, and following washout with control solution. Areas of control (1), after apocynin (2), and following Ang II (3) are shown below with an expanded scale. B, summary graph of ENaC Po changes in response to the inhibition of NADPH oxidase, Ang II treatment, and washout from paired patch clamp experiments similar to those shown in A. Error bars, S.E.
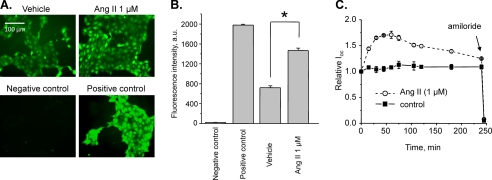
To test further whether Ang II increases ENaC activity by promoting ROS production, we next directly assessed total ROS levels in cultured mpkCCDc14 cells in response to Ang II. Fig. 9A demonstrates representative micrographs of the fluorescent ROS reporter after 10 min treatment with vehicle (left) and 1 μm Ang II (right). The negative and positive controls (N-acetyl-l-cysteine and pyocyanin, respectively) are shown below. As documented by the summary graph in Fig. 9B, Ang II treatment significantly increased fluorescence levels to 1,463.07 ± 52.26 a.u. compared with 718.03 ± 39.05 a.u. in the control. The negative and positive controls have fluorescent values of 19.50 ± 5.08 a.u. and 1,977.00 ± 19.18 a.u., respectively.
FIGURE 9.
Ang II induces formation of ROS and stimulates amiloride-sensitive Ioc in mpkCCDc14 cells. A, representative fluorescent micrographs of the mpkCCDc14 cells loaded with the total ROS detection reagent treated with a vehicle (control), 1 μm Ang II, ROS inhibitor (N-acetyl-l-cysteine, negative control), and ROS inducer (pyocyanin, positive control). Scale bar shown is common for all images. B, summary graph of ROS detection experiments (n = 25) displaying the total fluorescence intensity measured from the images of the mpkCCDc14 cells treated with different experimental agents. Background fluorescence level was corrected. *, significant increase versus vehicle. C, summary graph of equivalent Ioc in mpkCCDc14 principal cells in response to 1 μm Ang II. Ang II and vehicle (control) were added at time 0, and the current was normalized to the starting level. Amiloride (10 μm; arrow) was added to the apical membrane at the end of experiments. Values are means ± S.E. (error bars) of at least three experiments for each value.
To verify that Ang II stimulates ENaC-mediated sodium transport in mpkCCDc14 cells as it occurs in freshly isolated ASDNs, we have studied the effects of Ang II on equivalent Ioc. As shown in Fig. 9C, application of 1 μm Ang II to polarized mpkCCDc14 cells significantly increased amiloride-sensitive open circuit current in a time-dependent manner. These data demonstrate that the time course of ROS generation in response to Ang II parallels with stimulation of sodium transport in cultured principal cells.
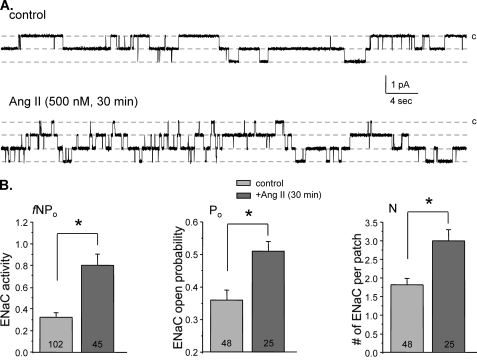
We finally probed whether prolonged exposure to Ang II may also affect membrane ENaC levels. For this, we pretreated split-opened ASDNs with either vehicle or Ang II for 30 min. Fig. 10A shows representative current traces of ENaC activity after treatment with vehicle (top) and 500 nm Ang II (bottom). For quantification of Ang II actions on ENaC, we estimated integral ENaC activity (fNPo), where N is the number of active channels per patch and f is the frequency of observing patches with at least one active channel (f = number of patches with channels/total number of patches). As summarized in Fig. 10B, Ang II significantly increases fNPo from 0.32 ± 0.04 (n = 102 patches) to 0.80 ± 0.10 (n = 45 patches). This was associated with an increased Po from 0.36 ± 0.03 (n = 48 patches with channels) to 0.51 ± 0.03 (n = 25 patches with channels). Importantly, we have also observed a significant increase in N from 1.81 ± 0.18 to 3.0 ± 0.3.
FIGURE 10.
Prolonged Ang II treatment stimulates ENaC in the ASDNs by increasing both open probability and functional ENaC numbers. A, representative current traces of ENaC activity in the control (top) and after application of 500 nm Ang II for 30 min (bottom). All other conditions are identical to those described in Fig. 1A. B, summary graphs comparing integral ENaC activity (fNPo, left), ENaC open probability (Po, middle), and number of active channels per patch (N, right) for split-opened ASDNs treated with vehicle and Ang II for 30 min. *, significant increase versus control. Error bars, S.E.
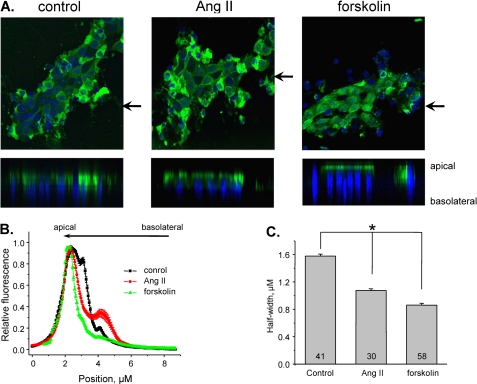
The effect of Ang II on the functional ENaC levels can result from facilitated ENaC trafficking and/or activation of the silent channels on the apical membrane. To test this further, we next directly visualized ENaC redistribution in split-opened ASDNs in response to Ang II with immunohistochemistry. Fig. 11A demonstrates representative fluorescent confocal images of αENaC localization within principal cells treated with vehicle (left) and 500 nm Ang II (middle) for 30 min. α-ENaC has diffuse distribution on the apical side of principal cells during control conditions. Importantly, Ang II treatment caused a prominent shift of the fluorescent signal toward the apical membrane. As a positive control, we treated split-opened ASDNs with 10 μm forskolin which was reported to promote ENaC trafficking in cultured distal nephron cells via activation of protein kinase A and elevation of cAMP levels (41). For quantitative estimation, we employed line scan analysis of α-ENaC distribution along z axis in cross-sections of three-dimensional stacks similar to that shown in Fig. 11A. The graph in Fig. 11B shows dependence of the relative fluorescent intensity from the position on the z axis in individual cells of ASDN treated with vehicle, Ang II, and forskolin, respectively. As is clear, Ang II and forskolin caused a leftward narrowing of the bell-shape distribution of α-ENaC along z axis. As summarized in Fig. 11C, the half-width was significantly reduced from 1.58 ± 0.03 μm in the control to 1.07 ± 0.02 μm and 0.86 ± 0.03 μm in response to Ang II and forskolin, respectively. The results in Fig. 11 suggest that prolonged exposure of ASDNs to Ang II induces prominent redistribution of α-ENaC from cytosol compartments toward the apical membrane. This is the first demonstration of direct effect of Ang II on ENaC trafficking in situ that we are aware of.
FIGURE 11.
Ang II induces translocation of α-ENaC toward the apical membrane. A, representative confocal plane images (top) and corresponding cross-sections of three-dimensional stacks by z axis (bottom) of α-ENaC localization (pseudocolor green) in split-opened ASDNs treated for 30 min with vehicle (left), 500 nm Ang II (middle), and 10 μm forskolin (right). Nuclear DAPI staining is also shown (pseudocolor blue). The positions of cross-section are shown by the arrows. B, distribution of averaged relative fluorescent signals representing α-ENaC localization along a line on z axis crossing a cell upon treatment with vehicle, Ang II, and forskolin. For each individual cell the fluorescent signals were normalized to their corresponding maximal value. The positions of the apical and basolateral sides are shown with arrows at the top. C, summary graph of half-width means for distributions of fluorescent signals shown in B. *, significant decrease versus control. Error bars, S.E.
DISCUSSION
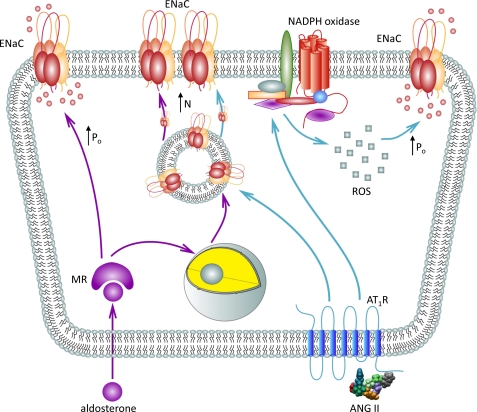
The classical model of sodium transport regulation in the distal nephron postulates that variations in systemic salt intake control ENaC-mediated sodium reabsorption via aldosterone-mediated mechanisms. In this study, we expand this view by providing experimental evidence that Ang II, in addition to its well known stimulatory actions on aldosterone secretion from the adrenal gland, has a direct effect on ENaC activity in native murine distal nephron. This regulation is complex and includes an acute activation of functional ENaC as well as more chronic effect on ENaC trafficking to the apical plasma membrane (Fig. 12).
FIGURE 12.
Principal scheme of ENaC regulation by Ang II in the ASDN.
It has been found previously that application of Ang II stimulates luminal Na+ entry in the perfused CCD of rabbits (19). Using patch clamp electrophysiology in freshly isolated split-opened murine distal nephrons, we determined directly that nanomolar concentrations of Ang II acutely increase ENaC Po. Physiological concentrations of Ang II in the ASDN have as yet to be carefully estimated. However, Ang II concentration in the fluid sampled from the proximal tubule greatly exceeds 10−8 m (42). Moreover, an existence of intrarenal RAS in the distal nephron allows local generation of Ang II in situ (for review, see Ref. 43). Indeed, application of Ang I stimulates apical Na+ entry in perfused CCDs in an angiotensin-converting enzyme-dependent manner (44), suggesting that the rate of paracrine conversion of Ang I to Ang II is sufficient to activate Ang II receptors. Furthermore, the Ang II concentrations can be markedly elevated during pathophysiological conditions (45).
We determined that activation of AT1R is necessary for Ang II-mediated regulation of ENaC Po. This is in a good agreement with observation that inhibition of AT1R abolishes Ang II-mediated luminal Na+ entry in the perfused CCDs (19). Interestingly, we found that Ang II had little effect on [Ca2+]i in ASDN cells, suggesting that AT1R do not activate Gq/11-PLC pathway as it commonly occurs in vasculature cells (26, 46). This makes sense as activation of this signaling cascade leads to inhibition of ENaC in the ASDN via purinergic and bradykinin signaling cascades as we have reported previously (28, 39).
Ang II induces generation of ROS in many tissues including vascular smooth muscle cells, endothelial cells, phagocytic cells, and fibroblasts (26), resulting chiefly from activation of NADPH oxidases. Moreover, it was recently demonstrated that Ang II inhibits activity of ROMK-like channels in the CCD in a NADPH oxidase-dependent manner (47). In our study, we also identified a critical role of NADPH oxidase in signaling pathway of Ang II regulation of ENaC. A common signaling mechanism of Ang II regulation of sodium and potassium transport supports an idea that Ang II via stimulation of NADPH oxidases plays an important role in uncoupling sodium reabsorption by stimulating ENaC from potassium secretion by inhibiting ROMK in ASDN. Indeed, a recent study demonstrates that Ang II inhibits activity of ROMK1 during condition of volume depletion (48). Furthermore, we directly demonstrated that Ang II increases ROS production in cultured mouse principal cells. A recent report suggests that ROS, specifically H2O2, possess a stimulatory effect on ENaC Po in A6 cells (49). This effect was not direct and involved activation of PI3K. In contrast, we found a minor role of PI3K in Ang II regulation of ENaC in native murine ASDN. We predict that different species may cause this apparent discrepancy. Thus, subunit composition of NADPH complex and expression of cell-specific NADPH oxidase isoforms can be critical for Ang II regulation of ENaC. Therefore, the exact mechanism of ENaC regulation by ROS in mammalian ASDN requires further examination.
In this study, we provide the first direct evidence that Ang II, in addition to stimulation of ENaC Po, increases ENaC abundance on the apical plasma membrane. Indeed, prolonged Ang II treatment increases the number of functional channels within a patch. Moreover, we observed translocation of α-ENaC from cytosol toward the plasma membrane in response to Ang II treatment in split-opened murine distal nephrons. This regulation is physiologically relevant because mice lacking AT1Rs exhibit a marked reduction in α-ENaC abundance despite slightly elevated aldosterone levels (50). Similarly, systemic AT1R blockade also decreases α-ENaC protein levels, and this effect is not prevented by inhibition of mineralocorticoid receptors with spironolactone (51).
Overall, this paper provides direct evidence that Ang II possesses multiple stimulatory actions on ENaC and that its effect is preserved in the presence of saturated systemic mineralocorticoids. Moreover, we demonstrate that the effects of Ang II and aldosterone have different time courses of ENaC activation. The synergy between aldosterone and Ang II may play an important physiological role in maximizing ENaC-mediated sodium reabsorption in the ASDN under conditions of volume depletion to minimize sodium loss with urine. Conversely, aldosterone-independent regulation of ENaC by Ang II might have detrimental consequences on sodium balance under pathological conditions that cause overstimulation of the intrarenal RAS, such as diabetes mellitus (for review, see Ref. 45), leading to hypertension and kidney damage.
This work was supported in part by American Heart Association Grant SDG2230391 (to O. P.), a in part Carl W. Gottschalk research scholar grant from the American Society of Nephrology (to O. P.), National Institutes of Health Grant American Diabetes Association Grant 1-10-BS-168 (to A. S.), and R01HL108880 (to A. S.).
- ASDN
- aldosterone-sensitive distal nephron
- Ang II
- angiotensin II
- a.u.
- arbitrary units
- CCD
- cortical collecting duct
- DOCA
- deoxycorticosterone acetate
- ENaC
- epithelial Na+ channel
- Po
- open probability
- PLA2
- phospholipase A2
- PLC
- phospholipase C
- R
- receptor
- RAAS
- renin-angiotensin-aldosterone system
- ROMK
- renal outer medullary K+
- ROS
- reactive oxygen species
- AT2
- angiotensin II receptors type 2
- AT1R
- AT2R, angiotensin II types 1 and 2 receptors.
REFERENCES
- 1. Guyton A. C. (1991) Science 252, 1813–1816 [DOI] [PubMed] [Google Scholar]
- 2. Khawaja Z., Wilcox C. S. (2011) Int. J. Hypertens. 2011, 143471. [DOI] [PMC free article] [PubMed] [Google Scholar]
- 3. Garty H., Palmer L. G. (1997) Physiol. Rev. 77, 359–396 [DOI] [PubMed] [Google Scholar]
- 4. Hummler E. (2003) Curr. Hypertens. Rep. 5, 11–18 [DOI] [PubMed] [Google Scholar]
- 5. Lifton R. P., Gharavi A. G., Geller D. S. (2001) Cell 104, 545–556 [DOI] [PubMed] [Google Scholar]
- 6. Eaton D. C., Malik B., Saxena N. C., Al-Khalili O. K., Yue G. (2001) J. Membr. Biol. 184, 313–319 [DOI] [PubMed] [Google Scholar]
- 7. Schild L., Kellenberger S. (2001) Adv. Exp. Med. Biol. 502, 305–314 [DOI] [PubMed] [Google Scholar]
- 8. Hummler E. (1999) J. Steroid Biochem. Mol. Biol. 69, 385–390 [DOI] [PubMed] [Google Scholar]
- 9. Schild L. (2004) Rev. Physiol. Biochem. Pharmacol. 151, 93–107 [DOI] [PubMed] [Google Scholar]
- 10. Stockand J. D. (2002) Am. J. Physiol. Renal Physiol. 282, F559–576 [DOI] [PubMed] [Google Scholar]
- 11. Hansson J. H., Schild L., Lu Y., Wilson T. A., Gautschi I., Shimkets R., Nelson-Williams C., Rossier B. C., Lifton R. P. (1995) Proc. Natl. Acad. Sci. U.S.A. 92, 11495–11499 [DOI] [PMC free article] [PubMed] [Google Scholar]
- 12. Hansson J. H., Nelson-Williams C., Suzuki H., Schild L., Shimkets R., Lu Y., Canessa C., Iwasaki T., Rossier B., Lifton R. P. (1995) Nat. Genet. 11, 76–82 [DOI] [PubMed] [Google Scholar]
- 13. Schild L. (1996) Nephrologie 17, 395–400 [PubMed] [Google Scholar]
- 14. Shimkets R. A., Warnock D. G., Bositis C. M., Nelson-Williams C., Hansson J. H., Schambelan M., Gill J. R., Jr., Ulick S., Milora R. V., Findling J. W. (1994) Cell 79, 407–414 [DOI] [PubMed] [Google Scholar]
- 15. Wang W. H., Giebisch G. (2009) Pflugers Arch. 458, 157–168 [DOI] [PMC free article] [PubMed] [Google Scholar]
- 16. Knepper M. A., Kim G. H., Masilamani S. (2003) Ann. N.Y. Acad. Sci. 986, 562–569 [DOI] [PubMed] [Google Scholar]
- 17. Masilamani S., Kim G. H., Mitchell C., Wade J. B., Knepper M. A. (1999) J. Clin. Invest. 104, R19–23 [DOI] [PMC free article] [PubMed] [Google Scholar]
- 18. Arroyo J. P., Ronzaud C., Lagnaz D., Staub O., Gamba G. (2011) Physiology 26, 115–123 [DOI] [PubMed] [Google Scholar]
- 19. Peti-Peterdi J., Warnock D. G., Bell P. D. (2002) J. Am. Soc. Nephrol. 13, 1131–1135 [DOI] [PubMed] [Google Scholar]
- 20. Berry C., Touyz R., Dominiczak A. F., Webb R. C., Johns D. G. (2001) Am. J. Physiol. Heart Circ. Physiol. 281, H2337–2365 [DOI] [PubMed] [Google Scholar]
- 21. Zaman M. A., Oparil S., Calhoun D. A. (2002) Nat. Rev. Drug Discov. 1, 621–636 [DOI] [PubMed] [Google Scholar]
- 22. Harrison-Bernard L. M., Navar L. G., Ho M. M., Vinson G. P., el-Dahr S. S. (1997) Am. J. Physiol. 273, F170–177 [DOI] [PubMed] [Google Scholar]
- 23. Miyata N., Park F., Li X. F., Cowley A. W., Jr. (1999) Am. J. Physiol. 277, F437–446 [DOI] [PubMed] [Google Scholar]
- 24. Ozono R., Wang Z. Q., Moore A. F., Inagami T., Siragy H. M., Carey R. M. (1997) Hypertension 30, 1238–1246 [DOI] [PubMed] [Google Scholar]
- 25. de Gasparo M., Catt K. J., Inagami T., Wright J. W., Unger T. (2000) Pharmacol. Rev. 52, 415–472 [PubMed] [Google Scholar]
- 26. Hunyady L., Catt K. J. (2006) Mol. Endocrinol. 20, 953–970 [DOI] [PubMed] [Google Scholar]
- 27. Bugaj V., Pochynyuk O., Stockand J. D. (2009) Am. J. Physiol. Renal Physiol 297, F1411–1418 [DOI] [PMC free article] [PubMed] [Google Scholar]
- 28. Pochynyuk O., Bugaj V., Rieg T., Insel P. A., Mironova E., Vallon V., Stockand J. D. (2008) J. Biol. Chem. 283, 36599–36607 [DOI] [PMC free article] [PubMed] [Google Scholar]
- 29. Pochynyuk O., Rieg T., Bugaj V., Schroth J., Fridman A., Boss G. R., Insel P. A., Stockand J. D., Vallon V. (2010) FASEB J. 24, 2056–2065 [DOI] [PMC free article] [PubMed] [Google Scholar]
- 30. Pochynyuk O., Bugaj V., Vandewalle A., Stockand J. D. (2008) Am. J. Physiol. Renal Physiol. 294, F38–46 [DOI] [PubMed] [Google Scholar]
- 31. Kemendy A. E., Kleyman T. R., Eaton D. C. (1992) Am. J. Physiol. 263, C825–837 [DOI] [PubMed] [Google Scholar]
- 32. Gao X., Wu L., O'Neil R. G. (2003) J. Biol. Chem. 278, 27129–27137 [DOI] [PubMed] [Google Scholar]
- 33. Wu L., Gao X., Brown R. C., Heller S., O'Neil R. G. (2007) Am. J. Physiol. Renal Physiol. 293, F1699–1713 [DOI] [PubMed] [Google Scholar]
- 34. Jin M., Wu Z., Chen L., Jaimes J., Collins D., Walters E. T., O'Neil R. G. (2011) PLoS One 6, e16713. [DOI] [PMC free article] [PubMed] [Google Scholar]
- 35. Mamenko M., Zaika O., Jin M., O'Neil R. G., Pochynyuk O. (2011) PLoS One 6, e22824. [DOI] [PMC free article] [PubMed] [Google Scholar]
- 36. Staruschenko A., Pochynyuk O., Vandewalle A., Bugaj V., Stockand J. D. (2007) J. Am. Soc. Nephrol. 18, 1652–1661 [DOI] [PubMed] [Google Scholar]
- 37. Levchenko V., Zheleznova N. N., Pavlov T. S., Vandewalle A., Wilson P. D., Staruschenko A. (2010) J. Cell. Physiol. 223, 252–259 [DOI] [PubMed] [Google Scholar]
- 38. Wang T., Giebisch G. (1996) Am. J. Physiol. 271, F143–149 [DOI] [PubMed] [Google Scholar]
- 39. Zaika O., Mamenko M., O'Neil R. G., Pochynyuk O. (2011) Am. J. Physiol. Renal Physiol. 300, F1105–1115 [DOI] [PMC free article] [PubMed] [Google Scholar]
- 40. Wind S., Beuerlein K., Eucker T., Müller H., Scheurer P., Armitage M. E., Ho H., Schmidt H. H., Wingler K. (2010) Br. J. Pharmacol. 161, 885–898 [DOI] [PMC free article] [PubMed] [Google Scholar]
- 41. Butterworth M. B., Frizzell R. A., Johnson J. P., Peters K. W., Edinger R. S. (2005) Am. J. Physiol. Renal Physiol. 289, F969–977 [DOI] [PubMed] [Google Scholar]
- 42. Braam B., Mitchell K. D., Fox J., Navar L. G. (1993) Am. J. Physiol. 264, F891–898 [DOI] [PubMed] [Google Scholar]
- 43. Navar L. G., Prieto M. C., Satou R., Kobori H. (2011) Curr. Opin. Pharmacol. 11, 180–186 [DOI] [PMC free article] [PubMed] [Google Scholar]
- 44. Komlosi P., Fuson A. L., Fintha A., Peti-Peterdi J., Rosivall L., Warnock D. G., Bell P. D. (2003) Hypertension 42, 195–199 [DOI] [PubMed] [Google Scholar]
- 45. Kobori H., Nangaku M., Navar L. G., Nishiyama A. (2007) Pharmacol. Rev. 59, 251–287 [DOI] [PubMed] [Google Scholar]
- 46. Kaschina E., Unger T. (2003) Blood Press. 12, 70–88 [DOI] [PubMed] [Google Scholar]
- 47. Wei Y., Zavilowitz B., Satlin L. M., Wang W. H. (2007) J. Biol. Chem. 282, 6455–6462 [DOI] [PMC free article] [PubMed] [Google Scholar]
- 48. Yue P., Sun P., Lin D. H., Pan C., Xing W., Wang W. (2011) Kidney Int. 79, 423–431 [DOI] [PMC free article] [PubMed] [Google Scholar]
- 49. Ma H. P. (2011) J. Biol. Chem. 286, 32444–32453 [DOI] [PMC free article] [PubMed] [Google Scholar]
- 50. Brooks H. L., Allred A. J., Beutler K. T., Coffman T. M., Knepper M. A. (2002) Hypertension 39, 470–473 [DOI] [PubMed] [Google Scholar]
- 51. Beutler K. T., Masilamani S., Turban S., Nielsen J., Brooks H. L., Ageloff S., Fenton R. A., Packer R. K., Knepper M. A. (2003) Hypertension 41, 1143–1150 [DOI] [PubMed] [Google Scholar]


