

Abstract
Lissencephaly is a human developmental brain abnormality caused by LIS1 haploinsufficiency. This disorder is in large part attributed to altered mitosis and migration in the developing brain. LIS1 and an interacting protein, NDEL1, bind to cytoplasmic dynein, a microtubule motor protein. While the tripartite complex is clearly important for developmental events, we are intrigued by the fact that Lis1 and Ndel1 expression remain high in the adult mouse nervous system. Dynein plays a crucial role in retrograde axonal transport, a process that is used by mature neurons. Here, we monitored acidic organelles moving in axons of adult rat sensory neurons to determine whether Lis1 and Ndel1 contribute to axonal transport. Lis1 RNAi significantly reduced axon transport of these organelles. Ndel1 RNAi had little impact, but combined Lis1 and Ndel1 RNAi caused a more severe phenotype than Lis1 RNAi alone, essentially shutting down transport. Lis1 overexpression stimulated retrograde transport, while a Lis1 dynein-binding mutant severely disrupted transport. Overexpression of Ndel1 or a Lis1 Ndel1-binding mutant only mildly perturbed transport. However, expressing a mutant Ndel1 lacking key phosphorylation sites shut down transport completely, as did a dominant-negative Cdk5 construct. We propose that, in axons, unphosphorylated Ndel1 inhibits the capacity of dynein to transport acidic organelles. Phosphorylation of Ndel1 by Cdk5 not only reduces this inhibition but also allows Lis1 to further stimulate the cargo transport capacity of dynein. Our data raise the possibility that defects in a Lis1/Ndel1 regulatory switch could contribute to neurodegenerative diseases linked to axonal pathology in adults.
Introduction
The LIS1 protein is conserved through evolution but is best known for its role in brain development (Dobyns et al., 1993; Wynshaw-Boris, 2007; Dobyns, 2010). Mutations in LIS1 that reduce/increase protein levels cause defects in brain organization (Bi et al., 2009). Lissencephaly, or “smooth brain,” is characterized by pachygyria/agyria and fewer neurons. Patients experience neurological impairment and increasingly severe seizures, and often die due to seizure-induced aspiration. Treatment options are limited to anticonvulsants, which are often ineffective with troubling side effects.
Lis1 is well characterized at the structural and protein interaction levels. Lis1, like other members of the WD40-repeat family, forms a β-propeller protein interaction domain (Reiner et al., 1993; Tarricone et al., 2004). Of particular interest is the association of Lis1 with a microtubule motor, cytoplasmic dynein 1 (Faulkner et al., 2000; Smith et al., 2000; Tarricone et al., 2004). During brain development, Lis1 mutations affect mitosis and migration, processes requiring dynein activity (Dobyns et al., 1993; Wynshaw-Boris, 2007; Dobyns, 2010). Lis1 and dynein both interact with two related proteins, Ndel1 and NudE (Feng et al., 2000; Niethammer et al., 2000; Sasaki et al., 2000; Shu et al., 2004). In brain development, these proteins may function at different times in mitosis and migration (Feng et al., 2000; Feng and Walsh, 2004; Schaar, 2004). We have focused on Ndel1 in this study. Phosphorylation of five S/TP sites in Ndel1 by proline-directed kinases, including Cdk5, is important for its developmental functions (Yan et al., 2003; Hebbar et al., 2008). It is widely held that, together, Lis1 and Ndel1/NudE are dynein regulators, but the precise mechanisms are still being elucidated.
Most Lis1 and Ndel1 studies have been aimed at understanding their roles in the developing brain. However, fully differentiated neurons have a unique requirement for motors like dynein to carry cargo between synapses and the cell body. Axon transport is critical for neuronal function and survival, and often occurs over long distances. Dynein is the primary motor retrograde transport, while kinesins are anterograde motors (Hirokawa et al., 2010). Explorations into a potential role for Lis1 and Ndel1 in transport have produced conflicting results. Some studies showed that Lis1 perturbation influenced organelle distribution in a manner typical of dynein disruption (Smith et al., 2000; Liang et al., 2004; Ding et al., 2009; Bechler et al., 2010; Lam et al., 2010). Others did not find this (Faulkner et al., 2000; Vallee and Tsai, 2006). More recently, researchers have microinjected antibodies to acutely inhibit Lis1 and Ndel1. One study suggested that Lis1 was dispensable for retrograde transport and Lis1/Ndel1 regulated anterograde transport of dynein by kinesin (Yamada et al., 2008). Others found that injection of Ndel1 antibodies inhibited retrograde transport but induced anterograde flux of organelles near the cell body (Zhang et al., 2009). The role of Lis1 and Ndel1 in dynein-dependent axon transport in neurons from adult animals has not been studied. Here, we used RNAi and overexpression techniques in adult rat sensory neurons and, in so doing, have uncovered an interesting phosphorylation-dependent regulatory switch involving Lis1, Ndel1, and Cdk5.
Materials and Methods
Preparation of crude brain and liver extracts
Extracts from brain and liver of embryonic day 17 and 4-month-old mice were Dounce-homogenized in RIPA lysis buffer (150 mm NaCl, 1% NP-40, 0.5% sodium deoxycholate, 0.1% SDS, 2% protease inhibitor mixture III) at 4°C. Lysates were clarified at 50,000 × g for 30 min at 4°C and were analyzed by Western blotting of 10% SDS-PAGE gels.
Antibodies
Lis1 and Ndel1 rabbit polyclonal antibodies have been extensively characterized (Niethammer et al., 2000; Smith et al., 2000; Hebbar et al., 2008). These specifically and selectively recognize Lis1 and Ndel1. Anti-DIC (74.1 mouse monoclonal), anti-myc (9E10 mouse monoclonal), and anti-HA (rabbit polyclonal, mouse monoclonal) were purchased from Santa Cruz Biotechnology. A mouse anti-β-actin antibody was from Sigma-Aldrich.
Immunostaining
Neurons were plated onto 12 mm coverslips in 24-well plates. For Lis1, dynein heavy chain (DHC), and HA staining, neurons were fixed in 3% paraformaldehyde followed by permeabilization with 0.1% Triton X-100 for 5 min at room temperature. For DIC and Ndel1 staining, neurons were fixed in 100% ice-cold methanol for 1 min at −20°C. Nuclei were visualized with Hoechst and coverslips were mounted on glass slides using ProLong Gold Antifade reagent (Invitrogen). Neurons were observed using an inverted microscope (Axiovert 200; Carl Zeiss) equipped with Plan-Neo 100×/1.30 objective and a Plan-Apo 63×/1.40 objective. Digital images were acquired using a charge-coupled camera (AxioCam HRm; Carl Zeiss) linked to AxioVision software (version 4.7; Carl Zeiss).
RNAi and mammalian expression constructs
Complementary hairpin sequences in the pSilencer vector (Ambion) were provided by L. H. Tsai (MIT, Cambridge, MA) and have been well characterized (Shu et al., 2004; Hebbar et al., 2008) as follows: Lis1, GAGTTGTGCTGATGACAAG (1062–1080 bp); DHC, GAAGGTCATGAGCCAAGAA (9753–9771 bp); Ndel1, GCAGGTCTCAGTGTTAGAA (276–294 bp). Scrambled sequences were generated from these sequences and have been shown to have no effect on expression of the relevant proteins. These scrambled sequences were used as controls for each specific small hairpin RNA (shRNA). To generate HA-Lis1, HA-Lis1K147A, and HA-Lis1R212A, full-length murine Lis1 and point mutants of Lis1 (provided by A. Musacchio, European Institute of Oncology, Milan, Italy) were subcloned into a pCruzHA vector (Santa Cruz Biotechnology). Constructs for expression of myc-tagged Ndel1, Ndel11-5A, Cdk5, p25, and dncdk5 have been described previously (Nikolic et al., 1996; Niethammer et al., 2000; Hebbar et al., 2008).
Immunoprecipitation
For coimmunoprecipitation (co-IP) with the dynein intermediate chain (DIC) antibody, extracts from Cos-7 cells expressing myc-tagged Ndel1 together with HA-tagged full-length Lis1, HA-Lis1K147A, or HA-Lis1R212A were prepared in 0.1% NP-40 buffer (50 mm HEPES, 250 mm NaCl, 0.1% NP-40). Cell extracts were exposed to the 74.1 mouse monoclonal DIC antibody conjugated to agarose beads (Santa Cruz Biotechnology) for 1 h at 4°C. Precipitated proteins were analyzed by Western blotting of 10% SDS-PAGE gels. For co-IP with HA-tagged proteins, extracts were exposed to an HA polyclonal antibody (Santa Cruz Biotechnology) for 3 h at 4°C. Protein A-Sepharose beads were added to each sample for 3 h at room temperature. After washing beads, precipitated proteins were analyzed by Western blotting of 10% SDS-PAGE gels.
For the Lis1 IP from DRG cultures, cells grown for 12 h in the presence of 10 μm roscovitine or vehicle control (DMSO) were lysed in RIPA buffer (50 mm Tris, pH 8.0, 150 mm NaCl, 0.1% SDS, 1.0% NP40, 0.5% sodium deoxycholate). Extracts were incubated overnight at 4°C with a Lis1 rabbit polyclonal antibody, and then for 1 h with protein A-Sepharose. Immunoprecipitates were probed for Lis1 and Ndel1.
DRG culture and transfection
Primary cultures of sensory neurons in lumbar dorsal root ganglia (DRGs) of adult rats were prepared as described by Smith and Skene (1997) with a few minor changes. Briefly, L4–L6 sensory neurons in 2.5-month-old male Sprague Dawley rats were conditioned for rapid axon elongation by sciatic nerve crush 48 h before harvesting. Following enzymatic and mechanical dissociation, suspended cells were subjected to centrifugation through a 15% sucrose solution to reduce the numbers of smaller glial cells. Neurons were transfected immediately after dissection using the small cell number SCN Basic Nucleofector kit for primary neurons (Amaxa Biosystems; VSPI 1003). Neurons were then plated onto German glass coverslips (Fisher) coated with 10 μg/ml poly-d-lysine (Sigma-Aldrich) and 10 μg/ml laminin (Millipore). Neurons were used within 3–4 d of culture for transport studies.
Fluorescence time-lapse microscopy
After exposure to 100 nm LysoTracker Red (Invitrogen) for 20 min, coverslips were transferred into fresh medium containing 25 mm HEPES, pH 7.4, and 10 mm Oxyrase (Oxyrase, Inc.), in a water-heated custom-built microscope stage warmed to 37°C. Relatively straight, EGFP-positive axon segments that were clearly linked to a specific neuronal cell body were selected for analysis. Time-lapse microscopy was performed using Axiovert 200 inverted microscope (Carl Zeiss) equipped with C-Apo 63×/1.2 W/0.2 water-immersion objective. Digital images were acquired every 2.6 s for 4 min (92 frames) using a charge-coupled camera (AxioCam HRm; Carl Zeiss) linked to AxioVision software (version 4.7; Carl Zeiss). For some experiments, results were confirmed using a faster frame rate, so images were acquired every 500 ms for 1 min (120 frames).
Analysis of organelle movement
Two methods were used to analyze motility. (1) First, to determine the proportion of organelles that moved in different directions or remained static, kymographs were generated from time-lapse movies using NIH ImageJ software (version 1.43u) as described by Miller and Sheetz (2006). By convention, the direction toward the cell body was always to the right, so lines that sloped toward the right at any point with a net displacement of >5 μm were categorized as retrograde organelles. Lines that sloped toward the left >5 μm at any time during the recording interval were considered anterograde organelles. Lines that zigzagged were categorized as bidirectional organelles, and lines that showed <5 μm lateral displacement in any direction during the recording interval were categorized as static. To analyze overall flux, the net change in left/right position of the beginning and end of a line on the kymograph was determined. Overall retrograde flux in micrometers per minute was calculated as the sum of net rightward displacements divided by the time (4 min). Overall anterograde flux used net leftward displacements for the calculation.
(2) To analyze speed and run lengths, retrograde motile events were analyzed using ImageJ software with a manual tracking plug-in that allows retrieval of object coordinates between images frames. Tracking of individual lysosomes was performed manually throughout the time-lapse series of images. A single organelle typically exhibited motile events with intermittent pauses. If an organelle did not reach an average speed of 0.1 μm/s during three consecutive time-lapse intervals, it was taken as a pause. If the organelle moved again later, it was considered a new motile event. Thus, a single organelle could produce several retrograde motile events. Mean velocities of each retrograde motile event were averaged to obtain an estimate of the velocity for all events in all axons under a specific condition. The percentage of motile events with average velocities >0.5 μm/s was also determined. To estimate average maximum velocities, velocities for each 2.6 s interval were compared, and the single interval with the greatest velocity was considered the peak velocity for that motile event. The mean of these for all events in all axons under a specific condition provides an estimate of mean maximum velocity. Mean run length was determined by finding the average of the total run lengths of each event in a given condition.
Statistics
Rats and mice: numbers/percentage of organelles.
Kymograph data for each experiment were generated from at least three separate DRG cultures to reduce errors related to rats themselves or culture conditions. Data from the three rats, consisting of 11–12, 100 μm axon segments were obtained for each condition in a particular experiment. Significance of differences from controls was determined for anterograde, retrograde, bidirectional, and static organelles by one-way ANOVA with Dunnett's posttest using GraphPad Prism 5 for Mac OSX. Significant differences in anterograde and retrograde flux were identified in a similar manner.
Rats: kinetics of retrograde motile events.
In these studies, velocity and run length data obtained from movies of the same 11–12 axons per condition were analyzed by one-way ANOVA with Dunnett's post test in the following groups: (1) Small organelle RNAi data (DHC, LIs1, Lis1 rescue, Ndel1, Lis1 plus Ndel1, all scramble controls together); (2) large organelle RNAi data (same treatments); (3) small organelle Lis1 overexpression data (EGFP only or EGFP plus HA-Lis1, HA-K147A, or HA-R212A); (4) large organelle Lis1 overexpression data (same treatments); (5) small organelle Ndel1 and Cdk5 data (EGFP only or EGFP plus Ndel1, Ndel11-5A, Cdk5/p25, or dnCdk5); (6) large organelle Ndel1 and Cdk5 data (same treatments). All control data (from neurons expressing scrambled shRNAs or EGFP alone) were pooled for the statistical analysis calculations because the results were very similar across all controls. In treatments for which fewer than three retrograde motile events were observed in all axons segments combined, the exact significance of differences could not be determined by ANOVA, and the difference in the number of moving organelles/motile events becomes the more valuable measure.
Mice: kinetics of retrograde motile events.
Student's t tests were used to determine the significance of differences in velocity, average peak velocity, percentage >0.5 μm/s, and run lengths obtained from Lis1+/+ and Lis1+/− mice. Small organelles and large organelles were analyzed separately.
Results
Lis1 and Ndel1 expression in the adult mouse nervous system
Lis1 expression is substantial in the adult mouse brain (Fig. 1A). In contrast, expression in adult liver is much lower than in embryonic liver. Thus, the adult brain may have a unique requirement for maintaining Lis1 expression. Ndel1 is also present in adult brain, although at somewhat lower levels than in embryonic brain. No detectable Ndel1 is present in adult liver. The intermediate chain of dynein is expressed at high levels in adult brain and is also high in adult liver. This suggests the possibility that, although dynein functions in both tissues, Lis1 and Ndel1 are especially important for some aspect of dynein function in the adult brain.
Figure 1.

Characterization of acidic organelle transport in adult DRG neurons. A, Lis1, Ndel1, and DIC are detected in adult DRGs and in adult and embryonic brain extracts by Western blotting. Actin serves as a loading control. Adult liver expresses less Lis1 and Ndel1 than adult nervous tissues. B, DRG neurons labeled with LysoTracker Red. Neurons were imaged at 2 s intervals for 4 min. C, An axon segment indicated by the arrow in B was analyzed for organelle motility. The top panels show selected time-lapse images at every 30 s of the 4 min recording interval. The bottom panel shows a kymograph generated from 120 2 s frames. D, The boxed region of the same axon is enlarged and as four consecutive 2 s intervals. Some organelles moved rapidly during this time frame (arrow). Others did not move (arrowhead). Scale bars: A, 50 μm; B, 10 μm; C, 5 μm. E, The numbers of organelles that moved toward the cell body (Ant), away from the cell body (Retro), bidirectionally (Both), or made negligible moves in either direction (Static) were determined from 12 kymographs like the one in C. The bars show the mean ± 95% CI. F, The percentage of organelles that exhibited each behavior is presented as a box-and-whisker plot with means, minimum and maximum values, and upper and lower quartiles. In E and F, the significance of differences between anterograde and retrograde organelles and between retrograde and static organelles was determined by one-way ANOVA with Dunnett's posttest. ***p < 0.001, **p < 0.01, *p < 0.05.
We also found substantial Lis1 expression in lumbar DRGs, which contain peripheral sensory neurons that innervate the hindlimb. These neurons are one of the few adult neuronal subtypes that survive well in tissue culture. Adult DRG neurons can be primed to extend long axons rapidly in culture by administering a sciatic nerve lesion 48 h before harvesting (Smith and Skene, 1997). Processes extended by these neurons have axonal characteristics (Letourneau and Shattuck, 1989; De Koninck et al., 1993), including uniformly oriented microtubules with minus ends toward cell body (Baas et al., 1987).
Baseline axon transport characteristics of adult DRG neurons in culture
To look at directed organelle transport, we cultured neurons at very low densities. This had the advantage of allowing axons to be imaged in isolation from glial cells and other axons. It was also easy to find fairly straight 100 μm segments of axons to use in our studies, and to determine which axons belonged to a specific cell body to assign direction to a moving organelle. Immunofluorescence revealed that Lis1, dynein, and Ndel1 expression was maintained in axons in these sparsely seeded cultures (data not shown). In addition to sparse plating, neurons were transfected with an EGFP expression vector before plating. Only 30–40% of neurons are transfected, so EGFP-positive axons can be easily traced back to the EGFP-positive neuron. The electroporation settings used did not result in transfection of non-neuronal cells.
The vital dye LysoTracker Red was used to label acidic organelles in living neurons (Fig. 1B). Images of axons were obtained every 2.6 s for 4 min, and time-lapse movies were generated (Fig. 1C,D). Kymographs generated from the movies provide an overview of organelle motility (Fig. 1C, bottom panel). Each line represents an individual organelle. The line slope, length, and direction provide information about speed, distance, and direction of moving organelles. Organelles exhibited a range of movements, which were placed into one of four categories. Some moved exclusively in the retrograde or anterograde direction. Directed movement might only be maintained for short periods and could be interspersed by pauses. Other organelles moved steadily over the entire recording interval, without a change in speed. Organelles were categorized as bidirectional if they changed direction one or more times during the recording interval. Organelles that showed little or no movement in either direction were categorized as static. Typically, 20–30 organelles were observed per axon. In total, 291 organelles were analyzed from 12 kymographs (Table 1). Of these, 111 (38%) moved only in the retrograde direction, 39 (13%) moved only in the anterograde direction, and 56 (19%) were categorized as bidirectional. The remaining 85 organelles (30%) were stationary during the recording interval. The numbers and percentages from individual axons are shown in Figure 1, E and F. Significantly more organelles moved retrogradely than anterogradely during the recording interval. Mean retrograde flux, which measures net displacement to the right, was 55.5 ± 16.6 μm/min and mean anterograde flux (displacement to the left) was approximately eightfold lower (6.73 ± 7.7 μm/min) in these control neurons. A single organelle often exhibited “motile events” between pauses of variable lengths. Particle-tracking software was used to analyze speeds and run lengths of retrograde motile events. The average speed was 0.37 ± 0.2 μm/s, with ∼14% having average speeds >0.5 μm/s. The average peak speed was 0.59 ± 0.26 μm/s, and the average run length was 5.6 ± 2.9 μm.
Table 1.
Direction of motility for acidic organelles labeled with Lysotracker Red in DRG axons
| No. of axons | Raw no. of organelles |
Percentage per axon in each category (mean ± 95% CI) |
Static | Mean flux (μm/min) |
||||||||
|---|---|---|---|---|---|---|---|---|---|---|---|---|
| Total organelles | Retrograde | Bidirectional | Anterograde | Static | Retrograde | Bidirectional | Anterograde | Retrograde | Anterograde | |||
| EGFP OE (scr RNAis similar) | 12 | 291 | 111 | 56 | 39 | 85 | 39.6 ± 18.3 | 20.2 ± 14.6 | 12.5 ± 11.6 | 27.6 ± 18.8 | 55.5 ± 16.6 | 6.7 ± 7.7 |
| DHC RNAi | 12 | 254 | 31*** | 13*** | 4** | 206*** | 11.5 ± 11.2*** | 4.7 ± 7.8*** | 1.8 ± 2.7** | 82.0 ± 15.2*** | 5.8 ± 7.8*** | 0.07 ± 0.02*** |
| Lis1 RNAi | 12 | 281 | 50** | 22** | 21 | 188** | 19.1 ± 15.2** | 7.4 ± 8.3** | 7.0 ± 8.3 | 66.5 ± 18.9*** | 29.8 ± 12.6*** | 2.0 ± 1.0*** |
| Lis1 RNAi rescue | 12 | 317 | 108 | 49 | 14* | 146 | 34.5 ± 11.6 | 14.5 ± 8.9 | 4.3 ± 6.3 | 46.7 ± 12.1* | 65.3 ± 17.0 | 5.2 ± 3.8 |
| Ndel1 RNAi | 12 | 228 | 86 | 29* | 18 | 95 | 39.0 ± 16.5 | 13.4 ± 9.3 | 7.4 ± 4.4 | 40.2 ± 17.1 | 44 ± 11.3 | 8.2 ± 5.4 |
| Lis1, Ndel1 RNAi | 12 | 352 | 1*** | 4*** | 0*** | 347*** | 0.46 ± 1.6*** | 0.8 ± 2.8*** | 0** | 98.7 ± 3.1*** | 1.8 ± 4.1*** | 0*** |
| Lis1 OX | 11 | 260 | 151* | 49 | 21 | 39 | 59.5 ± 18.0** | 18.6 ± 9.4 | 8.1 ± 8.7 | 17.4 ± 16.9 | 100.8 ± 36*** | 2.9 ± 2.1*** |
| Lis1 K147A | 12 | 200 | 19*** | 8*** | 8** | 165* | 9.2 ± 11.3*** | 5.1 ± 6.9*** | 5.3 ± 11.1** | 80.4 ± 21.3*** | 10.2 ± 10.4*** | 0.5 ± 1.1*** |
| Lis1 R212A | 12 | 238 | 102 | 35 | 40 | 61 | 42.2 ± 17.2 | 15.2 ± 7.0 | 16.1 ± 11.1 | 26.5 ± 14.4 | 54.0 ± 15.5 | 1.4 ± 1.2 |
| Ndel1 OX | 11 | 206 | 76 | 21** | 26 | 83 | 39.0 ± 16.5 | 10.6 ± 8.8* | 11.6 ± 9.4 | 40.4 ± 15.7 | 57.5 ± 15.7 | 6.8 ± 4.0 |
| Ndel1 1-5A | 12 | 401 | 11*** | 0*** | 2*** | 388*** | 3.3 ± 6.5*** | 0*** | 0.6 ± 2.1** | 96.1 ± 7.1*** | 3.1 ± 1.4*** | 0.01 ± 0.02*** |
| dnCdK5 | 11 | 315 | 4*** | 4*** | 6** | 301*** | 1.9 ± 5.3*** | 1.2 ± 2.4*** | 2.6 ± 4.1* | 94.3 ± 9.0*** | 3.3 ± 3.1*** | 0.02 ± 0.03*** |
| cdk5/p25 OX | 12 | 274 | 109 | 45 | 40 | 80 | 39.6 ± 12.0 | 16.3 ± 9.1 | 16.0 ± 8.3 | 28.0 ± 13.0 | 55.9 ± 14.5 | 8.8 ± 6.5 |
Categories of organelles analyzed in kymographs derived from time-lapse movies. All data were obtained from analysis of 11–12 kymographs per condition. Lysosome movement was classified as retrograde if only movements toward the cell body were observed during the 4 min recording interval, anterograde if only movements away from the cell body were observed, bidirectional if the organelle changed directions at any time, or static if no movement >0.5 μm was observed in any direction. An overall anterograde and retrograde flux was calculated as the sum of net displacements divided by the total time (in minutes) of recording.
Statistical significance was determined by one-way ANOVA. ***p < 0.001, **p < 0.01, *p < 0.05. Errors are ±95% CI. If a significant change is in a transport-stimulatory direction, the asterisks are in bold.
To determine whether using a shorter frame interval in the time-lapse acquisition would change our estimates for average speed and run length, we performed a similar analysis using 0.5 s frame intervals. The results for average speed were very similar (0.37 ± 1.8 μm/s). Approximately 20% exhibited average speeds of >0.5 μm/s, and average run lengths were 3.9 ± 1.8 μm. Because the differences were not large, we chose to use the 2.6 s frame rate for the remainder of the studies because this resulted in reduced photobleaching.
Two pools of LysoTracker-labeled organelles have different kinetics
The fluorescently labeled organelles in axons could be separated into two pools based on appearance in movies and kymographs. One pool appeared large (>0.5–2 μm in diameter), and the other, small (<0.5 μm in diameter). This may be truly related to actual organelle size. Alternatively, brighter LysoTracker labeling of a more acidic pool of organelles might cause them to appear larger. For simplicity, they will be referred to as large and small pools. Regardless of the underlying reason for the difference in appearance, the two pools behaved differently. There were substantially more retrograde motile events in the small pool (806) than in the large pool (150). Moreover, the small pool exhibited higher average speeds (0.37 ± 0.21 vs 0.29 ± 0.2 μm/s) and average peak speeds (0.56 ± 0.02 vs 0.45 ± 0.03 μm/s). Approximately 10% of the small pool, but only 4% of the large pool, reached average speeds of >0.5 μm/s. Finally, mean run length of retrograde motile events was longer for the small pool (5.2 ± 2.7 vs 4.1 ± 0.8 μm). Because the two pools exhibited significantly different kinetics, all future speed and run length analyses were performed separately for large and small organelles. These data are collectively shown in Table 2.
Table 2.
Kinetics of retrograde motile events for acidic organelles moving in DRG axons
| Small organelles (<0.5 μm) |
Large organelles (0.5–2.0 μm) |
|||||||||
|---|---|---|---|---|---|---|---|---|---|---|
| No. of events | Average velocity (μm/s) | Maximum velocity (μm/s) | Percentage with AV >0.5 μm/s | Run length (μm) | No. of events | Average velocity (μm/s) | Maximum velocity (μm/s) | Percentage with AV >0.5 μm/s | Run length (μm) | |
| All controls | 806 (∼200 per experiment) | 0.37 ± 0.21 | 0.56 ± 0.02 | 9.8 ± 7.4 | 5.2 ± 2.7 | 150 (∼35 per experiment) | 0.29 ± 0.2 | 0.45 ± 0.03 | 3.6 ± 2.9 | 4.1 ± 0.8 |
| DHC RNAi | 31 | 0.23 ± 0.1*** | 0.34 ± 0.03* | 0** | 2.6 ± 1.1*** | 0 | ||||
| Lis1 RNAi | 129 | 0.26 ± 0.13*** | 0.39 ± 0.05* | 0** | 3.1 ± 1.3*** | 15 | 0.21 ± 0.05** | 0.31 ± 0.06** | 0 | 2.7 ± 1.2 |
| Lis1 RNAi rescue | 352 | 0.33 ± 0.2** | 0.49 ± 0.06 | 8.42 ± 6.1 | 4.8 ± 2.9 | 32 | 0.24 ± 0.07 | 0.36 ± 0.05 | 0 | 3.3 ± 1.4 |
| Ndel1 RNAi | 185 | 0.33 ± 0.2** | 0.49 ± 0.05 | 8.54 ± 2.8 | 4.1 ± 3.8* | 28 | 0.28 ± 0.11 | 0.39 ± 0.08 | 2.1 ± 3.6 | 3.5 ± 1.7 |
| Lis1 and Ndel1 RNAi | 1 | 0.26 | 0.29 | N/A | 2.0 | 0 | ||||
| Lis1 OX | 407 | 0.55 ± 0.19*** | 0.91 ± 0.3** | 62.7 ± 14.5*** | 11.3 ± 6.3*** | 88 | 0.37 ± 0.02*** | 0.61 ± 0.06*** | 11.4 ± 4.4* | 7.0 ± 1.7*** |
| Lis1 K147A | 48 | 0.32 ± 0.13 | 0.52 ± 0.2 | 10.3 ± 11.5 | 4.1 ± 3.05 | 3 | 0.18 ± 0.09 | 0.25 ± 0.13 | 0 | 2.2 ± 1.4 |
| Lis1 R212A | 249 | 0.33 ± 0.20 | 0.44 ± 0.23** | 10.7 ± 9.3 | 3.6 ± 3.0** | 44 | 0.30 ± 0.04 | 0.44 ± 0.05 | 7.2 ± 6.5 | 3.1 ± 0.26 |
| Ndel1 OX | 246 | 0.37 ± 0.14 | 0.56 ± 0.23 | 26.2 ± 8.1* | 5.0 ± 2.6 | 54 | 0.31 ± 0.06 | 0.49 ± 0.09 | 6.0 ± 7.68 | 4.3 ± 0.9 |
| Ndel1 1-5A | 11 | 0.19 ± 0.1** | 0.31 ± 0.14 | 0 | 2.1 ± 0.5 | 0 | ||||
| dnCdK5 | 18 | 0.29 ± 0.07 | 0.43 ± 0.13 | 0** | 3.0 ± 1.3 | 0 | ||||
| cdk5/p25 OX | 405 | 0.42 ± 0.16** | 0.60 ± 0.23 | 24.4 ± 3.5* | 4.6 ± 2.4 | 51 | 0.34 ± 0.04 | 0.48 ± 0.05 | 6.1 ± 10.5 | 3.5 ± 0.28 |
All data were obtained using manual particle-tracking software. See Materials and Methods for a description of how retrograde motile events were defined and analyzed.
Statistical significance was determined by one-way ANOVA. ***p < 0.001, **p < 0.01, *p < 0.05. Errors are ±95% CI. If a significant change is in a transport-stimulatory direction, the asterisks are in bold. If no motile events were observed, the “0” is in bold, and the other parameters are left blank.
Knockdown of DHC, or combined knockdown of Lis1 and Ndel1, strongly inhibits organelle transport
DHC is the motor subunit of the dynein holoenzyme. We used RNAi to reduce the expression of DHC, Lis1, Ndel1, or both Lis1 and Ndel1 in DRG neurons and examined organelle transport as before. The same shRNAs were previously shown to reduce in protein levels in a variety of cell types (Shu et al., 2004; Hebbar et al., 2008). In our studies, an EGFP vector was cotransfected with the shRNAs to identify transfected neurons. Decreased immunofluorescence intensity indicated that the targeted proteins were substantially reduced by 36 h after transfection (Fig. 2A–C). Scrambled shRNA sequences were used as controls.
Figure 2.

Dynein, Lis1, and Ndel1 shRNAs negatively impact organelle transport. A–C, Coexpression of EGFP (green) and shRNA targeting dynein heavy chain (DHC RNAi), Lis1 (Lis1 RNAi, or Ndel1 (Ndel1 RNAi) causes reduced expression of the specific targeted proteins (red) in axons (arrows) by 36 h. Specific scrambled control shRNAs (scr RNAi in A–C) do not produce this effect. Scale bars: A–C, 20 μm. D–F, Representative kymographs of LysoTracker-labeled organelles in axons expressing the indicated shRNAs are shown on the left. The graphs on the right show the numbers and percentages of organelles moving anterogradely, retrogradely, bidirectionally (both), or not moving (static), in 12 100 μm axon segments. G, Cotransfection of a Lis1 protein that is not targeted by the Lis1 RNAi largely rescues the Lis1 RNAi phenotype. H, I, Although the Ndel1 RNAi did not significantly alter transport (H), when both Lis1 and Ndel1 are targeted in the same neurons a more dramatic inhibition of transport was observed than for Lis1 RNAi alone (I). The significance of differences between anterograde and retrograde organelles and between retrograde and static organelles was determined by one-way ANOVA with Dunnett's posttest. ***p < 0.001, **p < 0.01, *p < 0.05.
As expected, the percentage of organelles moving retrogradely in cells with DHC knockdown was reduced relative to controls, and overall retrograde flux was 10-fold lower (Fig. 2D,E, Table 1). Unexpectedly, anterograde flux was also reduced. Lis1 RNAi reduced overall retrograde flux by nearly 50%, but again anterograde flux was also reduced (Fig. 2F, Table 1). The effect of Lis1 RNAi was largely prevented by cotransfection of a Lis1 expression construct that lacks a 3′-untranslated region and is not targeted by the shRNA. This demonstrates that Lis1 deficiency was in fact the cause of the transport inhibition (Fig. 2G, Table 1). Surprisingly, Ndel1 RNAi did not significantly alter the numbers or direction of moving organelles (Fig. 2H, Table 1), but when Ndel1 and Lis1 were targeted simultaneously, organelles transport was almost completely shut down (Fig. 2I, Table 1).
Particle-tracking software was used to estimate changes in kinetic properties of retrograde motile events following RNAi (Table 2). For small organelles, the number, average speeds, peak speeds, and run lengths of retrograde motile events were significantly reduced by DHC, Lis1, or combined Lis1/Ndel1 knockdown. None of these organelles averaged >0.5 μm/s. Ndel1 RNAi reduced average speeds, but other parameters were not significantly affected. For large organelles, no retrograde motile events were observed following DHC knockdown or combined Lis1/Ndel1 knockdown. Lis1 knockdown alone reduced the number of events, and lowered the maximum velocities attained during these events. Ndel1 knockdown alone did not have a significant impact on large organelles.
Expression of Lis1 stimulates retrograde transport
LIS1 gene duplication has been linked to human brain disease (Bi et al., 2009), so it seemed plausible that overexpression of Lis1 would disrupt axon transport. HA-tagged, full-length mouse Lis1 was cotransfected with EGFP, and LysoTracker motility studies were performed as before (Fig. 3). Somewhat surprisingly, Lis1 overexpression significantly increased the percentage of organelles moving in a “retrograde only” fashion (Fig. 3F–H, Table 1). Lis1 overexpression also significantly increased average velocities and run lengths of retrograde motile events for both small and large organelles (Table 2). For small organelles, the percentage of retrograde motile events that exhibited average velocities of >0.5 μm/s increase to >60%, and the average peak speed for retrograde runs nearly doubled, as did the overall retrograde flux (Table 1). Individually, the percentages of anterograde, bidirectional, and static organelles were not significantly reduced, suggesting that Lis1 overexpression did not draw from any specific category of organelle, but instead had a general stimulatory effect on retrograde motility.
Figure 3.

HA-tagged Lis1 and Lis1 point mutants produce distinct alterations in organelle transport when expressed in DRG neurons. A, Diagram of Lis1 protein domains. The N-terminal Lis1 homology domain (LisH) confers homodimerization. Seven WD repeats fold to form a β-propeller structure. Two point mutations, K147A and R212A, were designed to disrupt dynein and Ndel1 interactions, respectively. B, When expressed in Cos7 cells, HA-tagged wild-type Lis1 IPs both endogenous dynein (DIC) and myc-tagged Ndel1 (lanes 1 and 4). HA-tagged K147A pulls down Ndel1 but not dynein (lanes 2 and 5). HA-tagged R212A pulls down dynein but not Ndel1 (lanes 3 and 6). C, HA-Lis1 and Myc-Ndel1 coprecipitate in a DIC IP (lanes 1 and 4). HA-K147A is not coprecipitated (lanes 2 and 5). Myc-Ndel1 is also reduced in this DIC IP. R212A is pulled down in the DIC IP (lanes 3 and 6). D, Transiently expressed HA-Lis1 (WT) and R212A, but not K147A coimmunoprecipitate with endogenous dynein from Cos7 cell extracts. K147A prevented endogenous Lis1 (bottom band) from coprecipitating with dynein. E, HA-tagged Lis1 was coexpressed in DRG neurons with EGFP. HA immunofluorescence (red; WT Lis1) and EGFP (green) are shown in a fixed cell. Scale bar, 10 μm. HA-tagged mutant proteins had similar distribution (data not shown). F, Representative kymographs of axons from neurons expressing EGFP alone or in conjunction with the indicated HA-tagged Lis1 proteins. G, H, Analysis of kymographs from 12 axon segments shows that HA-Lis1 expression, but not HA-K147A or HA-R212A, increases retrograde organelle movement. HA-K147A dramatically reduces all motility. Significance of differences between anterograde and retrograde organelles and between retrograde and static organelles was determined by one-way ANOVA with Dunnett's posttest. ***p < 0.001, **p < 0.01, *p < 0.05.
Analysis of Ndel1 and dynein binding mutants of Lis1
Both dynein and Ndel1 are predicted to interact with this the β-propeller of Lis1 (Tarricone et al., 2004). Two point mutations, K147A and R212A, were predicted to have a reduced capacity to interact with dynein and Ndel1, and were tested for this study (Fig. 3A). HA-tagged versions of WT Lis1 as well as the two point mutants were expressed in Cos7 cells to examine interactions by coprecipitation studies. As predicted, HA-K147A was very limited in its capacity to pull down endogenous dynein but was able to pull down Ndel1 (Fig. 3B). In contrast, HA-R212A did not pull down Ndel1 but was able to pull down dynein. However, HA-R212A pulls down less dynein than HA-WTLis1, indicating that Ndel1 stabilizes the Lis1–dynein interaction. HA-K147A pulls down more myc-Ndel1 than HA-WTLis1, which suggests that the K147A mutant may sequester Ndel1 and prevent it from interacting with dynein. In a complementary set of IPs, a dynein antibody was able to coprecipitate HA-WTLis1 and HA-R212A, but not HA-K147A (Fig. 3C). HA-R212A may not bind as effectively to dynein because Ndel1 is thought to stabilize the Lis1–dynein interaction. Less myc-Ndel1 was present in the dynein IP from HA-K147A-expressing cells, further supporting the idea that HA-K147A sequesters Ndel1 and prevents it from interacting with dynein. Dynein immunoprecipitates from cells expressing HA-WTLis1, HA-K147A, or HA-R212A were also probed with an antibody to Lis1, which recognizes HA-tagged Lis1 constructs (Fig. 3D, top bands) and endogenous Lis1 (Fig. 3D, bottom bands). The smaller, endogenous Lis1 band was observed in dynein IPs from cells expressing HA-Lis1 or HA-R212A, but not in cells expressing HA-K147A (Fig. 3D). This indicates that the mutant Lis1 K147A protein can dimerize with endogenous Lis1 and prevent it from binding to dynein.
Dynein and Ndel1 binding are essential for the Lis1 overexpression phenotype
When LysoTracker movies were analyzed, it was clear that, unlike WT Lis1, neither of the mutant constructs increased the number or percentage of retrogradely moving organelles (Fig. 3F–H, Table 1). Moreover, the dynein-binding mutant HA-K147A had a severely disruptive effect on transport, resulting in greater than fivefold reduction in retrograde flux (Fig. 3F–H, Table 1). Anterograde flux was also significantly reduced. Expression of R212A did not impact the percentage of moving organelles nor did it impact direction. However, R212A expression did reduce the speed and run lengths for retrograde motile events associated with small organelles, while the few small organelles that were able to move in axons expressing HA-K147A moved at normal speeds and for normal distances (Table 2). Larger organelles were significantly impaired by K147A expression, moving on average much more slowly and for shorter distances (Table 2).
Ndel1 phosphorylation state impacts axonal transport
The five S/TP Cdk target sites in NDEL1/Ndel1 are shown in the schematic in Figure 4A. Both Cdk5 and Ndel1 are expressed in cell bodies and axons of adult rat DRG neurons in culture (Fig. 4B). Exposure of DRG cultures to roscovitine, a known inhibitor of Cdk5 (Gray et al., 1999; Kim and Ryan, 2010), reduced the amount of Ndel1 that coprecipitated with Lis1 from DRG culture extracts (Fig. 4C). To determine whether the five S/TP sites are important in axon transport, we compared the effect of overexpressing Ndel1 and a mutant version of the protein in which all five S/T sites have been converted to alanines. This Ndel1 construct Ndel11-5A is not phosphorylated by Cdk5 in vitro (Hebbar et al., 2008). The results from kymograph analyses were quite striking. Overexpression of WT Ndel1 had little impact on categories of organelle movements (Table 1, Fig. 4D) but did increase the percentage of retrograde motile events with average velocities of >0.5 μm/s (Table 2). In contrast, expression of Ndel11-5A essentially shut down axonal transport in both directions (Fig. 4E, Table 1). The very rare motile events were typically slower and shorter when compared with controls (Table 2). Both large and small organelles were affected.
Figure 4.

Ndel1 phosphorylation status and Cdk5 activity levels impact axonal transport in adult neurons. A, Schematic representation of Ndel1 protein domains. The central region contains five S/TP sites that are targets for cyclin-dependent kinases. C-terminal to this is a palmitoylation site (C273) that regulates dynein binding. B, Both Ndel1 and Cdk5 are present in adult DRG axons. Scale bar, 10 μm. C, Twelve hour exposure to 10 μm Cdk5 inhibitor, roscovitine, reduces the amount of Ndel1 that coprecipitates with Lis1 from DRG culture extracts. The bottom panel is a longer exposure of the Ndel1 blot to show more clearly the Ndel1 bands in the input lanes (5% of total, ∼60 μg, in input lanes). D–G, Representative kymographs and overall numbers and percentages from 12 kymographs are shown for neurons expressing the indicated constructs. D, Myc-tagged Ndel1 has little impact on numbers or directionality of moving organelles when expressed in DRG neurons. E, Ndel11-5A dramatically inhibits the number of moving organelles. F, Expression of Cdk5 and a constitutive activator, p25, does not dramatically alter numbers or direction of transport. G, Expression of a dominant-negative Cdk5 construct (dnCdk5) mimics the effect of Ndel11-5A expression. The significance of differences between anterograde and retrograde organelles and between retrograde and static organelles was determined by one-way ANOVA with Dunnett's posttest. ***p < 0.001, **p < 0.01, *p < 0.05.
We also analyzed transport in neurons expressing a dominant-negative form of Cdk5 (dnCdk5) or constitutively active Cdk5. dnCdk5 contains an R33T mutation in a putative ATP-binding site and inhibits endogenous kinase activity by sequestering cdk5 activators p35/p25 and p39 (Nikolic et al., 1996). The impact of expression of dnCkd5 was similar to Ndel11-5A, essentially shutting down transport (Fig. 4G, Table 1). Lis1 overexpression could not rescue the shut down of transport caused by either dnCdk5 or Ndel11-5A expression (data not shown). This suggests that the dynein stimulation caused by Lis1 overexpression may depend on the availability of phosphorylated Ndel1.
To express active Cdk5, the kinase was coexpressed with p25, a truncated, deregulated version of the p35 activator (Patrick et al., 1999; Cruz et al., 2006; Kanungo et al., 2009). This combination has been shown to phosphorylate Ndel1 but not Ndel11-5A in Cos-7 cells (Nikolic et al., 1996; Niethammer et al., 2000). For small organelles, Cdk5/p25 increased the average velocity of retrograde motile events (Table 2). No change was observed in numbers of moving organelles (Fig. 4F).
Sensory neurons isolated from adult heterozygous Lis1 knock-out mice display reduced retrograde transport
The mouse model for lissencephaly, PAFAH1b,neo has a deletion in one Lis1 allele (Hirotsune et al., 1998). This mouse (hereafter referred to as Lis1+/−) displays a brain development delay and is hyperexcitable (Jones and Baraban, 2007, 2009; Wang and Baraban, 2008; Greenwood et al., 2009). Adult Lis1+/− brains express approximately one-half the amount of Lis1 as wild type (Fig. 5A). In culture, adult mouse DRG axons extended by Lis1+/− neurons exhibited reduced Lis1 immunofluorescence (Fig. 5B). No obvious changes in axon growth or degree of branching were observed in Lis1+/− axons compared with controls (data not shown). However, there were significantly fewer organelles moving in the retrograde direction, and significantly more static organelles (Fig. 5C–E). Overall retrograde flux was 31.9 ± 6.7 μm/min, significantly lower than in control axons (43.6 ± 7.0 μm/min for Lis1+/+; p < 0.001). Anterograde flux was not significantly reduced (3.0 ± 1.7 vs 3.3 ± 1.8 μm/min). For both sizes of organelles, retrograde motile events in Lis1+/− axons had lower average velocities (0.37 ± 0.01 and 0.30 ± 0.01 μm/s, compared with 0.46 ± 0.05 μm/s; p < 0.05). For small organelles, the percentage of retrograde motile events that averaged speeds of >0.5 μm/s decreased from 30.1 ± 9.3% in controls to 4.0 ± 0.5% in Lis1+/− axons (p < 0.01). For large organelles, 7.1 ± 2.5% of retrograde motile events averaged speeds of >0.5 μm/s. None of the large organelles in Lis1+/− axons exhibited retrograde motile events that averaged >0.5 μm/s (p < 0.01).
Figure 5.
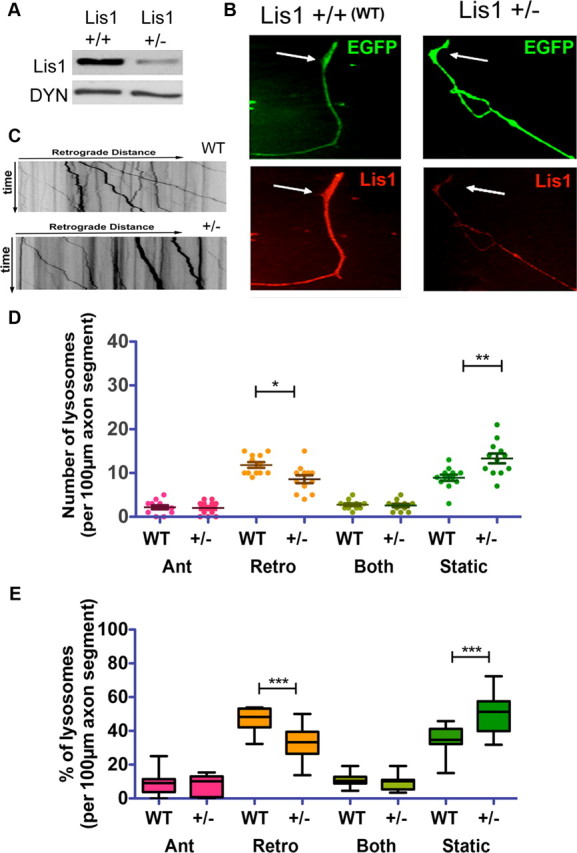
Lis1 haploinsufficiency reduces retrograde axonal transport of lysosomes. A, Reduced expression level of Lis1 in Lis1+/− mice is apparent in adult brain extract. B, An axon extended by a Lis1+/− DRG neuron has reduced Lis1 immunofluorescence (red) compared with an axon extended by a Lis1+/+ (WT) DRG neuron. C, Representative kymographs of 100 μm axon lengths from Lis1+/+ (WT) and Lis1+/− neurons. D, E, Analysis of 12 kymographs each from Lis1+/+ and Lis1+/− axons. Significance of differences between Lis1+/+ and Lis1+/− axons were determined by Student's t test. ***p < 0.001, **p < 0.01, *p < 0.05.
Discussion
Our studies using time-lapse imaging of living, adult DRG neurons provide compelling evidence of a role for Lis1, Ndel1, and Cdk5 in regulating the number of acidic organelles moving within axons, as well as the kinetics of retrograde motile events. Four manipulations severely reduced the number of moving organelles and diminished the speed and run lengths of the few detectable retrograde motile events: (1) DHC RNAi, (2) combined Lis1 and Ndel1 RNAi, (3) expression of the phosphomutant Ndel11-5A, or (4) expression of a dominant-negative Cdk5. The impact of Lis1 RNAi was less profound alone than when it was combined with Ndel1 RNAi, but was still considerable, while Ndel1 RNAi alone had only subtle effects, possibly because of the presence of the Ndel1 homolog, NudE. In contrast to Lis1 knockdown, overexpression of Lis1 stimulated retrograde transport. There was a significant increase in numbers of organelles that exhibited movement, and individual retrograde motile events were on average faster and longer. It is interesting to speculate that faster transport and greater retrograde flux could cause neuronal pathology, especially given the report that overexpressed LIS1 results in neurological disease (Bi et al., 2009). The finding that two point mutants that reduce dynein or Ndel1 binding are unable to stimulate transport indicates that the overexpressed Lis1 must have the capacity to interact with both the motor and with Ndel1 to exert its effect. The fact that the dynein-binding mutant K147A severely curtailed all transport is probably due to its ability to dimerize with endogenous Lis1 and prevent its interaction with dynein. The Ndel1 binding mutant did not severely inhibit transport, probably because it does not interfere with the endogenous Lis1 binding to dynein. Our findings are consistent with an earlier study in CV1 cells that used deletion mutants of Ndel1 that disrupted Lis1 binding or disrupted both Lis1 and dynein binding (Liang et al., 2004). In these studies, both mutants displayed defective membrane trafficking.
Because dynein is typically thought of as a retrograde motor, it was expected that only retrograde transport would be affected by manipulations that inhibit dynein, but this was not the case, as anterograde flux, albeit normally much lower than retrograde flux, was generally also reduced. It is clear that manipulations that produced a less profound inhibition of retrograde transport did not reduce anterograde transport. These include ectopic expression of myc-Ndel1, HA-R212A, and p25/Cdk5, as well as Ndel1 RNAi. This argues against a nonspecific reduction of anterograde transport caused by transfection or ectopic expression of proteins. One explanation might be that inhibiting dynein-dependent retrograde transport causes organelle accumulation and axon blockage, which subsequently inhibits anterograde trafficking. However, in our study, the degree of accumulation of acidic organelles seemed relatively modest. Another possibility is that retrograde transport of certain signals or cell components is required to induce or maintain anterograde motility. Finally, it is possible that the dynein regulatory network is directly involved in promoting anterograde transport in an as-yet-undefined fashion. Future studies should help distinguish between these possibilities.
Our studies add to the growing picture of how Lis1 and Ndel1 regulate dynein. Neither protein is absolutely required for motor function in vitro. Purified dynein motors are able to hydrolyze ATP and translocate along microtubules in the absence Lis1 or Ndel1, even when attached to relatively large polystyrene beads (King and Schroer, 2000; Mesngon et al., 2006; McKenney et al., 2010). This suggests that Lis1 and Ndel1 confer some property to dynein that is critical only within the context of a cell and, in our studies, within an axon. Intriguing hints as to what this property might be have arisen from in vitro studies. For example, we found that purified Lis1 could increase the ATPase activity of bovine brain dynein by ∼40%, but this seemed to be true for only a subset of motors (Mesngon et al., 2006). Others reported that the nucleotide state of dynein affected Lis1 binding (Yamada et al., 2008; McKenney et al., 2010), suggesting a cyclic nature to the interaction. Ndel1 interacts with dynein directly, and palmitoylation of Ndel1 at C273 in the C terminus reduces this interaction and also reduces dynein processivity (Shmueli et al., 2010). However, a recent study reported a dynein-binding domain in the first 80 aa of Ndel1 (Wang and Zheng, 2011), and other studies found that the N-terminal coiled coil is a regulated scaffold that recruits Lis1 to dynein (Derewenda et al., 2007; Zylkiewicz et al., 2011). Thus, both the C terminus and N terminus of Ndel1 are important for interactions with Lis1 and dynein. It seems likely that phosphorylation of the midregion of Ndel1 by Cdk5 may serve to coordinate these interactions to regulate axonal transport dynamics. It will be interesting to determine whether palmitoylation and phosphorylation of Ndel1 cooperate to regulate transport.
Very recently, the Ndel1 homolog, NudE, was shown to increase the stability of Lis1–dynein interactions, and together Lis1 and NudE caused dynein to attain a persistent-force-producing state (McKenney et al., 2010). The authors speculated that this allowed dynein to move large cargos. Thus, in neurons, Lis1 and Ndel1 together may facilitate cargo transport through the viscous cytoplasm and tight confines of the axon by increasing the force exerted by dynein. If the two pools of organelles we examined do reflect actual size differences, the larger organelles may require more force than the smaller organelles. This might explain why small organelles were typically more likely to exhibit retrograde motility under severe inhibitory conditions.
We know from previous studies that Ndel1 phosphorylation strengthens the interaction between Lis1 and Ndel1 (Hebbar et al., 2008). Cdk5 is critical for brain development and has been linked to organelle trafficking, so its role in acidic organelle transport is perhaps not surprising, but a role has not been described for axon transport in mature neurons (Smith and Tsai, 2002; Morfini et al., 2004). Based on our current results with the Ndel1 phosphomutant and dnCdk5, we propose a switch model for regulation of organelle transport by Cdk5 in axons. In this model, Lis1 and unphosphorylated Ndel1 interact weakly with one another and bind to dynein. In its unphosphorylated state, Ndel1 inhibits the capacity of dynein to move cargo. This would explain why expression of Ndel11-5A or dnCdk5 blocked transport. Ndel1 phosphorylation by Cdk5 acts as an “on” switch, changing the Lis1/Ndel1 complex from inhibitory to stimulatory, promoting the potential “high force” state of dynein. Ndel1 dephosphorylation would reset the motor to the “off” state. These events may occur at the beginning or ends of runs, or may occur in a cyclic fashion during runs. Because the Ndel1-binding mutant of Lis1, R212A, is unable to mimic the phenotype of WT Lis1 overexpression, an interaction with Ndel1 appears to be required for the overexpression phenotype. Although there are many possible explanations, it is likely that axons contain sufficient Ndel1 to interact with the overexpressed WT Lis1, allowing Cdk5 to stimulate transport.
Perhaps the most important information gained from our studies is the profound impact that Lis1, Ndel1, and Cdk5 have on axon transport in adult neurons. It seems likely they play similar role throughout the nervous system. This raises the possibility that defects in the Lis1/Ndel1/Cdk5 regulatory system could contribute to adult neurological disorders. Huntington's and Parkinson's diseases have been linked to defective dynein-dependent axon transport (Engelender et al., 1997; Li et al., 1998; McGuire et al., 2006; Colin et al., 2008; Zuccato et al., 2010), as have lower motor neuron diseases like amyotrophic lateral sclerosis (Nguyen et al., 2001; Hafezparast et al., 2003; Puls et al., 2003; Laird et al., 2008; Ström et al., 2008). These diseases are often characterized by cell body inclusions, axonal swellings, and axon terminal degeneration (Mateo et al., 2009). Interestingly, we have observed axonal swellings in cortical neurons expressing a Ndel1 phosphomutant (Niethammer et al., 2000), further supporting the idea that Lis1 and Ndel1 defects could contribute to or cause similar neurodegenerative disorders. The disrupted in schizophrenia 1 (DISC1) protein interacts directly with Ndel1, Lis1, and dynein (Arguello and Gogos, 2006; Bradshaw et al., 2009). Current models invoke a role for DISC1 in early brain development, but the time of onset of the disease points to late adolescent triggers, and we are intrigued by the possibility of a transport defect in schizophrenia. Finally, because organelle transport was perturbed in adult neurons from Lis1+/− mice, it is conceivable that axon transport is defective in lissencephaly patients. If so, and if this contributes to the worsening and often lethal seizures experienced by these children, treatment options may be developed to alleviate the progressive epilepsy associated with this disease.
Footnotes
This work was supported by National Institutes of Health Grant DSS-R01-NS056314 and a “Partners for Pediatric Epilepsy” grant (D.S.S.). We thank Aldo Tarricone and Andrea Musacchio for providing Lis1 point mutants, and Li-Huei Tsai for providing shRNA constructs.
References
- Arguello PA, Gogos JA. Modeling madness in mice: one piece at a time. Neuron. 2006;52:179–196. doi: 10.1016/j.neuron.2006.09.023. [DOI] [PubMed] [Google Scholar]
- Baas PW, White LA, Heidemann SR. Microtubule polarity reversal accompanies regrowth of amputated neurites. Proc Natl Acad Sci U S A. 1987;84:5272–5276. doi: 10.1073/pnas.84.15.5272. [DOI] [PMC free article] [PubMed] [Google Scholar]
- Bechler ME, Doody AM, Racoosin E, Lin L, Lee KH, Brown WJ. The phospholipase complex PAFAH Ib regulates the functional organization of the Golgi complex. J Cell Biol. 2010;190:45–53. doi: 10.1083/jcb.200908105. [DOI] [PMC free article] [PubMed] [Google Scholar]
- Bi W, Sapir T, Shchelochkov OA, Zhang F, Withers MA, Hunter JV, Levy T, Shinder V, Peiffer DA, Gunderson KL, Nezarati MM, Shotts VA, Amato SS, Savage SK, Harris DJ, Day-Salvatore DL, Horner M, Lu XY, Sahoo T, Yanagawa Y, et al. Increased LIS1 expression affects human and mouse brain development. Nat Genet. 2009;41:168–177. doi: 10.1038/ng.302. [DOI] [PMC free article] [PubMed] [Google Scholar]
- Bradshaw NJ, Christie S, Soares DC, Carlyle BC, Porteous DJ, Millar JK. NDE1 and NDEL1: multimerisation, alternate splicing and DISC1 interaction. Neurosci Lett. 2009;449:228–233. doi: 10.1016/j.neulet.2008.10.095. [DOI] [PMC free article] [PubMed] [Google Scholar]
- Colin E, Zala D, Liot G, Rangone H, Borrell-Pagès M, Li XJ, Saudou F, Humbert S. Huntingtin phosphorylation acts as a molecular switch for anterograde/retrograde transport in neurons. EMBO J. 2008;27:2124–2134. doi: 10.1038/emboj.2008.133. [DOI] [PMC free article] [PubMed] [Google Scholar]
- Cruz JC, Kim D, Moy LY, Dobbin MM, Sun X, Bronson RT, Tsai LH. p25/cyclin-dependent kinase 5 induces production and intraneuronal accumulation of amyloid β in vivo. J Neurosci. 2006;26:10536–10541. doi: 10.1523/JNEUROSCI.3133-06.2006. [DOI] [PMC free article] [PubMed] [Google Scholar]
- De Koninck P, Carbonetto S, Cooper E. NGF induces neonatal rat sensory neurons to extend dendrites in culture after removal of satellite cells. J Neurosci. 1993;13:577–585. doi: 10.1523/JNEUROSCI.13-02-00577.1993. [DOI] [PMC free article] [PubMed] [Google Scholar]
- Derewenda U, Tarricone C, Choi WC, Cooper DR, Lukasik S, Perrina F, Tripathy A, Kim MH, Cafiso DS, Musacchio A, Derewenda ZS. The structure of the coiled-coil domain of Ndel1 and the basis of its interaction with Lis1, the causal protein of Miller-Dieker lissencephaly. Structure. 2007;15:1467–1481. doi: 10.1016/j.str.2007.09.015. [DOI] [PubMed] [Google Scholar]
- Ding C, Liang X, Ma L, Yuan X, Zhu X. Opposing effects of Ndel1 and alpha1 or alpha2 on cytoplasmic dynein through competitive binding to Lis1. J Cell Sci. 2009;122:2820–2827. doi: 10.1242/jcs.048777. [DOI] [PubMed] [Google Scholar]
- Dobyns WB. The clinical patterns and molecular genetics of lissencephaly and subcortical band heterotopia. Epilepsia. 2010;51(Suppl 1):5–9. doi: 10.1111/j.1528-1167.2009.02433.x. [DOI] [PubMed] [Google Scholar]
- Dobyns WB, Reiner O, Carrozzo R, Ledbetter DH. Lissencephaly. A human brain malformation associated with deletion of the LIS1 gene located at chromosome 17p13. JAMA. 1993;270:2838–2842. doi: 10.1001/jama.270.23.2838. [DOI] [PubMed] [Google Scholar]
- Engelender S, Sharp AH, Colomer V, Tokito MK, Lanahan A, Worley P, Holzbaur EL, Ross CA. Huntingtin-associated protein 1 (HAP1) interacts with the p150Glued subunit of dynactin. Hum Mol Genet. 1997;6:2205–2212. doi: 10.1093/hmg/6.13.2205. [DOI] [PubMed] [Google Scholar]
- Faulkner NE, Dujardin DL, Tai CY, Vaughan KT, O'Connell CB, Wang Y, Vallee RB. A role for the lissencephaly gene LIS1 in mitosis and cytoplasmic dynein function. Nat Cell Biol. 2000;2:784–791. doi: 10.1038/35041020. [DOI] [PubMed] [Google Scholar]
- Feng Y, Walsh CA. Mitotic spindle regulation by Nde1 controls cerebral cortical size. Neuron. 2004;44:279–293. doi: 10.1016/j.neuron.2004.09.023. [DOI] [PubMed] [Google Scholar]
- Feng Y, Olson EC, Stukenberg PT, Flanagan LA, Kirschner MW, Walsh CA. LIS1 regulates CNS lamination by interacting with mNudE, a central component of the centrosome. Neuron. 2000;28:665–679. doi: 10.1016/s0896-6273(00)00145-8. [DOI] [PubMed] [Google Scholar]
- Gray N, Détivaud L, Doerig C, Meijer L. ATP-site directed inhibitors of cyclin-dependent kinases. Curr Med Chem. 1999;6:859–875. [PubMed] [Google Scholar]
- Greenwood JS, Wang Y, Estrada RC, Ackerman L, Ohara PT, Baraban SC. Seizures, enhanced excitation, and increased vesicle number in Lis1 mutant mice. Ann Neurol. 2009;66:644–653. doi: 10.1002/ana.21775. [DOI] [PubMed] [Google Scholar]
- Hafezparast M, Klocke R, Ruhrberg C, Marquardt A, Ahmad-Annuar A, Bowen S, Lalli G, Witherden AS, Hummerich H, Nicholson S, Morgan PJ, Oozageer R, Priestley JV, Averill S, King VR, Ball S, Peters J, Toda T, Yamamoto A, Hiraoka Y, et al. Mutations in dynein link motor neuron degeneration to defects in retrograde transport. Science. 2003;300:808–812. doi: 10.1126/science.1083129. [DOI] [PubMed] [Google Scholar]
- Hebbar S, Mesngon MT, Guillotte AM, Desai B, Ayala R, Smith DS. Lis1 and Ndel1 influence the timing of nuclear envelope breakdown in neural stem cells. J Cell Biol. 2008;182:1063–1071. doi: 10.1083/jcb.200803071. [DOI] [PMC free article] [PubMed] [Google Scholar]
- Hirokawa N, Niwa S, Tanaka Y. Molecular motors in neurons: transport mechanisms and roles in brain function, development, and disease. Neuron. 2010;68:610–638. doi: 10.1016/j.neuron.2010.09.039. [DOI] [PubMed] [Google Scholar]
- Hirotsune S, Fleck MW, Gambello MJ, Bix GJ, Chen A, Clark GD, Ledbetter DH, McBain CJ, Wynshaw-Boris A. Graded reduction of Pafah1b1 (Lis1) activity results in neuronal migration defects and early embryonic lethality. Nat Genet. 1998;19:333–339. doi: 10.1038/1221. [DOI] [PubMed] [Google Scholar]
- Jones DL, Baraban SC. Characterization of inhibitory circuits in the malformed hippocampus of Lis1 mutant mice. J Neurophysiol. 2007;98:2737–2746. doi: 10.1152/jn.00938.2007. [DOI] [PubMed] [Google Scholar]
- Jones DL, Baraban SC. Inhibitory inputs to hippocampal interneurons are reorganized in Lis1 mutant mice. J Neurophysiol. 2009;102:648–658. doi: 10.1152/jn.00392.2009. [DOI] [PMC free article] [PubMed] [Google Scholar]
- Kanungo J, Zheng YL, Amin ND, Pant HC. Targeting Cdk5 activity in neuronal degeneration and regeneration. Cell Mol Neurobiol. 2009;29:1073–1080. doi: 10.1007/s10571-009-9410-6. [DOI] [PMC free article] [PubMed] [Google Scholar]
- Kim SH, Ryan TA. CDK5 serves as a major control point in neurotransmitter release. Neuron. 2010;67:797–809. doi: 10.1016/j.neuron.2010.08.003. [DOI] [PMC free article] [PubMed] [Google Scholar]
- King SJ, Schroer TA. Dynactin increases the processivity of the cytoplasmic dynein motor. Nat Cell Biol. 2000;2:20–24. doi: 10.1038/71338. [DOI] [PubMed] [Google Scholar]
- Laird FM, Farah MH, Ackerley S, Hoke A, Maragakis N, Rothstein JD, Griffin J, Price DL, Martin LJ, Wong PC. Motor neuron disease occurring in a mutant dynactin mouse model is characterized by defects in vesicular trafficking. J Neurosci. 2008;28:1997–2005. doi: 10.1523/JNEUROSCI.4231-07.2008. [DOI] [PMC free article] [PubMed] [Google Scholar]
- Lam C, Vergnolle MA, Thorpe L, Woodman PG, Allan VJ. Functional interplay between LIS1, NDE1 and NDEL1 in dynein-dependent organelle positioning. J Cell Sci. 2010;123:202–212. doi: 10.1242/jcs.059337. [DOI] [PubMed] [Google Scholar]
- Letourneau PC, Shattuck TA. Distribution and possible interactions of actin-associated proteins and cell adhesion molecules of nerve growth cones. Development. 1989;105:505–519. doi: 10.1242/dev.105.3.505. [DOI] [PubMed] [Google Scholar]
- Li SH, Gutekunst CA, Hersch SM, Li XJ. Interaction of huntingtin-associated protein with dynactin P150Glued. J Neurosci. 1998;18:1261–1269. doi: 10.1523/JNEUROSCI.18-04-01261.1998. [DOI] [PMC free article] [PubMed] [Google Scholar]
- Liang Y, Yu W, Li Y, Yang Z, Yan X, Huang Q, Zhu X. Nudel functions in membrane traffic mainly through association with Lis1 and cytoplasmic dynein. J Cell Biol. 2004;164:557–566. doi: 10.1083/jcb.200308058. [DOI] [PMC free article] [PubMed] [Google Scholar]
- Mateo I, Vázquez-Higuera JL, Sánchez-Juan P, Rodríguez-Rodríguez E, Infante J, García-Gorostiaga I, Berciano J, Combarros O. Epistasis between tau phosphorylation regulating genes (CDK5R1 and GSK-3beta) and Alzheimer's disease risk. Acta Neurol Scand. 2009;120:130–133. doi: 10.1111/j.1600-0404.2008.01128.x. [DOI] [PubMed] [Google Scholar]
- McGuire JR, Rong J, Li SH, Li XJ. Interaction of Huntingtin-associated protein-1 with kinesin light chain: implications in intracellular trafficking in neurons. J Biol Chem. 2006;281:3552–3559. doi: 10.1074/jbc.M509806200. [DOI] [PubMed] [Google Scholar]
- McKenney RJ, Vershinin M, Kunwar A, Vallee RB, Gross SP. LIS1 and NudE induce a persistent dynein force-producing state. Cell. 2010;141:304–314. doi: 10.1016/j.cell.2010.02.035. [DOI] [PMC free article] [PubMed] [Google Scholar]
- Mesngon MT, Tarricone C, Hebbar S, Guillotte AM, Schmitt EW, Lanier L, Musacchio A, King SJ, Smith DS. Regulation of cytoplasmic dynein ATPase by Lis1. J Neurosci. 2006;26:2132–2139. doi: 10.1523/JNEUROSCI.5095-05.2006. [DOI] [PMC free article] [PubMed] [Google Scholar]
- Miller KE, Sheetz MP. Direct evidence for coherent low velocity axonal transport of mitochondria. J Cell Biol. 2006;173:373–381. doi: 10.1083/jcb.200510097. [DOI] [PMC free article] [PubMed] [Google Scholar]
- Morfini G, Szebenyi G, Brown H, Pant HC, Pigino G, DeBoer S, Beffert U, Brady ST. A novel CDK5-dependent pathway for regulating GSK3 activity and kinesin-driven motility in neurons. EMBO J. 2004;23:2235–2245. doi: 10.1038/sj.emboj.7600237. [DOI] [PMC free article] [PubMed] [Google Scholar]
- Nguyen MD, Larivière RC, Julien JP. Deregulation of Cdk5 in a mouse model of ALS: toxicity alleviated by perikaryal neurofilament inclusions. Neuron. 2001;30:135–147. doi: 10.1016/s0896-6273(01)00268-9. [DOI] [PubMed] [Google Scholar]
- Niethammer M, Smith DS, Ayala R, Peng J, Ko J, Lee MS, Morabito M, Tsai LH. NUDEL is a novel Cdk5 substrate that associates with LIS1 and cytoplasmic dynein. Neuron. 2000;28:697–711. doi: 10.1016/s0896-6273(00)00147-1. [DOI] [PubMed] [Google Scholar]
- Nikolic M, Dudek H, Kwon YT, Ramos YF, Tsai LH. The cdk5/p35 kinase is essential for neurite outgrowth during neuronal differentiation. Genes Dev. 1996;10:816–825. doi: 10.1101/gad.10.7.816. [DOI] [PubMed] [Google Scholar]
- Patrick GN, Zukerberg L, Nikolic M, de la Monte S, Dikkes P, Tsai LH. Conversion of p35 to p25 deregulates Cdk5 activity and promotes neurodegeneration. Nature. 1999;402:615–622. doi: 10.1038/45159. [DOI] [PubMed] [Google Scholar]
- Puls I, Jonnakuty C, LaMonte BH, Holzbaur EL, Tokito M, Mann E, Floeter MK, Bidus K, Drayna D, Oh SJ, Brown RH, Jr, Ludlow CL, Fischbeck KH. Mutant dynactin in motor neuron disease. Nat Genet. 2003;33:455–456. doi: 10.1038/ng1123. [DOI] [PubMed] [Google Scholar]
- Reiner O, Carrozzo R, Shen Y, Wehnert M, Faustinella F, Dobyns WB, Caskey CT, Ledbetter DH. Isolation of a Miller-Dieker lissencephaly gene containing G protein beta-subunit-like repeats. Nature. 1993;364:717–721. doi: 10.1038/364717a0. [DOI] [PubMed] [Google Scholar]
- Sasaki S, Shionoya A, Ishida M, Gambello MJ, Yingling J, Wynshaw-Boris A, Hirotsune S. A LIS1/NUDEL/cytoplasmic dynein heavy chain complex in the developing and adult nervous system. Neuron. 2000;28:681–696. doi: 10.1016/s0896-6273(00)00146-x. [DOI] [PubMed] [Google Scholar]
- Schaar BT. Cortical development deNUDEd. Neuron. 2004;44:213–214. doi: 10.1016/j.neuron.2004.10.002. [DOI] [PubMed] [Google Scholar]
- Shmueli A, Segal M, Sapir T, Tsutsumi R, Noritake J, Bar A, Sapoznik S, Fukata Y, Orr I, Fukata M, Reiner O. Ndel1 palmitoylation: a new mean to regulate cytoplasmic dynein activity. EMBO J. 2010;29:107–119. doi: 10.1038/emboj.2009.325. [DOI] [PMC free article] [PubMed] [Google Scholar]
- Shu T, Ayala R, Nguyen MD, Xie Z, Gleeson JG, Tsai LH. Ndel1 operates in a common pathway with LIS1 and cytoplasmic dynein to regulate cortical neuronal positioning. Neuron. 2004;44:263–277. doi: 10.1016/j.neuron.2004.09.030. [DOI] [PubMed] [Google Scholar]
- Smith DS, Skene JH. A transcription-dependent switch controls competence of adult neurons for distinct modes of axon growth. J Neurosci. 1997;17:646–658. doi: 10.1523/JNEUROSCI.17-02-00646.1997. [DOI] [PMC free article] [PubMed] [Google Scholar]
- Smith DS, Tsai LH. Cdk5 behind the wheel: a role in trafficking and transport? Trends Cell Biol. 2002;12:28–36. doi: 10.1016/s0962-8924(01)02181-x. [DOI] [PubMed] [Google Scholar]
- Smith DS, Niethammer M, Ayala R, Zhou Y, Gambello MJ, Wynshaw-Boris A, Tsai LH. Regulation of cytoplasmic dynein behaviour and microtubule organization by mammalian Lis1. Nat Cell Biol. 2000;2:767–775. doi: 10.1038/35041000. [DOI] [PubMed] [Google Scholar]
- Ström AL, Shi P, Zhang F, Gal J, Kilty R, Hayward LJ, Zhu H. Interaction of amyotrophic lateral sclerosis (ALS)-related mutant copper-zinc superoxide dismutase with the dynein-dynactin complex contributes to inclusion formation. J Biol Chem. 2008;283:22795–22805. doi: 10.1074/jbc.M800276200. [DOI] [PMC free article] [PubMed] [Google Scholar]
- Tarricone C, Perrina F, Monzani S, Massimiliano L, Kim MH, Derewenda ZS, Knapp S, Tsai LH, Musacchio A. Coupling PAF signaling to dynein regulation: structure of LIS1 in complex with PAF-acetylhydrolase. Neuron. 2004;44:809–821. doi: 10.1016/j.neuron.2004.11.019. [DOI] [PubMed] [Google Scholar]
- Vallee RB, Tsai JW. The cellular roles of the lissencephaly gene LIS1, and what they tell us about brain development. Genes Dev. 2006;20:1384–1393. doi: 10.1101/gad.1417206. [DOI] [PubMed] [Google Scholar]
- Wang S, Zheng Y. Identification of a novel dynein binding domain in nudel essential for spindle pole organization in Xenopus egg extract. J Biol Chem. 2011;286:587–593. doi: 10.1074/jbc.M110.181578. [DOI] [PMC free article] [PubMed] [Google Scholar]
- Wang Y, Baraban SC. Aberrant dentate gyrus cytoarchitecture and fiber lamination in Lis1 mutant mice. Hippocampus. 2008;18:758–765. doi: 10.1002/hipo.20434. [DOI] [PubMed] [Google Scholar]
- Wynshaw-Boris A. Lissencephaly and LIS1: insights into the molecular mechanisms of neuronal migration and development. Clin Genet. 2007;72:296–304. doi: 10.1111/j.1399-0004.2007.00888.x. [DOI] [PubMed] [Google Scholar]
- Yamada M, Toba S, Yoshida Y, Haratani K, Mori D, Yano Y, Mimori-Kiyosue Y, Nakamura T, Itoh K, Fushiki S, Setou M, Wynshaw-Boris A, Torisawa T, Toyoshima YY, Hirotsune S. LIS1 and NDEL1 coordinate the plus-end-directed transport of cytoplasmic dynein. EMBO J. 2008;27:2471–2483. doi: 10.1038/emboj.2008.182. [DOI] [PMC free article] [PubMed] [Google Scholar]
- Yan X, Li F, Liang Y, Shen Y, Zhao X, Huang Q, Zhu X. Human Nudel and NudE as regulators of cytoplasmic dynein in poleward protein transport along the mitotic spindle. Mol Cell Biol. 2003;23:1239–1250. doi: 10.1128/MCB.23.4.1239-1250.2003. [DOI] [PMC free article] [PubMed] [Google Scholar]
- Zhang Q, Wang F, Cao J, Shen Y, Huang Q, Bao L, Zhu X. Nudel promotes axonal lysosome clearance and endo-lysosome formation via dynein-mediated transport. Traffic. 2009;10:1337–1349. doi: 10.1111/j.1600-0854.2009.00945.x. [DOI] [PubMed] [Google Scholar]
- Zuccato C, Valenza M, Cattaneo E. Molecular mechanisms and potential therapeutical targets in Huntington's disease. Physiol Rev. 2010;90:905–981. doi: 10.1152/physrev.00041.2009. [DOI] [PubMed] [Google Scholar]
- Zylkiewicz E, Kijanska M, Choi WC, Derewenda U, Derewenda ZS, Stukenberg PT. The N-terminal coiled-coil of Ndel1 is a regulated scaffold that recruits LIS1 to dynein. J Cell Biol. 2011;192:433–445. doi: 10.1083/jcb.201011142. [DOI] [PMC free article] [PubMed] [Google Scholar]