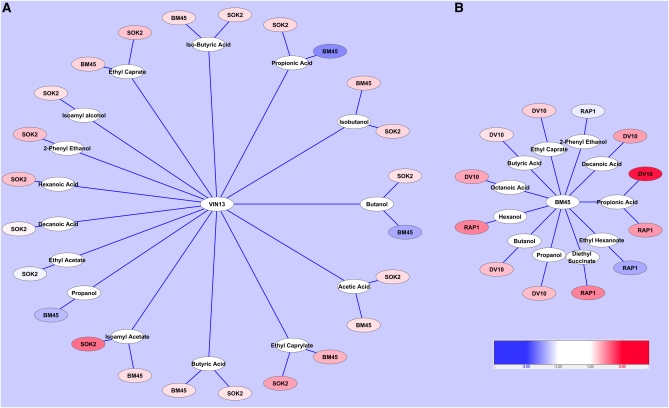
Figure 3 .
Statistically significant changes in aroma compounds among control, target, and transformed strains on day 14 of fermentation. (A) The levels of aroma compounds from both the target strain (BM45) and the SOK2-overexpression strain that were shown to be statistically significantly different from the control (VIN13). (B) The levels of aroma compounds from both the target strain (DV10) and the RAP1-overexpression strain that were shown to be statistically significantly different from the control (BM45). The degree of fold change is represented by red (positive) and blue (negative) color scales.

