

Abstract
Context
Payers, policy makers, and professional organizations have launched a variety of initiatives aimed at improving hospital quality with inpatient surgery. Despite their obvious benefits for patients, the likely impact of these efforts on healthcare costs is uncertain. In this context, we examined relationships between hospital outcomes and expenditures in the US Medicare population.
Patients and methods
Using the 100% national claims files, we identified all US hospitals performing coronary artery bypass (CABG), total hip replacement (THR), abdominal aortic aneurysm (AAA) repair, or colectomy procedures between 2005 and 2007. For each procedure, we ranked hospitals by their risk- and reliability-adjusted outcomes (complication and mortality rates, respectively) and sorted them into quintiles. We then examined relationships between hospital outcomes and risk-adjusted, 30-day episode payments.
Results
There was a strong, positive correlation between hospital complication rates and episode payments for all procedures. With CABG, for example, hospitals in the highest complication quintile had average payments that were $5,353 per patient higher than at hospitals in the lowest quintile ($46,024 vs. $40,671, p<0.001). Payments to hospitals with high complication rates were also higher for colectomy ($2,719 per patient), AAA repair ($5,279) and hip replacement ($2,436). Higher episode payments at lower quality hospitals were attributable in large part to higher payments for the index hospitalization, though 30-day readmissions, physician services, and post-discharge ancillary care also contributed. Despite the strong association between hospital complication rates and payments, hospital mortality was not associated with expenditures.
Conclusions
Medicare payments around episodes of inpatient surgery are substantially higher at hospitals with high complications. These findings suggest that local, regional, and national efforts aimed at improving surgical quality may ultimately reduce costs as well as improve outcomes.
Introduction
With growing recognition that hospital outcomes with inpatient surgery vary widely, payers, policy makers, and professional organizations have launched a variety of efforts aimed at improving patient outcomes with inpatient surgery.1 Some initiatives, including public reporting and payers’ centers of excellence programs, are hoping to encourage selective referral of surgical patients to higher-quality hospitals. 2_ENREF_2 Others aim to achieve broader-based quality improvement. Among many examples, the Center for Medicare and Medicaid Services and many private payers have enacted pay for performance programs to enhance hospital compliance with evidence-based perioperative care and, in some instances, large collaborative quality improvement initiatives. 3,4_ENREF_4 Professional organizations, including the Society for Thoracic Surgeons and American College of Surgeons, are disseminating outcomes reporting and feedback systems, like the National Surgical Quality Improvement Program (NSQIP). 5
Despite the obvious value of these programs for surgical patients, their likely effects on healthcare costs are uncertain. Relationships between hospital quality and payments for inpatient surgery are not well characterized. On the one hand, caring for patients with postoperative complications is resource intensive and expensive. According to one study, the average cost of surgical complications exceeded $10,000, most of which is passed along to payers. 6 Such data imply that higher-quality hospitals would tend to be associated with higher expenditures. On the other hand, achieving superior outcomes in surgery may require that hospitals invest in expensive resources, such as intensivist-staffed intensive care units, high nurse-to-bed ratios, advanced technology, and specialist services. 7,8 To the extent that such investments are directly or indirectly passed along to payers, higher quality of hospitals would tend to have higher expenditures.
A better understanding of relationships between hospital quality and payments would be essential for anticipating the financial consequences of selective referral and quality improvement initiatives focused on inpatient surgery. In this context, we studied relationships between hospital outcomes and 30-day Medicare payments in patients undergoing 4 common inpatient procedures.
Methods
Subjects and databases
This study was based on complete Medicare claims data for patients undergoing selected inpatient procedures between 2005 and 2007. Because services provided to Medicare managed care patients are not consistently captured in claims files, such patients (approximately 16%) were excluded from our study. We also excluded patients less than 65 years of age or over 99 and those not enrolled in both Medicare parts A and B at the time of their procedures (approximately 4%). Finally, to avoid skewing our accounting of payments for post-discharge ancillary care, we excluded the small percentage (<1%) of patients who were nursing home residents or in hospice before surgery.
We focused on patients undergoing the following 4 procedures: coronary artery bypass grafting (CABG), elective hip replacement, elective abdominal aortic aneurysm (AAA) repair, and colectomy. Patients undergoing each procedure were identified from the Inpatient file based on the presence of the appropriate procedure codes from the International Classification of Diseases, version 9. To enhance the homogeneity of our study cohorts, patients undergoing percutaneous coronary interventions and/or valve procedures during the same admission were excluded from the CABG cohort. For similar reasons, patients with ruptured and thoracoabdominal aneurysms were excluded from the elective AAA cohort, as were patients with hip fractures from the hip replacement cohort. The colectomy sample was restricted to patients with codes indicating colon cancer, the most common indication for this procedure. The study cohorts included patients undergoing the four procedures between January 1, 2005 and November 30, 2007. To ensure complete, postoperative payment data, we did not include patients having surgery in December, 2007.
Assessing hospital quality
Hospital quality, the main exposure variable in this analysis, was assessed in terms of both complication rates and mortality. Because we hypothesized that cost-outcome relationships may differ between the two types of outcomes, we conducted these analyses sequentially based on separate hospital rankings.
In determining hospital mortality rates, we identified all deaths occurring before hospital discharge or within 30 days of the index procedure. Case mix adjustment was performed using multiple logistic regression, accounting for clustering of patients within hospitals. We adjusted for patient age, gender, race, admission acuity, and preoperative length of stay. To account for differences in procedure mix (e.g., 2-vessel vs. 4-vessel CABG), our models included the primary procedure code. Using codes developed by Elixhauser et al.,9 individual comorbidities were also considered for inclusion in the risk adjustment models. To minimize chance variation, hospital mortality rates were reliability-adjusted, using methods described in detail elsewhere. 10 The net effect of reliability adjustment is to regress the mortality rates of small hospitals toward the overall mean and place disproportionately greater weight on the more reliable mortality rates of hospitals with larger caseloads. Finally, hospitals were ranked by their risk- and reliability-adjusted mortality rates and sorted into quintiles.
Hospitals were ranked and sorted by their complication rates in analogous fashion. As in our previous work,11 complications were determined using a subset of serious complications from the Complication Screening Project of Iezzoni et al., believed to have acceptable sensitivity and specificity based on medical chart review, including pulmonary failure, pneumonia, myocardial infarction, deep venous thrombosis/pulmonary embolism, acute renal failure, postoperative hemorrhage, surgical site infection, and gastrointestinal bleeding.12,13
Hospital rankings were conducted separately for each procedure. Since hospital outcomes are not perfectly correlated across specialties, individual hospitals often appeared in different quality quintiles, depending on procedure.
Calculation of Medicare payments
We focused on payments, not submitted charges. Consistent with MedPAC’s approach, we extracted payment information for all service types from the date of hospital admission for the index procedure, to 30 days from the hospital discharge date. Payment data were abstracted from the inpatient, outpatient, carrier (i.e., physician), home health, skilled nursing facility, long stay hospital, hospice, and durable medical equipment files. Payment data obtained from these files were then collapsed into 4 discrete categories: index hospitalization, readmissions, physician services, and post-discharge ancillary care.
For the index hospitalization, we included both the DRG payment plus outlier payments when present, as described previously.14 DRG payments were determined from the Medicare Price Amount, which reflects the actual hospital payment amount plus any applicable patient liability amounts. Payments for readmissions were determined in similar fashion. We included all hospital payments for unplanned readmissions initiated within 30 days of discharge after the index procedure, even when hospital stays extended beyond that time window. For payments to home health care and rehabilitation hospitals, however, we prorated the episode price amount to include only payments occurring within our 30-day window. Payments to skilled nursing facilities were determined based on per diem payments occurring within the same time window.
Analysis
We used multiple logistic regression to assess relationships between hospital mortality and episode payments, and between hospital complication rates and payments. Quintiles of risk-adjusted hospital mortality and complication rates, respectively, served as the exposure variable in this analysis. Episode payments, with and without price standardization, were examined at the patient level. In assessing relationships between hospital outcomes and payments, we adjusted for patient characteristics, using robust standard errors to account for clustering of outcomes within hospitals.
We used sensitivity analysis to assess the robustness of our findings in two regards. First, in estimating episode payments, we examined the effects of price standardization and removing intended sources of variation in hospital payments. These include adjustments made by CMS for regional prices and cost of living, direct and indirect costs of graduate medical education, and caring for the uninsured (so-called disproportionate share payments). Price standardization was conducted using methods previously described by our group, 14 which were in turn derived from methods developed by the Dartmouth Atlas of Health Care.15 After price-standardization, relationships between hospital outcomes and payments were slightly weaker than in our main analysis, suggesting that hospitals with higher unit prices had on average higher complication and mortality rates. Because these findings did not alter our main conclusions, however, they are not presented herein.
Second, we recalculated 30-day episode payments after removing post-discharge services performed for diagnoses likely unrelated to the index inpatient procedure. Such services accounted for less than 5% of total episode payments and their exclusion did not alter conclusions from the main analysis.
This study was judged exempt from human subject review by the Institutional Review Board of the University of Michigan.
Results
Hospitals were ranked and sorted into quintiles by their risk- and reliability-adjusted rates of mortality and complications. As seen in Table 1, predicted risks of each outcome type varied little across hospital quintiles, indicating very small differences in case mix across hospitals. In contrast, actual rates of mortality and complications varied widely across hospital quintiles. With colectomy, for example, complication rates varied from 12.6% to 28.8% from the lowest to highest hospital quintile.
Table 1.
Predicted and actual outcome rates for hospitals performing 4 common inpatient procedures, stratified by quintiles of hospitals ranked on risk- and reliability-adjusted mortality and complication rates, respectively. Based on 2005–7 national Medicare data.
| Hospital Quintiles | |||||
|---|---|---|---|---|---|
| 1 | 2 | 3 | 4 | 5 | |
| CABG (1,060 hospitals, 221,894 patients) | |||||
| Risk adjusted mortality | |||||
| Predicted mortality | 3.90% | 3.75% | 3.77% | 3.60% | 3.67% |
| Actual mortality | 1.90% | 2.93% | 3.70% | 4.47% | 6.54% |
| Risk adjusted complication rates | |||||
| Predicted rate | 22.1% | 22.3% | 22.5% | 22.9% | 23.6% |
| Actual rate | 15.3% | 19.5% | 22.1% | 25.6% | 32.7% |
|
| |||||
| Colectomy (1,227 hospitals, 73,772 patients) | |||||
| Risk adjusted mortality | |||||
| Predicted mortality | 5.70% | 5.88% | 5.80% | 5.92% | 6.16% |
| Actual mortality | 2.11% | 4.02% | 5.62% | 7.53% | 10.92% |
| Risk adjusted complication rates | |||||
| Predicted rate | 19.9% | 20.3% | 20.0% | 20.0% | 20.8% |
| Actual rate | 12.6% | 16.8% | 19.6% | 22.8% | 28.8% |
|
| |||||
| AAA repair (728 hospitals, 57,522 patients) | |||||
| Risk adjusted mortality | |||||
| Predicted mortality | 2.96% | 2.69% | 2.68% | 2.87% | 2.85% |
| Actual mortality | 0.96% | 1.58% | 2.66% | 3.96% | 5.79% |
| Risk adjusted complication rates | |||||
| Predicted rate | 15.1% | 15.4% | 15.3% | 15.5% | 15.7% |
| Actual rate | 9.2% | 12.7% | 15.2% | 17.6% | 22.7% |
|
| |||||
| Hip replacement (1,839 hospitals, 219,777 patients) | |||||
| Risk adjusted mortality | |||||
| Predicted mortality | 0.44% | 0.47% | 0.44% | 0.45% | 0.50% |
| Actual mortality | 0.06% | 0.05% | 0.05% | 0.58% | 1.43% |
| Risk adjusted complication rates | |||||
| Predicted rate | 4.10% | 4.12% | 4.29% | 4.28% | 4.59% |
| Actual rate | 1.66% | 2.78% | 3.89% | 5.20% | 8.78% |
Hospital complication rates were strongly correlated with risk-adjusted episode payments for each procedure. (Figure 1) With CABG, for example, hospitals in the highest complication quintile had average payments that were $, $5,353 (13%) per patient higher than at hospitals in the lowest quintile ($40,671 vs. $46,024, p<0.001). Payments to hospitals with high complication rates were also higher for colectomy ($2,719 per patient), AAA repair ($5,279) and hip replacement ($2,436).
Figure 1.
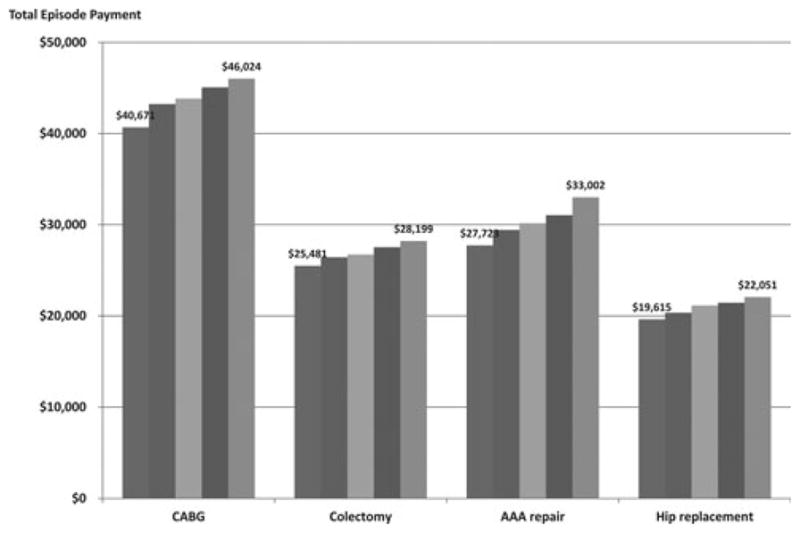
Relationships between hospital complication rates (both risk and reliability adjusted) and average, risk adjusted episode payments with 4 inpatient procedures. Based on 2005–7 national Medicare data.
The types of services accounting for higher payments at hospitals with high complication rates varied by procedure. (Table 2) Payments for the index hospitalization accounted for the majority of increased payments for all procedures except hip replacement (which is associated with only one DRG level). For example, payments for the index hospitalization explained 70.3% of the excess payments to hospitals with high complication rates with AAA repair. Post-discharge ancillary care, including rehabilitation services, accounted for 50.2% of excess payments with hip replacement, but a much smaller share of expenditures with the other 3 procedures. Surprisingly, thirty-day readmissions explained only 6.8% to 15.2% (depending on procedure) of increased average payments at hospitals with higher complication rates. Physician services accounted for a similar proportion of increased payments associated with hospital complication rates.
Table 2.
Average, risk-adjusted Medicare payments for different components of care at hospitals in the highest and lowest quintiles of risk adjusted complication rates. Based on 2005–7 national Medicare data.
| Hospital quintile of risk adjusted complication rates | ||||
|---|---|---|---|---|
| Lowest | Highest | Difference in payments | Proportion of total difference attributable to each cost category | |
| CABG | ||||
| Index hospitalization | $30,152 | $33,635 | $3,483 | 65.1% |
| Readmissions | $2,032 | $2,398 | $366 | 6.8% |
| Physician services | $4,820 | $5,568 | $748 | 14.0% |
| Post-discharge ancillary care | $3,667 | $4,423 | $756 | 14.1% |
| Total episode | $40,671 | $46,024 | $5,353 | 100% |
|
| ||||
| Colectomy | ||||
| Index hospitalization | $18,124 | $19,652 | $1,529 | 56.2% |
| Readmissions | $1,322 | $1,736 | $414 | 15.2% |
| Physician services | $3,405 | $3,837 | $432 | 15.9% |
| Post-discharge ancillary care | $2,631 | $2,975 | $344 | 12.6% |
| Total episode | $25,481 | $28,199 | $2,719 | 100% |
|
| ||||
| AAA repair | ||||
| Index hospitalization | $21,546 | $25,258 | $3,712 | 70.3% |
| Readmissions | $1,237 | $1,593 | $356 | 6.7% |
| Physician services | $3,405 | $3,856 | $451 | 8.5% |
| Post-discharge ancillary care | $1,535 | $2,296 | $761 | 14.4% |
| Total episode | $27,723 | $33,002 | $5,279 | 100% |
|
| ||||
| Hip replacement | ||||
| Index hospitalization | $10,952 | $11,670 | $719 | 29.5% |
| Readmissions | $763 | $1,014 | $251 | 10.3% |
| Physician services | $2,093 | $2,337 | $244 | 10.0% |
| Post-discharge ancillary care | $5,807 | $7,030 | $1,223 | 50.2% |
| Total episode | $19,615 | $22,051 | $2,436 | 100% |
In contrast to the strong association between complications and payments, hospital mortality was not related to expenditures. As seen in Figure 2, average episode payments were essentially flat across quintiles of risk- and reliability-adjusted hospital mortality for each procedure.
Figure 2.
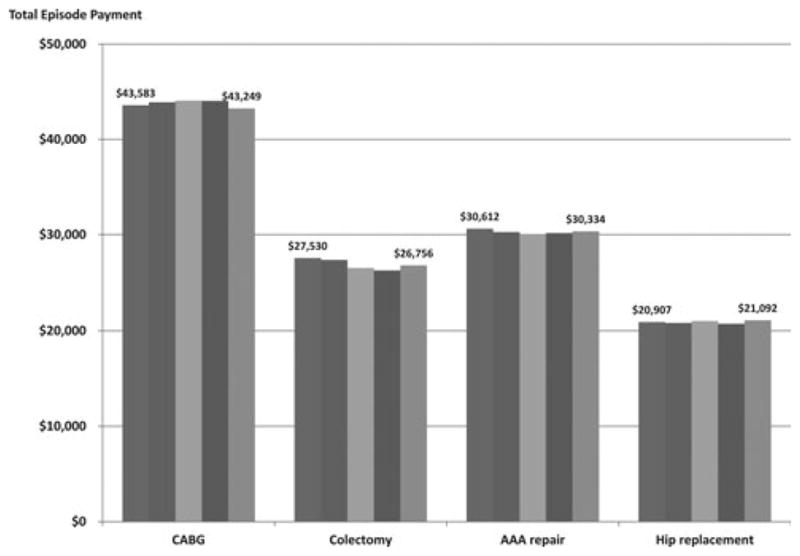
Relationships between hospital mortality (both risk and reliability adjusted) and average, risk adjusted episode payments with 4 inpatient procedures. Based on 2005–7 national Medicare data.
Discussion
Findings from this study suggest a relationship between hospital quality and cost with inpatient surgery. Hospitals with higher complication rates had total episode costs that were approximately $2,436 to $5,353 higher than those with lower rates, depending on procedure, accounting for 11–19% of total episode payments. Since over 45 million procedures are performed each year in US hospitals, 16 even small improvements in efficiency—through quality improvement or other means—would be associated with substantial savings at the population level.
It is not surprising that complications are associated with increased costs. Dimick et al. used resource-based cost accounting methods to assess the financial impact of complications after general and vascular surgery at a large referral center. Although some types of complications were more costly than others,17 the average cost exceeded $10,000, the large majority of which was passed along to payers. 6 Since this study assessed only facility costs related to the initial hospitalization, however, it undoubtedly underestimated the true cost associated with adverse outcomes after inpatient surgery. As reflected in our findings, physician services, readmissions, and post-discharge ancillary care also contribute significantly to the increased costs associated with surgical complications.
While complications are clearly associated with increased costs for individual patients, there has been surprisingly little research examining relationships between quality and costs at the hospital level. Previous work by our group documented that lower-quality hospitals with CABG had higher rates of so-called outlier payments, one important component of facility reimbursement for patients with complicated hospital stays. 18 In another study, lower-quality hospitals with kidney transplantation had episode payments that were $1,185 higher than at higher-quality centers. 19 Finally, Ho and Aloia studied relationships between procedure volume—a surrogate of quality—and costs with inpatient cancer surgery. 20 Higher-volume surgeons had substantially lower costs for most procedures, while associations between hospital volume and costs were weaker and inconsistent across procedures.
In contrast to the strong relationships between hospital complication rates and costs, hospitals with higher mortality did not have significantly higher payments around surgical episodes. Among potential explanations for this null finding, surgical deaths may simply be too infrequent to have an important impact on average payments. So-called “failure to rescue” is another possible reason. A hospital’s mortality rate reflects not only how frequently its patients experience major complications, but also how successfully it manages patients once complications occur.21 Although patients with complications are uniformly more expensive than those without such events, patients who die after complications may be less expensive than patients who are “rescued” after complications, who often require long stays in the intensive care unit and other expensive resources.
An important limitation of this study is its reliance on claims data and the attendant risks of confounding by differences in case mix across hospitals. In other words, some hospitals could have both higher complication rates and higher episode payments because they care for “sicker” patients. Although we found no important differences in measurable risk factors across hospital groups, we cannot exclude the possibility of unmeasured differences in illness severity across hospitals. To minimize this risk, we applied numerous restrictions to make our procedure cohorts as homogenous as possible and applied risk adjustment to both hospital outcomes and costs. In addition to accounting for the measurable clinical characteristics of patients at the time of surgery, we adjusted for their expenditures in the six months prior to surgery. We would expect this latter adjustment to capture aspects of patients’ health related to both their risks of complications and their “costliness.” While we do not believe that confounding by case mix explains the main findings of this study, payers and policy makers will nonetheless need to be careful that bundled payment policies do not unfairly penalize hospitals caring for sicker patient or otherwise encourage “gaming” (e.g., surgeons avoiding high-risk patients).
Another limitation pertains to the coding of postoperative complications in claims data, which is often imprecise or incomplete.22_ENREF_14_ENREF_14 To minimize problems in this regard, we limited our assessment to a subset of serious, relatively discrete complications. Random errors in the coding of these complications would be expected to bias our results toward the null hypothesis—no differences in episode. It is conceivable that high-cost hospitals code complications more diligently to enhance DRG assignment and payments, but simple upcoding cannot explain their higher payments for physician services, readmissions, and post-discharge care.
Policy implications
Findings from this study have direct implications for ongoing initiatives aimed at improving surgical quality and reducing costs. For many years, payers and purchasers have been encouraging selective referral of patients requiring certain high-risk procedures to higher-quality hospitals, through public reporting, so-called Centers of Excellence programs, and patient-directed financial incentives. 2 In addition to improving patient outcomes, our findings suggest that such initiatives have the potential to steer patients to lower-cost hospitals, particularly if based on quality measures that incorporate hospital complication rates.
Our findings also have implications for episode-based bundled payments for inpatient surgery, now being implemented by the Center for Medicare and Medicaid Services and other payers.23,24 By lumping reimbursements for inpatient surgery into a single payment to hospitals, physicians and other caregivers, bundled payments are intended to provide new incentives for providers to work together in coordinating care, improving quality, and eliminating unnecessary costs. Of course, results from this study do not suggest that cutting payments to health systems with high average episode payments would lead directly to better outcomes—any more than cutting budgets at high-cost, poorly-performing schools would lead directly to better student test scores. Nonetheless, our analysis indicates that the “pain” of bundled payments will be borne disproportionately by hospitals with higher complication rates, which, at the very least, will foster stronger incentives toward improvement.
Finally, and perhaps most importantly, results from this study suggest the “business case” for local, regional, and national initiatives aimed at improving surgical quality. Quality measurement and improvement initiatives led by professional organizations and payers have had demonstrable effects in improving patient outcomes with inpatient surgery. The dissemination of such initiatives has been limited by their costs, however. For example, the cost of hospital participation in ACS-NSQIP or one of the Michigan collaborative improvement programs is often as high as $200 a patient. 4 Findings from this study — that poor quality may add thousands to average payments around episodes of inpatient surgery—suggest that the current cost of quality measurement and improvement may be a bargain.
Acknowledgments
This work was supported by funding from the National Institute on Aging to Dr. Skinner (P01AG019783-07S1). Drs. John Birkmeyer and Dimick have equity interests in ArborMetrix, Inc., which provides software and services for profiling hospital quality and episode cost-efficiency. The company was not involved with the manuscript herein in any way.
References
- 1.Birkmeyer NJO, Birkmeyer JD. Strategies for Improving Surgical Quality - Should Payers Reward Excellence or Effort? [Miscellaneous] New England Journal of Medicine. 2006;354(8):864–870. doi: 10.1056/NEJMsb053364. [DOI] [PubMed] [Google Scholar]
- 2.Birkmeyer JD, Dimick JB, Birkmeyer JD, Dimick JB. Potential benefits of the new Leapfrog standards: effect of process and outcomes measures.[see comment] Surgery. 2004 Jun;135(6):569–575. doi: 10.1016/j.surg.2004.03.004. [DOI] [PubMed] [Google Scholar]
- 3.Rosenthal MB, Frank RG, Li Z, Epstein AM. Early experience with pay for performance: From concept to practice. JAMA. 2005;294:1788–1793. doi: 10.1001/jama.294.14.1788. [DOI] [PubMed] [Google Scholar]
- 4.Share D, Campbell DA, Jr, Birkmeyer NJ, et al. How a regional collaborative of hospitals and physicians in Michigan cut costs and improved the quality of care. Health Aff (Millwood) 2011;30:636–645. doi: 10.1377/hlthaff.2010.0526. [DOI] [PubMed] [Google Scholar]
- 5.Fink AS, Campbell DA, Jr, Mentzer RM, Jr, et al. The National Surgical Quality Improvement Program in non-veterans administration hospitals: initial demonstration of feasibility. Annals of Surgery. 2002 Sep;236(3):344–353. doi: 10.1097/00000658-200209000-00011. discussion 353–344. [DOI] [PMC free article] [PubMed] [Google Scholar]
- 6.Dimick JB, Weeks WB, Karia RJ, Das S, Campbell DA., Jr Who pays for poor surgical quality? Building a business case for quality improvement. Journal of the American College of Surgeons. 2006 Jun;202(6):933–937. doi: 10.1016/j.jamcollsurg.2006.02.015. [DOI] [PubMed] [Google Scholar]
- 7.Aiken LH, Clarke SP, Sloane DM, Sochalski J, Silber JH. Hospital nurse staffing and patient mortality, nurse burnout, and job dissatisfaction. JAMA. 2002 Oct 23–30;288(16):1987–1993. doi: 10.1001/jama.288.16.1987. [DOI] [PubMed] [Google Scholar]
- 8.Pronovost PJ, Angus DC, Dorman T, Robinson KA, Dremsizov TT, Young TL. Physician staffing patterns and clinical outcomes in critically ill patients: a systematic review. JAMA. 2002 Nov 6;288(17):2151–2162. doi: 10.1001/jama.288.17.2151. [DOI] [PubMed] [Google Scholar]
- 9.Elixhauser A, Steiner C, Harris DR, Coffey RM. Comorbidity measures for use with administrative data. Medical Care. 1998 Jan;36(1):8–27. doi: 10.1097/00005650-199801000-00004. [DOI] [PubMed] [Google Scholar]
- 10.Dimick JB, Staiger DO, Birkmeyer JD. Ranking hospitals on surgical mortality: the importance of reliability adjustment. Health Serv Res. Dec;45(6 Pt 1):1614–1629. doi: 10.1111/j.1475-6773.2010.01158.x. [DOI] [PMC free article] [PubMed] [Google Scholar]
- 11.Ghaferi AA, Birkmeyer JD, Dimick JB. Complications, failure to rescue, and mortality with major inpatient surgery in medicare patients. Ann Surg. 2009 Dec;250(6):1029–1034. doi: 10.1097/sla.0b013e3181bef697. [DOI] [PubMed] [Google Scholar]
- 12.Iezzoni LI, Daley J, Heeren T, et al. Identifying complications of care using administrative data. Medical Care. 1994 Jul;32(7):700–715. doi: 10.1097/00005650-199407000-00004. [DOI] [PubMed] [Google Scholar]
- 13.Weingart SN, Iezzoni LI, Davis RB, et al. Use of administrative data to find substandard care: validation of the complications screening program. Medical Care. 2000 Aug;38(8):796–806. doi: 10.1097/00005650-200008000-00004. [DOI] [PubMed] [Google Scholar]
- 14.Birkmeyer JD, Gust C, Baser O, Dimick JB, Sutherland JM, Skinner JS. Medicare payments for common inpatient procedures: implications for episode-based payment bundling. Health Serv Res. Dec;45(6 Pt 1):1783–1795. doi: 10.1111/j.1475-6773.2010.01150.x. [DOI] [PMC free article] [PubMed] [Google Scholar]
- 15.Gottlieb DJ, Zhou W, Song Y, Andrews KG, Skinner JS, Sutherland JM. Prices don’t drive regional Medicare spending variations. Health Aff (Millwood) Mar–Apr;29(3):537–543. doi: 10.1377/hlthaff.2009.0609. [DOI] [PMC free article] [PubMed] [Google Scholar]
- 16.Weiser TG, Regenbogen SE, Thompson KD, et al. An estimation of the global volume of surgery: a modelling strategy based on available data. Lancet. 2008 Jul 12;372(9633):139–144. doi: 10.1016/S0140-6736(08)60878-8. [DOI] [PubMed] [Google Scholar]
- 17.Dimick JB, Chen SL, Taheri PA, et al. Hospital costs associated with surgical complications: a report from the private-sector National Surgical Quality Improvement Program. Journal of the American College of Surgeons. 2004 Oct;199(4):531–537. doi: 10.1016/j.jamcollsurg.2004.05.276. [DOI] [PubMed] [Google Scholar]
- 18.Baser O, Fan Z, Dimick J, Staiger D, Birkmeyer J. Outlier payments for cardiac surgery and hospital quality. Health affairs. 2009;28:1154–1160. doi: 10.1377/hlthaff.28.4.1154. [DOI] [PMC free article] [PubMed] [Google Scholar]
- 19.Englesbe MJ, Dimick JB, Fan Z, Baser O, Birkmeyer JD. Case mix. quality and high cost kidney transplant patients. Am J Transplant. 2009;9:1108–1114. doi: 10.1111/j.1600-6143.2009.02592.x. [DOI] [PMC free article] [PubMed] [Google Scholar]
- 20.Ho V, Aloia T. Hospital volume, surgeon volume, and patient costs for cancer surgery. Med Care. 2008;46:718–725. doi: 10.1097/MLR.0b013e3181653d6b. [DOI] [PubMed] [Google Scholar]
- 21.Ghaferi AA, Birkmeyer JD, Dimick JB. Variation in hospital mortality associated with inpatient surgery. New England Journal of Medicine. 2009 Oct 1;361(14):1368–1375. doi: 10.1056/NEJMsa0903048. [DOI] [PubMed] [Google Scholar]
- 22.Iezzoni LI. Assessing quality using administrative data. Ann Intern Med. 1997 Oct 15;127(8 Pt 2):666–674. doi: 10.7326/0003-4819-127-8_part_2-199710151-00048. [DOI] [PubMed] [Google Scholar]
- 23.Hackbarth G, Reischauer R, Mutti A. Collective Accountability for Medical Care - Toward Bundled Medicare Payments. New England Journal of Medicine. 2008;359(1):3–5. doi: 10.1056/NEJMp0803749. [DOI] [PubMed] [Google Scholar]
- 24. [Accessed January 27, 2011];Medicare Acute Care Episode Demonstration for Orthopedic and Cardiovascular Surgery. 2011 http://www.cms.gov/DemoProjectsEvalRpts/downloads/ACE_web_page.pdf.