Abstract
The derivation of susceptibility from image phase is hampered by the ill-conditioned filter inversion in certain k-space regions. In this paper, compressed sensing (CS) is used to compensate for the k-space regions where direct filter inversion is unstable. A significantly lower level of streaking artifacts is produced in the resulting susceptibility maps for both simulated and in vivo data sets compared to outcomes obtained using the direct threshold method. It is also demonstrated that the CS based method outperforms regularization based methods. The key difference between the regularized inversions and CS compensated inversions is that, in the former case, the entire k-space spectrum estimation is affected by the ill-conditioned filter inversion in certain k-space regions, whereas in the CS based method only the ill-conditioned k-space regions are estimated. In the susceptibility map calculated from the phase measurement obtained using a 3T scanner, not only are the iron-rich regions well depicted, but good contrast between white and gray matter interfaces that feature a low level of susceptibility variations are also obtained. The correlation between the iron content and the susceptibility levels in iron-rich deep nucleus regions is studied, and strong linear relationships are observed which agree with previous findings.
Keywords: Phase imaging, susceptibility mapping, compressed sensing, iron content, myelin
Introduction
Recent advances in scanner hardware and signal processing techniques allow the diagnostic value of the image phase to be better exploited. In susceptibility weighted imaging (SWI) (1,2), the phase information is used in combination with the magnitude image to improve the contrast of the vascular region. The image phase also serves as a new means of tissue contrast: Rauscher et al. (3) demonstrated that the image phase reveals a contrast in deep nucleus regions that is not observed in the corresponding magnitude images; Duyn et al. (4) reported that the phase images provide better contrast at the interface between white and gray matter than the magnitude images. Unfortunately, the diagnostic value of phase data is overshadowed by its non-local property. However, susceptibility, as the underlying source of image phase, is an intrinsic tissue property and as such it is constrained to local tissue boundaries. Quantitative susceptibility measurement potentially allows the tissue iron content to be estimated in certain known iron-rich regions. Abnormal iron content has been reported to be associated with many neural diseases (5) such as Parkinson’s disease (PD), Alzheimer’s disease (AD) and Huntington’s disease. Hence it is strongly desirable to map susceptibility variations from the phase measurements.
Early attempts of in vivo susceptibility estimation resorted to geometric approximations that form an overall susceptibility map by conjoining regions of assumed uniform susceptibility level, and hence have an apparently limited accuracy level. Li et al. (6) made an early attempt at quantitative susceptibility calculation, but their method placed restrictions on the resolution of the susceptibility source and only simulation results were presented. Much progress has been made in voxelwise susceptibility mapping after the direct k-space relationship between susceptibility and phase was revealed (7,8). However, the inversion from phase map to susceptibility is an ill-posed problem as the k-space filter is undefined in certain regions. Shmueli et al (9) proposed an inversion strategy using a thresholded version of the k-space filter to avoid the problem of dividing-by-zero. In (9–11), the orientation dependence of the image phase is exploited to combine phase measurements obtained at multiple orientations so that the k-space void could be filled in. In work shown in (12–14), the ill-conditioned k-space filter inversion is converted into an optimization process, which allows various constraints to be included to specifically address the presence of streaking artifacts. All of these methods rely on estimating the undefined k-space regions by including additional information. Thus, susceptibility mapping from phase measurement can be thought of as equivalent to an under-sampled image recovery problem.
Compressed sensing (CS) (15,16) has recently emerged as a signal recovery method that allows sparse signals to be recovered from significantly smaller number of measurements than what is defined under the Nyquist sampling rate. The application of CS in MRI as a means of reducing the amount of data acquired was initiated by Lustig et al. in 2007 (17); it has since attracted much attention and been applied in many areas of MR imaging, such as angiography (18), cardiac imaging (18), and spectroscopy (19). There are two key factors required for the success of CS in MR image reconstruction: under-sampling in k-space allows incoherent aliasing artifacts to be achieved in the spatial (transform) domain; the intrinsic smoothness of MR images allows a sparse representation to be received by appropriate transforms. These two factors are also intrinsically satisfied in the problem of susceptibility mapping: it is equivalent to a k-space under-sampling problem; susceptibility is an intrinsic tissue property that reflects tissue composition and hence is intrinsically piecewise smooth.
The primary goal of this work is to show that the problem of susceptibility mapping can be reformulated as a compressed sensing image reconstruction problem. We set out to determine how accurately missing k-space data can be estimated with compressed sensing. Specifically, the k-space regions where direct inversion would be unstable are estimated using compressed sensing. We compare the outcome to those obtained from thresholded inversion using both numerical phantom and in vivo data, as well as to the regularized estimations using the in vivo data. The in vivo susceptibility maps are evaluated both qualitatively and quantitatively. Our results demonstrate that compressed sensing provides a viable alternative approach to quantitative susceptibility mapping. The resulting susceptibility maps allow us to further investigate the relationship between the calculated susceptibility level and the reported iron content in different brain regions.
Theory
K-space relationship between susceptibility and phase
The effects of tissue magnetic susceptibility are observed in the image phase information obtained with gradient echo (GRE) sequences. Denote the obtained image phase map as θ, whose k-space representation is θk ; similarly, let χ and χk respectively represent the spatial distribution and Fourier domain representation of the susceptibility map. The measured image phase and the underlying susceptibility map have the following relationship (7,8):
| (1) |
where TE, γ and H0 are the echo time, gyromagnetic ratio and the applied magnetic field, respectively; k is a k-space vector such and that k =[kx, ky, kz]T and . Denoting the k-space filter and φk(k) = φk(k)/γH0 leads to the following form:
| (2) |
In theory, the susceptibility map can be obtained from the measured phase map by simply inverting the k-space filter Dk(k):
| (3) |
However, Dk vanishes in a certain region (also known as the conical surface region) defined by . Consequently, at this conical surface region χk(k) cannot be determined via Eq.[2], where the inversion of Dk is invalid. In addition, the non-uniform structure of Dk leads to non-uniform noise enhancement after this inversion. Both factors contribute to the well-known streaking artifacts commonly seen in estimated susceptibility maps (in the sagittal and coronal planes). Hence the filter inversion is ill-conditioned in regions where Dk is vanishingly small. A straightforward approach to avoid the divide-by-zero problem and the ill-conditioned filter inversion to perform a thresholded division in regions where Dk is small as suggested in (20). Specifically, a new k-space filter is used in the inversion:
| (4) |
Intuitively, the limitation of the thresholded inversion lies in the inaccurate estimation in k-space regions where the threshold is applied.
Compressed sensing
Compressed sensing (CS) (15,16) theory states that it is possible to recover the N most significant coefficients from M incoherent linear combinations of all the coefficients in the signal f, given that f is sufficiently sparse. In (17), it was established that intrinsic image smoothness lead to sparse representation under wavelet/discrete cosine transforms. For MRI, one can obtain a CS estimate f′of an image f from its under-sampled k-space dataset fk by solving the following optimization problem:
| (5) |
where W is a Fourier matrix multiplication by which the Fourier transform is produced, h is a binary mask representing the sampling pattern in which 1 and 0 correspond to measured and skipped samples respectively, and diag(h) denotes a diagonal matrix with the elements of h on the diagonal. Φ is a linear transform chosen such that Φf is sparse. The 1st norm ∥Φf∥1 promotes sparsity in Φf ; Ξ(f) represents the additional image constraints that can be incorporated into the reconstruction process. Often a total variation (TV) (21) constraint is included to mitigate rapid variation caused by error in transform domain (17). The symbols α and β are respective weighting coefficients.
Compressed sensing compensated susceptibility estimation
As discussed above, the k-space regions that cause streaking artifacts are the regions whose corresponding Dk values are vanishingly small. In CS compensated susceptibility estimation, we treat the k-space regions that may not be obtained via direct filter inversion as missing data and use CS to retrieve them. The extent to which the k-space regions need to be estimated is determined by a threshold value in Dk The overall susceptibility estimation is a two step process: first, a partial k-space estimate is obtained by performing a direct inversion using Eq. [3] up to a set threshold level; in the second step, the void in the resulting k-space dataset is compensated using compressed sensing. Mathematically, the proposed approach can be written as:
| (6) |
where Dk′(k) is the same as in Eq.[4] and χk′(k) is the resulting susceptibility estimate using thresholded inversion, and then
| (7) |
where ht is a binary mask determined by the threshold level t, i.e.:
| (8) |
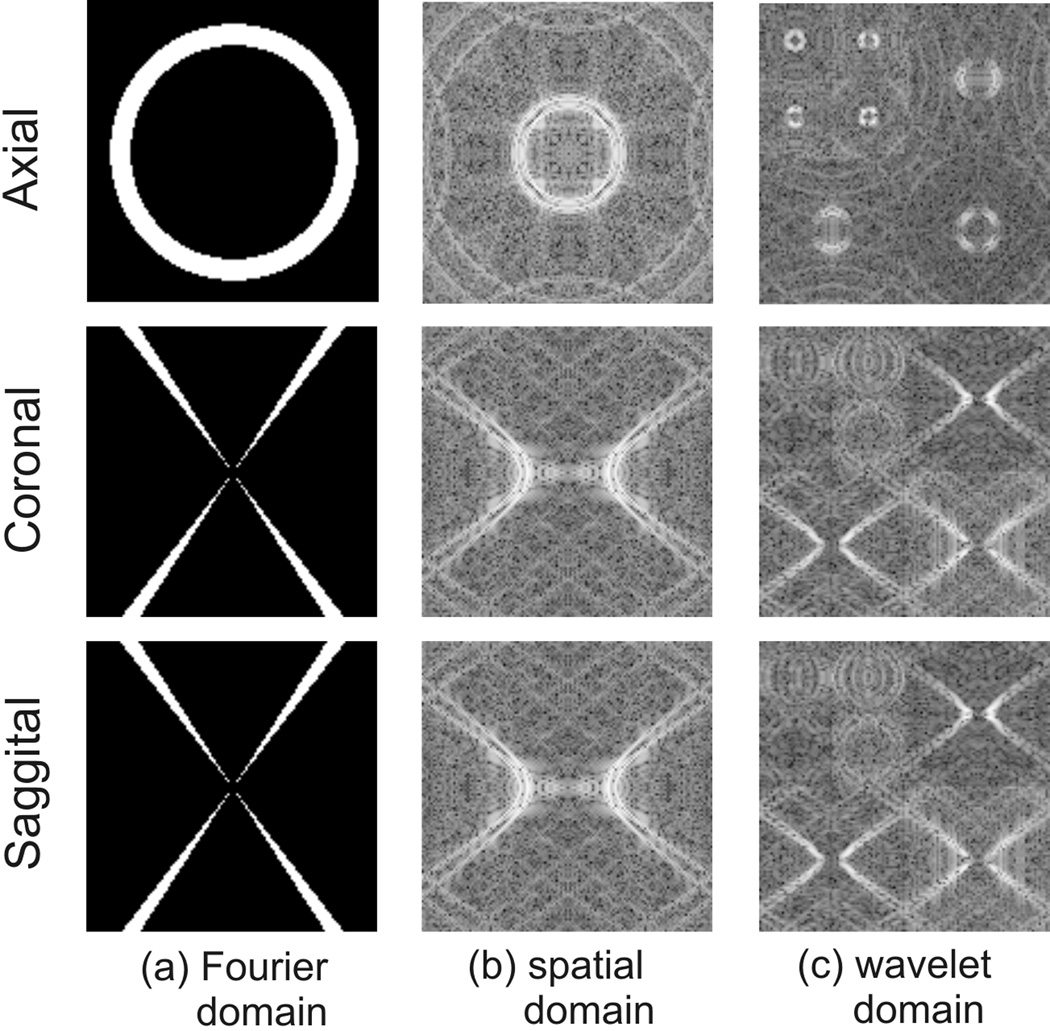
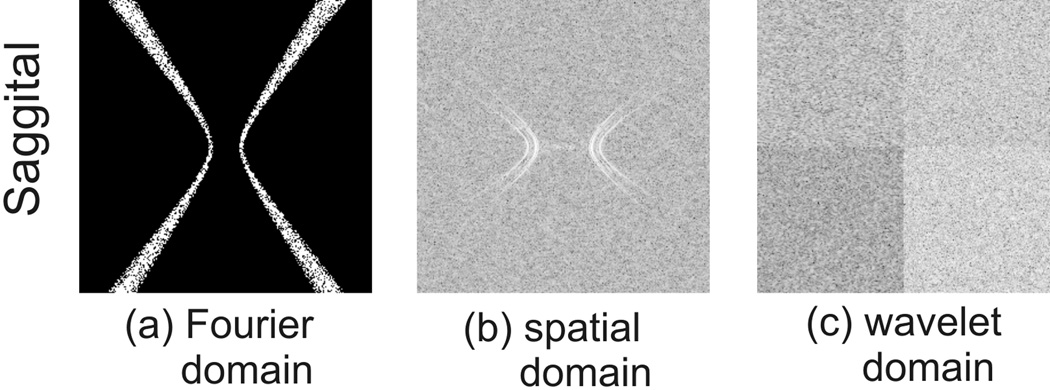
The success of compressed sensing recovery relies on a key requirement that the aliasing artifacts caused by k-space under-sampling must be incoherent. In Fourier-transform based MRI data acquisition, the form of aliasing artifacts is determined by the under-sampling scheme used, whereas in susceptibility mapping it is determined by the structure of Dk and the chosen threshold level. In Fig.1, the transform point spread function (TPSF) analysis, as in (22), is performed, i.e. the effects of the missing k-space regions are seen in the transform domain in which the image is to be recovered. Note that in conventional MR imaging on a Cartesian grid, where the frequency axis is always fully sampled, image reconstruction is either a 1D or 2D problem. But in our case the under-sampling scheme and the compressed-sensing compensated estimation take place in 3D because of the three dimensional nature of the Dk filter. Fig.1 (b) and (c) show the pattern of aliasing artifacts appearing in the spatial and transform domains respectively, assuming a 4-level wavelet transform is used. The structured artifacts caused by the cone-shaped k-space sampling pattern may hamper exact compressed sensing recovery, however the usually relatively low under-sampling ratio (5%~20% depending on the threshold) could allow good approximate recoveries to be achieved. Furthermore, the streaking artifacts in the sagittal and coronal planes look very similar to those caused by under-sampled radial trajectories. These under-sampled radial trajectories have been shown to be suitable for the application of compressed sensing (22,23).
Figure 1.
The point spread function analysis of the (a) k-space void corresponding to a filter threshold level of 0.0375 in (b) the spatial domain and (c) the wavelet domain.
We refer to the abovementioned approach as the CS compensated method, as the reconstruction in [5] is mainly focused on the missing k-space regions rather than the alternative L1 norm regularized approach, i.e.
| (9) |
where the entire k-space spectrum is estimated and regularized using the transform domain based L1 norm. This setup has been used to specifically address the streaking artifacts in (24). A drawback of this approach over the CS compensated method is that the entire k-space spectrum would be affected by the strong smoothing power exercised to compensate for the streaking artifacts caused by the presence of the ill-conditioned filter inversion in some k-space regions, as will be shown in a later section.
Background phase removal
The presence of background phase modulation in the phase map is a known issue. Several methods have been proposed to remove background contributions including high-pass filtering (4), dipole filtering (10) and iterative optimization (13). These methods suffer from a limited level of accuracy or a prolonged processing time. In this work, we adopt and extend the non-heuristic approach introduced by Schweser et al. (25) (26); since the harmonic background phase satisfies Laplace’s equation, it can be removed by exploiting the spherical mean value (SMV) property.
The background phase removal process includes two steps. In the first, SMV filtering is performed to remove the harmonic component. This process gives rise to an ambiguity around the object’s boundaries, which results from convolving with the air where there is no detectable MRI signal. Hence, the number of ambiguous points equates to the diameter of the sphere used and these points need to be discarded. In the second step, a deconvolution is carried out to restore the local phase that is lost in the SMV filtering process. In practice, there often exists residual phase error in the SMV filtering process at the ROS (region of support) boundary due to the high susceptibility of the air tissue interface. This residual phase error is further amplified during the deconvolution process with a level dependent on the kernel size.
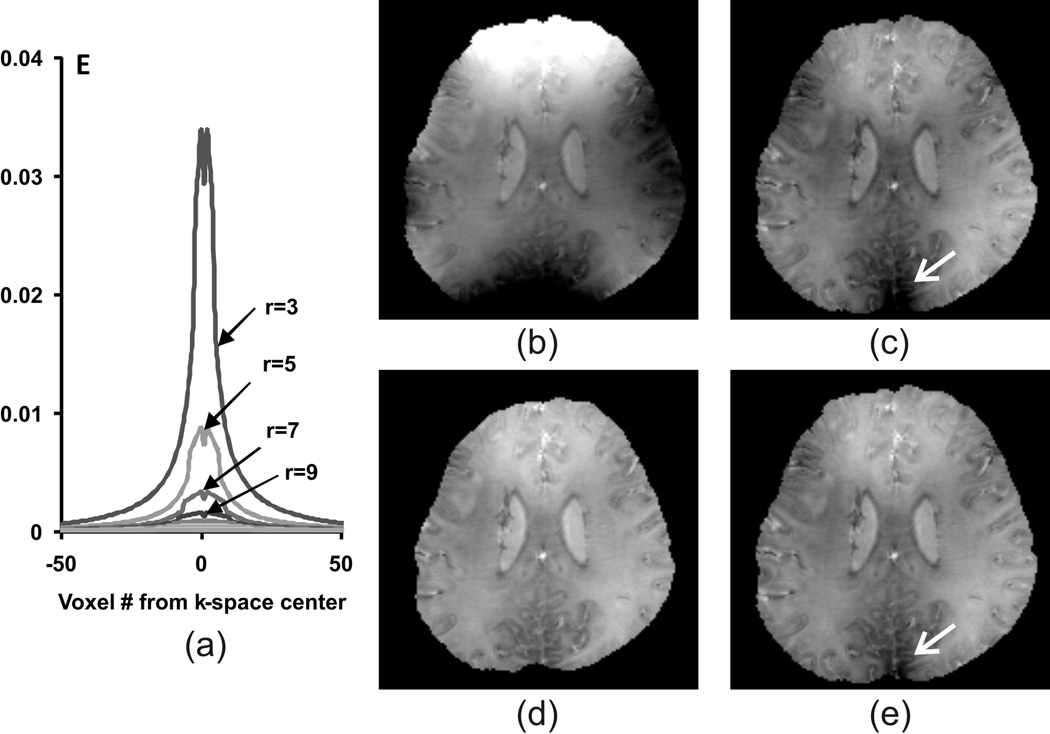
A small sphere diameter corresponds to a deconvolution kernel with large magnitude, and vice versa (Fig.2(a)). As a result, using a spherical filter with a small diameter may cause a large amplification of the residual phase error as illustrated in Fig.2 (c) where a 3 voxel diameter was used. Note that this phase error is consistent with results reported in previous literature (25). In contrast, using a larger diameter (8 voxels) led to a much lower level of phase error as seen in Fig.2 (d). However, using a large sphere diameter presents an obvious drawback since it leads to discarding more points at the ROS boundary. Hence, the selection of different sphere diameters presents a trade-off between the residual background phase and the integrity of the resulting phase map.
Figure 2.
The effects of using different sphere diameters in SMV background phase removal: (a) the cross-section of the deconvolution kernels for different diameters r; (b) original unwrapped phase map; (c) background phase removal using a sphere filter of 3 voxels in diameter; (d) background phase removal with a sphere filter 8 voxels in diameter; (e) background phase removal with an adaptive sphere filter varying from 8 to 3 voxels in diameter. A small sphere diameter causes large error amplification (pointed by arrow), whereas a large diameter causes larger regions at the boundary to be discarded.
We used a varying diameter scheme to achieve a better compromise between the two (Fig.2(e)). In the convolution process, a large diameter is used as long as no invalid point is produced. As the sphere filter approaches the ROS boundary, its diameter is gradually reduced until the minimum number of invalid points is reached (using a diameter of 1). In the deconvolution process, the convolution kernel corresponding to the largest diameter used is employed. This ensures that the phase map is generated with low phase error and with a good level of integrity. The drawback is the inexact deconvolution of the boundary regions, which is tolerable in our case as the brain ROS is surrounded by grey matter (cortex) whose susceptibility is relatively uniform.
Method
Simulation
A 3D digital Shepp-Logan phantom (128×128×128) consisting of four levels of nested ellipsoids was generated. The susceptibility levels of the ellipsoids were set to 0.1, 0.2, 0.3 and 1 ppm, and the background was assumed to have no susceptibility. Phase maps were generated using the Fourier relationship in Eq. [2] and various levels of Gaussian noise (SNR = 10, 20 and 30) were then added to simulate the noisy data sets. Given that in practice it is impossible to obtain phase measurement in regions outside of the object support, only phase information within the outermost ellipsoid was maintained. Susceptibility maps were then calculated for different SNR and filter truncation levels using respectively the threshold method and the compressed sensing compensation method. For each set of parameters, we used the Normalized Root Mean Square (NRMS) as a metric to quantify the error obtained in either case.
In vivo brain imaging and phase map pre-processing
In vivo brain imaging of a healthy adult volunteer was performed on a 3T GE MR750 scanner (GE Healthcare, Waukesha, MI) equipped with an 8-channel head coil. Written informed consent was obtained from the subject in compliance with a protocol approved by the Institutional Review Board. A standard flow-compensated 3D Spoiled-Gradient-Recalled-Echo (SPGR) sequence was used with the following parameters: FOV = 256×256×180 mm3, matrix = 256×256×180, TE = 40 ms, TR = 50 ms, flip angle = 20°.
Complex data were saved for each coil and independently processed as follows. Phase data were first extracted for each coil and unwrapped using an algorithm based on the Laplace operator (27,28). Next, background phase removal was performed using the SMV filter as discussed in the previous section. The resulting datasets from each coil were then averaged to obtain the final phase map. To evaluate the performance of the new CS compensated method, susceptibility maps were also calculated using the L1 norm regularized method as in [9] and Bayesian regularization using spatial priors obtained from the magnitude gradient image as described in (13).
Reconstruction setup
Both the CS compensated and magnitude image constrained methods were implemented using the non-linear conjugate gradient descent algorithm. In both cases, the termination condition was set to when the relative change of the residual cost function in two consecutive iterations fell below 10−4. In the CS-compensated and L1 norm regularized reconstruction, a 4-level Daubechies wavelet was used and the L1 norm weighting coefficient (α) was determined for each filter truncation level. This was accomplished by using the L-curve method (29) of plotting the L1 norm term to the data fidelity term, while keeping the weighting coefficient of the total variation (TV) term constant (at 0.001) for all filter truncation levels. In the magnitude-constrained reconstruction, the thresholded inverse of the magnitude gradient in three directions was used as a weighting mask (13), and a threshold value of 0.001 was used. The weighting coefficient for the magnitude gradient mask was selected within the range suggested in (13). Image reconstructions were performed using Matlab (R2010a, Mathwork) on a PC equipped with a 3.4G Hz processor and 8 GB ram, and the reconstruction times for the CS compensated method varied between 2 to 3 hours depending on the number of iterations performed to reach the desired residual norm level.
Results
Phantom simulation
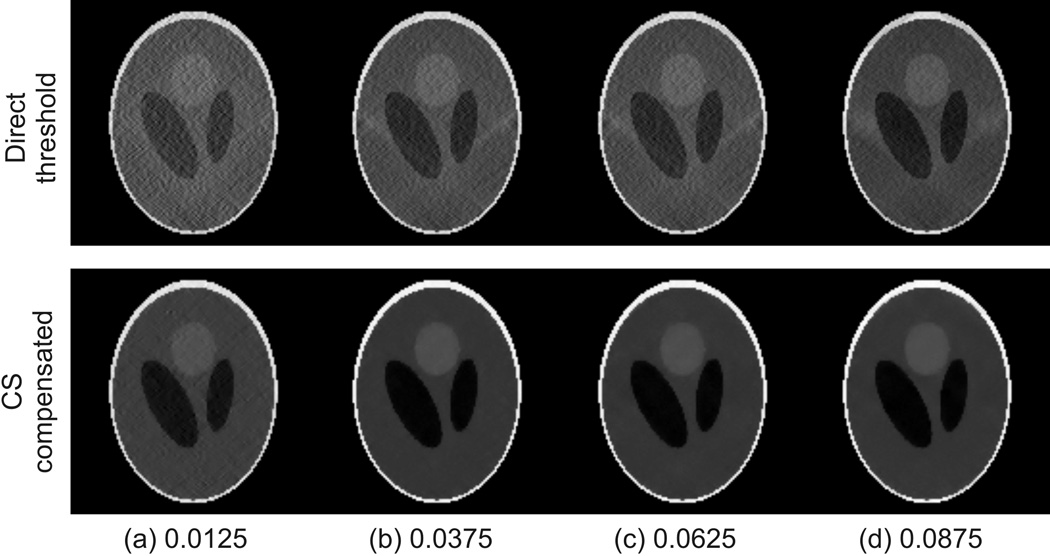
The calculated susceptibility maps with SNR=20 and threshold levels ranging from 0.0125 to 0.0875 are shown in Fig.3. This simulation compares the impact of using different levels of thresholding and the outcome of using a direct threshold versus compressed sensing. In the top row, it is seen that for the direct threshold method the streaking artifacts are significantly reduced as the truncation level increases. However, even at the largest threshold value of 0.0875, the resulting susceptibility map is still considerably corrupted by the streaking artifacts. In comparison, the CS compensated susceptibility maps are largely free of streaking artifacts for truncation levels as low as 0.0375.
Figure 3.
Comparison of a coronal slice of the reconstructed susceptibility maps using the direct threshold method (top row) and the compressed sensing compensated method (bottom row) at different filter threshold levels.
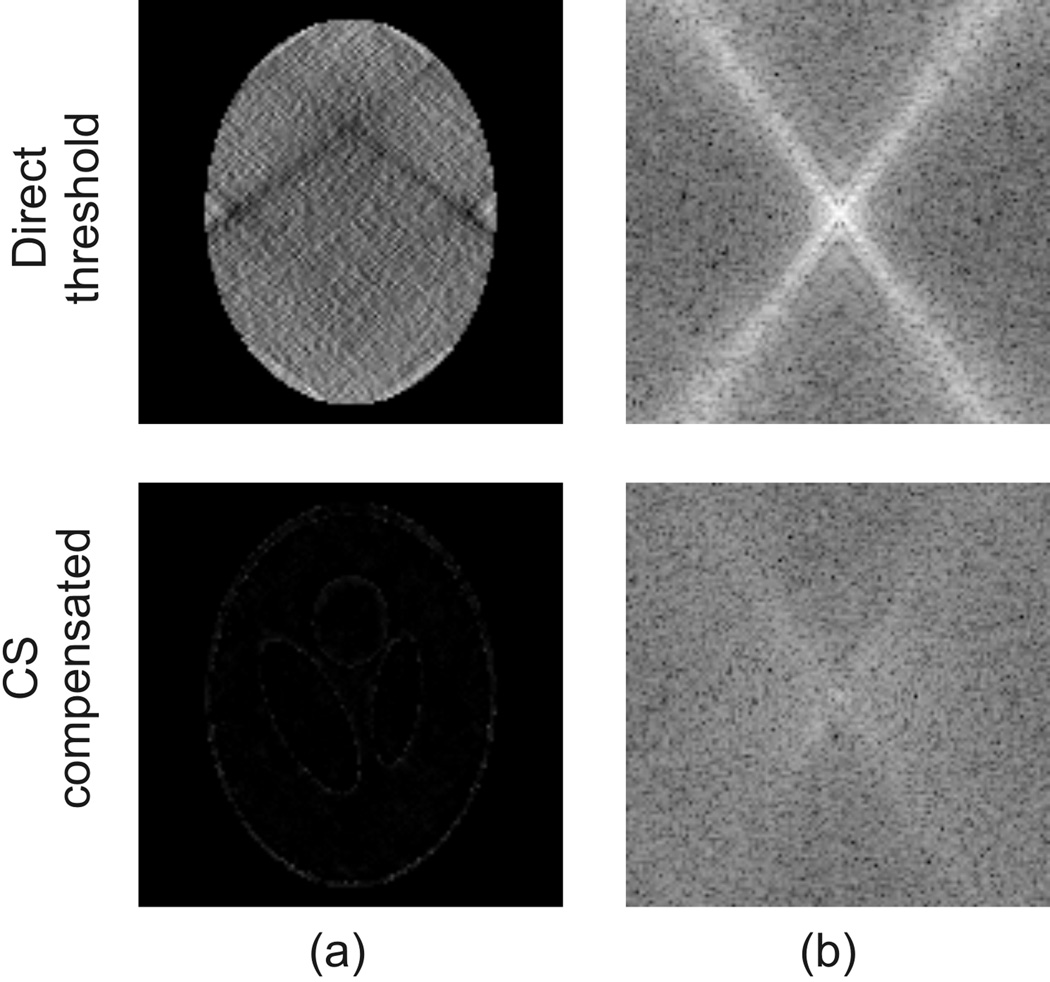
Further insight into the efficiency of these approaches can be gained by comparing the error maps. Fig.4 (a) and (b) respectively show the difference between the estimated and the true susceptibility maps. In the top row, it is seen that the error obtained with the direct threshold method is dominated by the streaking artifacts and reciprocally in k-space the error is mainly concentrated around the conical surface where the threshold was made. Also there is a DC level shift in the error map, caused by the offset introduced at k = [0 0 0]. In contrast, the error in the CS-compensated case is practically limited to the phantom’s outer edge indicating some errors at the boundary, whereas the streaking artifacts are visually absent. Likewise, the error in k-space is much more uniformly distributed with a slightly higher energy level around the k-space conical surface than in the surrounding regions.
Figure 4.
Comparison of a coronal slice of the error maps of the reconstructed susceptibility maps using the direct threshold method (top row) and the compressed sensing compensated method (bottom row) at a threshold level of 0.0375 in (a) the spatial domain and (b) k-space.
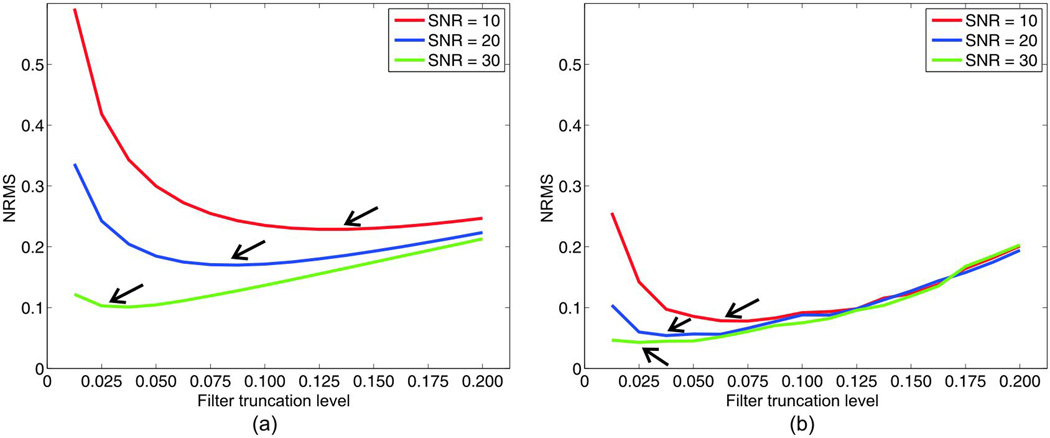
A comparison of the calculated NRMS at different noise levels for truncation levels ranging from 0.0125 to 0.2 are shown in Fig.5 (a) and (b). Regardless of the SNR, the CS-compensated reconstruction features a considerably lower level of NRMS than the direct threshold. A common feature to all the plots is a turning point (as indicated by the arrows) where the NRMS variation transitions from decreasing to increasing as the filter truncation level rises. The error to the left of the minimum is dominated by noise so the overall NRMS drops as the truncation level increases whereas, to the right of this minimum, further increasing the truncation level leads to the loss of image information. This loss of information causes the NRMS to increase. In general, it is observed in both methods that as the SNR level improves the turning point shifts to a lower truncation level. Also, CS-compensated reconstruction features a turning point at a much lower truncation level than the direct method, which means that it is possible to trade off a smaller amount of image information in order to achieve a lower level of artifacts. Realistically, for an SNR level of 20, the turning point for the direct threshold and CS-compensated methods are 0.075 and 0.0375 respectively.
Figure 5.
L-curve plots of the normalized root mean square error (NRMS) of the reconstructed susceptibility maps using (a) the direct threshold method and (b) the compressed sensing compensated method against the different filter truncation levels at varying SNR levels. The arrows point to the turning points on the L-curve plots.
In vivo susceptibility mapping
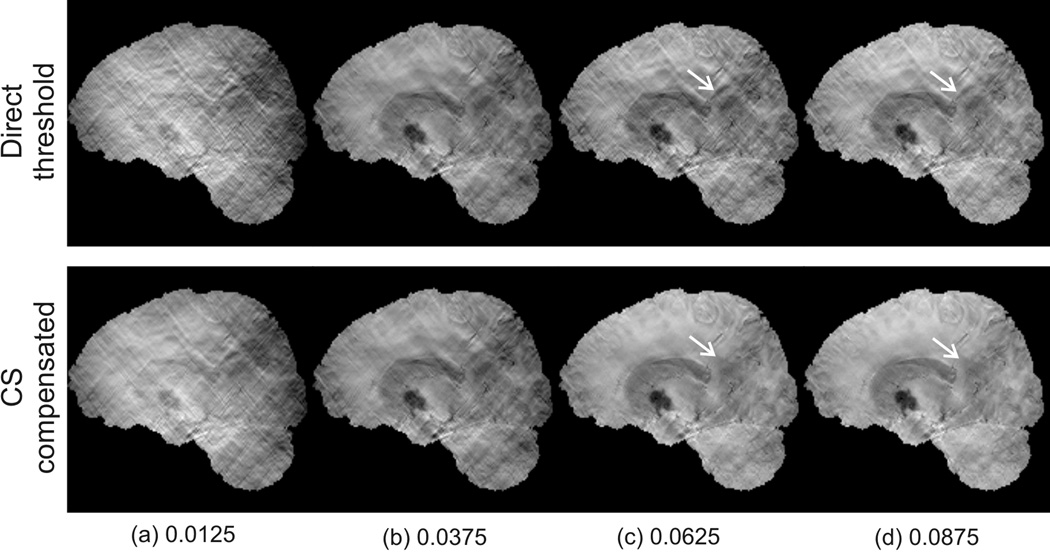
Fig.6 shows a sagittal section of the 3D susceptibility maps estimated using the direct threshold and CS compensated methods at different truncation levels. Observations similar to the phantom simulations are made: the CS compensated method led to susceptibility estimates with a significantly lower level of streaking artifacts than those obtained using the direct threshold method. The CS compensated method produces an estimate that is visually free of streaking artifacts at a truncation level of 0.0625. The susceptibility maps reconstructed using thresholded inversion shows a change in susceptibility contrast in the mid-brain region (indicated by arrow) that indicates a potential susceptibility source. However, in the susceptibility maps obtained with the CS compensated method, the suspected source of susceptibility is non-existent. This is consistent with observations made with the magnitude image. The magnitude image is shown on the top left in Fig.7 with a dashed arrow pointing to the corresponding region.
Figure 6.
Comparison of a coronal plane slice of a reconstructed in vivo brain susceptibility map obtained using the direct threshold method and the CS compensated method at varying threshold levels. Note that dark regions indicate paramagnetic (more positive) and bright regions indicate diamagnetic (more negative). The arrows point to a region where a susceptibility source is seen to exist in the susceptibility maps obtained using the direct threshold method, but not in those obtained using the CS compensated method.
Figure 7.
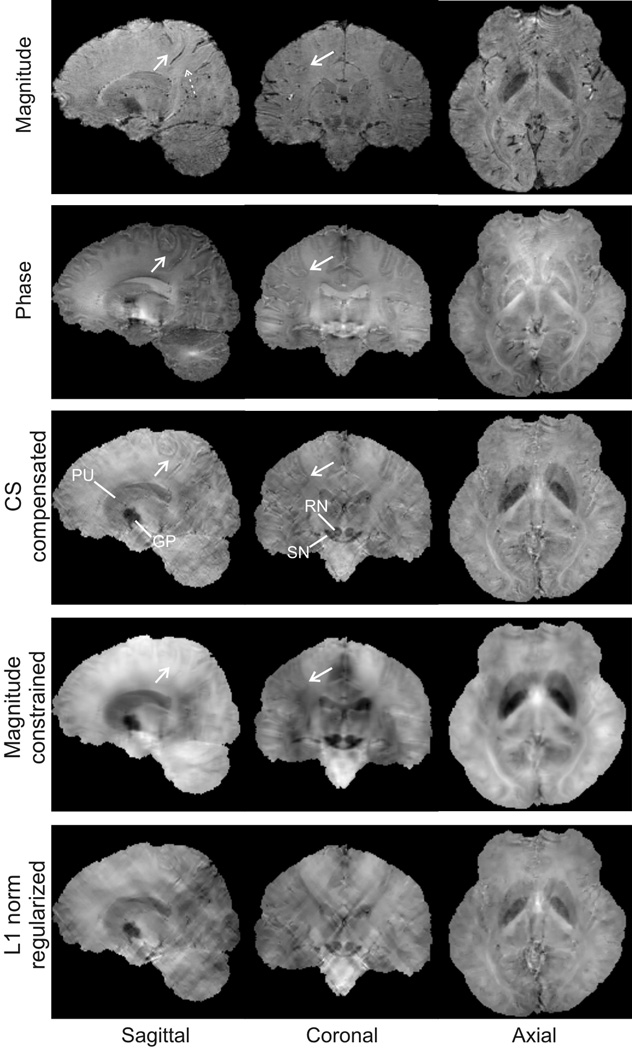
Comparisons of the image magnitude (top row), phase maps (second row) and calculated susceptibility maps using different methods at three orthogonal planes. Susceptibility maps are calculated using the CS compensated method (third row), magnitude gradient regularized method (forth row) and L1 norm regularized method (bottom row). The dashed arrow in the magnitude image points to the region where the suspected susceptibility source in Fig. 6 is seen to be non-existent. The susceptibility maps obtained using the CS compensated method features better contrast at the WM/GM cortex interfaces as pointed to by the solid arrows. Note that dark regions indicate paramagnetic (more positive) and bright regions indicate diamagnetic (more negative).
In Fig.7, the image magnitude, phase and calculated susceptibility maps are compared. Susceptibility maps calculated using the CS compensated method, the L1 norm regularized method and the magnitude gradient constrained method. In the CS compensated method, a threshold level of 0.0625 was used. It is seen that the image magnitude shows poor contrast in the gray/white matter interface in the cortical regions compared to the image phase map. The phase map, however, has difficulty delineating iron rich regions due to its non-local property, including regions containing red nucleus (RN) and substantia nigra (SN), and those containing the globus pallidus (GP) and putamen (PU). On the contrary, good contrast and clear delineations of these regions are seen in the susceptibility maps calculated using the CS compensated method. The susceptibility map calculated using the L1 norm regularized method still shows residual streaking artifacts despite the apparent smoothing appearance, due to the reason discussed previously. The magnitude image regularized susceptibility map shows a considerablly reduced level of streaking artifacts due to the spatial gradient regularization. However, this magnitude image seems to feature a lack of contrast in regions with low susceptibility variations (i.e. the grey/white matter interfaces at the cortex) compared to the susceptibility map obtained using the CS compensated method, most likely because the magnitude image used as an a priori estimate has a lack of contrast in those regions (as indicated by arrows).
Quantitative susceptibility measurement
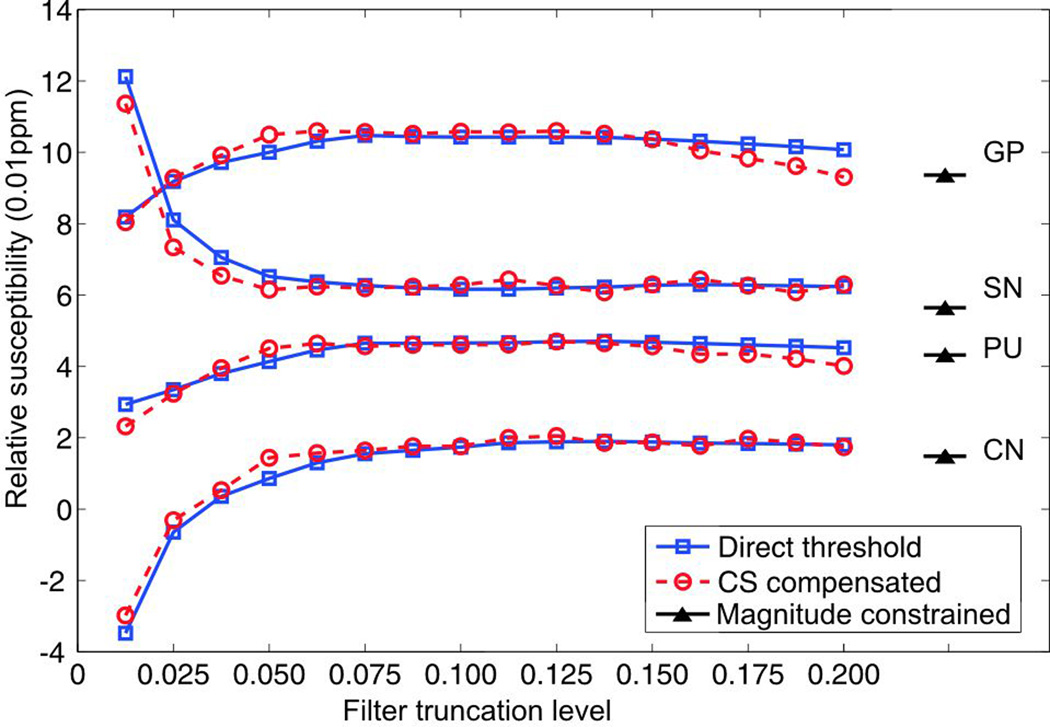
Quantitative susceptibility assessments of various deep nuclei regions were made by taking the susceptibility of CSF as a reference: we took the difference between the mean susceptibility level within the selected deep nucleus regions and the mean susceptibility of the CSF region. The calculated susceptibility levels for different deep nuclei regions using the direct threshold, CS and magnitude gradient constrained methods are compared in Fig.8. Quantitative susceptibility estimations using the threshold method and the CS method have similar behavior as the truncation level increases: they rapidly reach a plateau and then derivate away. It is worth noting that the estimations using CS reach the plateau at a lower truncation level, which means that a similar level of quantitative measurement may be obtained with potentially better image fidelity (by maintaining a larger portion of k-space regions obtained using the direct filter inversion). In the brain regions of interest, the filter truncation levels corresponding to the plateau of the curve range from 0.05 to 0.125 for the CS method versus 0.0875 to 0.15 for the direct method. The relative susceptibility estimations are slightly lower for the magnitude gradient constrained method than for any other method (as labeled). This difference can be explained by the slight loss of image contrast caused by the image gradient operator, since the relative susceptibility may be considered as a measure of the image contrast.
Figure 8.
Calculated relative susceptibility levels of selected deep nucleus regions using the direct method and the CS compensated method at varying filter truncation levels; the susceptibility levels calculated using the magnitude gradient constrained method are as labeled.
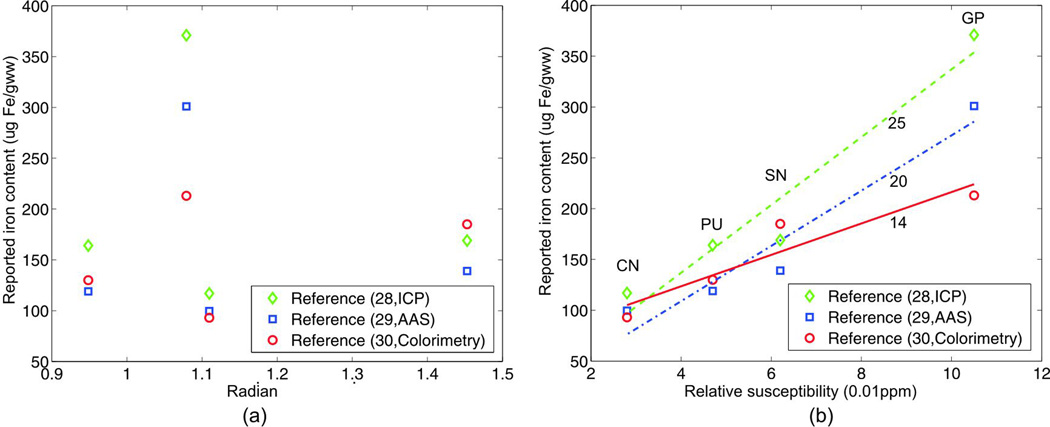
It is been known that iron is the main source of susceptibility in the deep nuclei regions; we analyzed the correlations between the phase and susceptibility values and previously reported iron content of selected deep nuclei regions (30–32) obtained using different biochemical techniques. The phase measurements and calculated susceptibility values are plotted against the reported iron content from different studies as shown in Fig.9.(a) and Fig.9.(b). While no apparent correlation is seen between the phase measurement and the iron content, strong positive correlations are observed between susceptibility and iron content. Linear fittings are then performed on the correlations between the calculated susceptibility values and the reported iron contents, and the resulting coefficients of determinations (R2) are 0.98, 0.91 and 0.96, suggesting good linear approximations. The slopes of the fitted lines are 2500, 2000 and 1400 (ug Fe/gww·ppm). The variations of the fitting results may be attributed to physiological differences between the cohorts and the varying accuracy of the measurement techniques used in those studies.
Figure 9.
Plots of the (a) phase and (b) susceptibility values in different deep nucleus regions against their reported iron contents in (28–30). The biochemical techniques used were inductively coupled plasma spectroscopy (ICP), atomic absorption spectrophotometry (AAS) and colorimetry, respectively. Linear fittings are made in (b) and the gradients of the fitted lines are labeled.
Discussion
The relationship between phase and susceptibility map may be depicted by a simple k-space filter. However this filter is inaccurate in and around the conical surface regions that prohibits direct filter inversion to estimate the susceptibility map. In this work, we developed a novel method for accurate magnetic susceptibility quantification based on compressed sensing. The k-space undefined conical surface and its noise-corrupted proximities are considered unavailable and estimated using compressed sensing by exploiting the intrinsic smoothness of the underlying susceptibility map. The extent of the direct filter inversion is controlled by adjusting the threshold value of the filter. A drawback of the current setup is the non-ideal aliasing pattern encountered in [7] as shown in Fig.1, which may contribute to the residual artifacts when a low threshold level is used. Potential improvement may be made by employing a more random under-sampling strategy in these regions, such as demonstrated in Fig.10. In the case, within the regions where ill-conditioned filter inversion takes place as determined by a threshold level, samples are randomly discarded with a non-uniform sampling density determined by the conditioning of the k-space position (compared to the ‘fully sampled’ case in Fig.1). The resulting TPSF as seen in Fig.10.(c) is much more favorable for CS recovery compared to that in Fig.1.(c). However, the increased level of incoherence comes at the sacrifice of the conditioning of the k-space data used for reconstruction, and in our experience, the loss sometimes seems to overweigh the gain. Nevertheless, an under-sampling pattern that achieves a good compromise between the two factors may lead to an improved susceptibility estimate, i.e. obtaining a streaking artifact free estimate using a lower filter threshold value.
Figure 10.
The point spread function analysis of the k-space voids in an under-sampling pattern that features a higher level of aliasing incoherence, as compared to that in Figure 1.
We compared the susceptibility maps obtained from the CS compensated method to those obtained by performing a direct threshold inversion. Our method led to a significantly lower level of streaking artifacts in both numerical simulation and in vivo data. In both methods, the threshold level of the filter is an important parameter, because it has a direct impact on the trade-off between the susceptibility accuracy and the artifact level. Based on L-curve analysis using the simulation results, it was determined that in both methods the turning point is dependent on the intrinsic SNR level; the turning point becomes lower as the SNR increases. For a constant SNR level, the turning point is lower for the CS compensated method. Since the turning point on the L-curve corresponds to the optimal truncation level in terms of trade-off between accuracy and artifact, a lower truncation level means that better image fidelity can be maintained and is therefore advantageous for quantitative susceptibility assessment. The in vivo results show reconstructions that are visually artifact free reconstructions are produced at a truncation level of 0.0625 with CS compensation; the generated susceptibility maps have a satisfactory level of contrast even in regions with low susceptibility variations, such as at the boundaries between white and grey matter. The optimal range of filter truncation values for in vivo data is identified by the plateau portion on the plot of the calculated susceptibility against the varying filter truncation levels; a lower optimal filter truncation level is observed in the CS based method and is consistent with the simulation results. Compared to the threshold method, the main drawback of the proposed CS method is the reliance on computationally intensive L1 norm calculations, which may be alleviated by exploiting advanced reconstruction methods such as are discussed in (33).
The multiple orientation approach (9–11) and constrained optimization approach (12,13) address the issue of the ill-conditioning of the susceptibility estimation by incorporating additional information about the underlying susceptibility map. It would be interesting to compare the k-space estimates obtained using compressed sensing to those obtained using multiple orientations, as the latter may allow the k-space regions that are undefined in one orientation to be directly measured at a different orientation. However, the multiple orientation method not only requires a prolonged scan time, but the theory also seems inconsistent with recent reports showing evidence of susceptibility orientation dependence at a micro-structural scale (34,35). Hence, the k-space filter model between the susceptibility and phase (Eq.[2]) would not be the same when the subject is positioned at different angles with respect to the main magnetic field. The optimization based estimations (12–14) are promising alternatives as various constraints could be included to condition the inversion problem. It was seen that applying a uniform penalization profile of either the L1 or L2 norm of the image as in (12) could not achieve sufficiently accurate susceptibility estimates. In this study we also considered applying the same CS constraint (i.e., transform domain based L1 norm) in the reconstruction process but, the result was still hampered by the visible streaking artifacts caused by the ill-conditioned filter inversion in certain k-space regions. In (13,14), the magnitude gradient images are used to introduce a non-uniform weighting mask in a Tikhonov regularization form, and have been demonstrated to be powerful in suppressing streaking artifacts. It should be noted that excessive use of prior knowledge might introduce bias in the resulting reconstruction and hence overwhelm the underlying information. For instance, the magnitude image often features poorer contrast at the gray/white matter interfaces than does the phase measurement. The use of prior estimates based on the magnitude gradient image might reduce the contrast in those regions, given their intrinsically low susceptibility variations (11). A key difference between the regularized inversions above and the CS compensated inversion approach is that in the former case the whole k-space spectrum needs to be altered to accommodate for the constraint imposed, whereas in the latter case only the small portion of discarded k-space regions are estimated to fulfill the constraint and good data consistency is maintained in the rest of the k-space spectrum.
Iron accumulations in the deep nucleus regions are known to be associated with neurodegenerative diseases (4,5). For instance, the iron contents in the SN and GP regions have been reported to be associated with Parkinson’s disease (31); those in the GP, PU and CN have been linked to Alzheimer’s disease (36); and elevated iron content has been measured in the PU in the detection of Huntington’s disease (37). Hence, non-invasive quantitative assessment of the iron content in the brain has the potential to offer many clinical benefits. Nevertheless, as demonstrated in this work, the phase maps fail to serve this purpose due to their non-local and difficult-to-quantify features. By contrast, we were able to observe strong positive relationships between the previously published iron contents of the deep nuclei and our calculated susceptibility values. We further fitted linear approximations for each set of iron content, which is in good agreement with previous findings (11) (using iron content from reference (32)). Hence, quantitative susceptibility mapping may serve as a useful means of assessing the iron contents of deep nuclei regions. The establishment of this relationship to other brain regions is complicated by the fact that other tissues, such as white matter, are often mixtures of iron (paramagnetic) and myelin (diamagnetic), whereas myelin is nearly completely absent in those iron-rich deep nuclei regions. The relationship between myelin content and susceptibility measurements may be exploited by pre-excluding the effects of iron content that is known a priori. For instance, the iron content was reported to be comparable in the frontal white matter and in the occipital cortex (5), but their calculated susceptibilities – respectively −0.05 and 0.01ppm in the current study – are significantly different. This considerable susceptibility difference (−0.06 ppm) is likely due to the enrichment of myelin.
Conclusion
We presented a new technique for in vivo susceptibility mapping based on compressed sensing. In this method, the k-space regions that may not be obtained via filter inversion are estimated using compressed sensing whereas the rest of k-space is directly calculated. This method is demonstrated to produce accurate whole brain susceptibility maps free of streaking artifacts with a gradient echo sequence at 3T. This new method may serve as a useful tool for assessing in vivo susceptibilities, which are sensitive to tissue composition, such as iron and myelin content.
Acknowledgement
The study was supported by the National Institutes of Health (NIH) through grant R00EB007182 to C. L. The authors thank Dr Todd Harshbarger and Nicole Murphy for proofreading the manuscript.
References
- 1.Haacke EM, Xu YB, Cheng YCN, Reichenbach JR. Susceptibility weighted imaging (SWI) Magn Reson Med. 2004;52(3):612–618. doi: 10.1002/mrm.20198. [DOI] [PubMed] [Google Scholar]
- 2.Haacke EM, Mittal S, Wu Z, Neelavalli J, Cheng YCN. Susceptibility-Weighted Imaging: Technical Aspects and Clinical Applications, Part 1. Am J Neuroradiol. 2009;30(1):19–30. doi: 10.3174/ajnr.A1400. [DOI] [PMC free article] [PubMed] [Google Scholar]
- 3.Rauscher A, Sedlacik J, Barth M, Mentzel HJ, Reichenbach JR. Magnetic susceptibility-weighted MR phase imaging of the human brain. Am J Neuroradiol. 2005;26(4):736–742. [PMC free article] [PubMed] [Google Scholar]
- 4.Duyn JH, van Gelderen P, Li TQ, de Zwart JA, Koretsky AP, Fukunaga M. High-field MRI of brain cortical substructure based on signal phase. P Natl Acad Sci USA. 2007;104(28):11796–11801. doi: 10.1073/pnas.0610821104. [DOI] [PMC free article] [PubMed] [Google Scholar]
- 5.Haacke EM, Chengb NYC, House MJ, Liu Q, Neelavalli J, Ogg RJ, Khan A, Ayaz M, Kirsch W, Obenaus A. Imaging iron stores in the brain using magnetic resonance imaging. Magn Reson Imaging. 2005;23(1):1–25. doi: 10.1016/j.mri.2004.10.001. [DOI] [PubMed] [Google Scholar]
- 6.Li L, Leigh JS. Quantifying arbitrary magnetic susceptibility distributions with MR. Magn Reson Med. 2004;51(5):1077–1082. doi: 10.1002/mrm.20054. [DOI] [PubMed] [Google Scholar]
- 7.Marques JP, Bowtell R. Application of a fourier-based method for rapid calculation of field inhomogeneity due to spatial variation of magnetic susceptibility. Concept Magn Reson B. 2005;25B(1):65–78. [Google Scholar]
- 8.Salomir R, De Senneville BD, Moonen CTW. A fast calculation method for magnetic field inhomogeneity due to an arbitrary distribution of bulk susceptibility. Concept Magn Reson B. 2003;19B(1):26–34. [Google Scholar]
- 9.Liu T, Spincemaille P, de Rochefort L, Kressler B, Wang Y. Calculation of Susceptibility Through Multiple Orientation Sampling (COSMOS): A Method for Conditioning the Inverse Problem From Measured Magnetic Field Map to Susceptibility Source Image in MRI. Magn Reson Med. 2009;61(1):196–204. doi: 10.1002/mrm.21828. [DOI] [PubMed] [Google Scholar]
- 10.Wharton S, Schafer A, Bowtell R. Susceptibility Mapping in the Human Brain Using Threshold-Based k-Space Division. Magn Reson Med. 2010;63(5):1292–1304. doi: 10.1002/mrm.22334. [DOI] [PubMed] [Google Scholar]
- 11.Wharton S, Bowtell R. Whole-brain susceptibility mapping at high field: A comparison of multiple- and single-orientation methods. Neuroimage. 2010;53(2):515–525. doi: 10.1016/j.neuroimage.2010.06.070. [DOI] [PubMed] [Google Scholar]
- 12.Kressler B, de Rochefort L, Liu T, Spincemaille P, Jiang Q, Wang Y. Nonlinear Regularization for Per Voxel Estimation of Magnetic Susceptibility Distributions From MRI Field Maps. Ieee T Med Imaging. 2010;29(2):273–281. doi: 10.1109/TMI.2009.2023787. [DOI] [PMC free article] [PubMed] [Google Scholar]
- 13.de Rochefort L, Liu T, Kressler B, Liu J, Spincemaille P, Lebon V, Wu JL, Wang Y. Quantitative Susceptibility Map Reconstruction from MR Phase Data Using Bayesian Regularization: Validation and Application to Brain Imaging. Magn Reson Med. 2010;63(1):194–206. doi: 10.1002/mrm.22187. [DOI] [PubMed] [Google Scholar]
- 14.Liu T, Spincemaille P, de Rochefort L, Wong R, Prince M, Wang Y. Unambiguous identification of superparamagnetic iron oxide particles through quantitative susceptibility mapping of the nonlinear response to magnetic fields. Magn Reson Imaging. 2010 doi: 10.1016/j.mri.2010.06.011. [DOI] [PMC free article] [PubMed] [Google Scholar]
- 15.Donoho DL. Compressed sensing. Ieee T Inform Theory. 2006;52(4):1289–1306. [Google Scholar]
- 16.Candes E, Romberg J. Sparsity and incoherence in compressive sampling. Inverse Probl. 2007;23(3):969–985. [Google Scholar]
- 17.Lustig M, Donoho D, Pauly JM. Sparse MRI: The application of compressed sensing for rapid MR imaging. Magn Reson Med. 2007;58(6):1182–1195. doi: 10.1002/mrm.21391. [DOI] [PubMed] [Google Scholar]
- 18.Cukur T, Lustig M, Nishimura DG. Improving non-contrast-enhanced steady-state free precession angiography with compressed sensing. Magn Reson Med. 2009;61(5):1122–1131. doi: 10.1002/mrm.21907. [DOI] [PMC free article] [PubMed] [Google Scholar]
- 19.Hu S, Lustig M, Chen AP, Crane J, Kerr A, Kelley DA, Hurd R, Kurhanewicz J, Nelson SJ, Pauly JM, Vigneron DB. Compressed sensing for resolution enhancement of hyperpolarized 13C flyback 3D-MRSI. J Magn Reson. 2008;192(2):258–264. doi: 10.1016/j.jmr.2008.03.003. [DOI] [PMC free article] [PubMed] [Google Scholar]
- 20.Shmueli K, de Zwart JA, van Gelderen P, Li TQ, Dodd SJ, Duyn JH. Magnetic Susceptibility Mapping of Brain Tissue In Vivo Using MRI Phase Data. Magn Reson Med. 2009;62(6):1510–1522. doi: 10.1002/mrm.22135. [DOI] [PMC free article] [PubMed] [Google Scholar]
- 21.Rudin LI, Osher S, Fatemi E. Nonlinear Total Variation Based Noise Removal Algorithms. Physica D. 1992;60(1–4):259–268. [Google Scholar]
- 22.Lustig M, Donoho DL, Santos JM, Pauly JM. Compressed sensing MRI. Ieee Signal Proc Mag. 2008;25(2):72–82. [Google Scholar]
- 23.Sidky EY, Pan X. Image reconstruction in circular cone-beam computed tomography by constrained, total-variation minimization. Phys Med Biol. 2008;53(17):4777–4807. doi: 10.1088/0031-9155/53/17/021. [DOI] [PMC free article] [PubMed] [Google Scholar]
- 24.Khalidov I, Liu T, Chen X, Jin M, Prince M, Wang Y. Eliminating streaking artifacts in quantitative susceptibility mapping using L1 norm minimization. 2010:4994. [Google Scholar]
- 25.Schweser FL, BW, Deistung A, Reichenbach JR. A Novel Approach for Separation of Background Phase in SWI Phase Data Utilizing the Harmonic Function Mean Value Property. Proc Int Soc Mag Res Med. 2010 [Google Scholar]
- 26.Li W, Wu B, Liu C. Quantitative susceptibility mapping of human brain reflects spatial variation in tissue composition. Neuroimage. 2011;55(4):1645–1656. doi: 10.1016/j.neuroimage.2010.11.088. [DOI] [PMC free article] [PubMed] [Google Scholar]
- 27.Bagher-Ebadian H, Jiang Q, Ewing JR. A modified Fourier-based phase unwrapping algorithm with an application to MRI venography. J Magn Reson Imaging. 2008;27(3):649–652. doi: 10.1002/jmri.21230. [DOI] [PMC free article] [PubMed] [Google Scholar]
- 28.Volkov VV, Zhu Y. Deterministic phase unwrapping in the presence of noise. Opt Lett. 2003;28(22):2156–2158. doi: 10.1364/ol.28.002156. [DOI] [PubMed] [Google Scholar]
- 29.Lin FH, Kwong KK, Belliveau JW, Wald LL. Parallel imaging reconstruction using automatic regularization. Magn Reson Med. 2004;51(3):559–567. doi: 10.1002/mrm.10718. [DOI] [PubMed] [Google Scholar]
- 30.Dexter DT, Carayon A, Javoyagid F, Agid Y, Wells FR, Daniel SE, Lees AJ, Jenner P, Marsden CD. Alterations in the Levels of Iron, Ferritin and Other Trace-Metals in Parkinsons-Disease and Other Neurodegenerative Diseases Affecting the Basal Ganglia. Brain. 1991;114:1953–1975. doi: 10.1093/brain/114.4.1953. [DOI] [PubMed] [Google Scholar]
- 31.Griffiths PD, Crossman AR. Distribution of Iron in the Basal Ganglia and Neocortex in Postmortem Tissue in Parkinsons-Disease and Alzheimers-Disease. Dementia. 1993;4(2):61–65. doi: 10.1159/000107298. [DOI] [PubMed] [Google Scholar]
- 32.Hallgren B, Sourander P. The Effect of Age on the Non-Haemin Iron in the Human Brain. J Neurochem. 1958;3(1):41–51. doi: 10.1111/j.1471-4159.1958.tb12607.x. [DOI] [PubMed] [Google Scholar]
- 33.Chang CH, Ji J. Compressed sensing MRI with multichannel data using multicore processors. Magn Reson Med. 2010 doi: 10.1002/mrm.22481. [DOI] [PubMed] [Google Scholar]
- 34.Liu CL. Susceptibility Tensor Imaging. Magn Reson Med. 2010;63(6):1471–1477. doi: 10.1002/mrm.22482. [DOI] [PMC free article] [PubMed] [Google Scholar]
- 35.Lee J, Shmueli K, Fukunaga M, van Gelderen P, Merkle H, Silva AC, Duyn JH. Sensitivity of MRI resonance frequency to the orientation of brain tissue microstructure. P Natl Acad Sci USA. 2010;107(11):5130–5135. doi: 10.1073/pnas.0910222107. [DOI] [PMC free article] [PubMed] [Google Scholar]
- 36.Bartzokis G, Sultzer D, Cummings J, Holt LE, Hance DB, Henderson VW, Mintz J. In vivo evaluation of brain iron in Alzheimer disease using magnetic resonance imaging. Arch Gen Psychiat. 2000;57(1):47–53. doi: 10.1001/archpsyc.57.1.47. [DOI] [PubMed] [Google Scholar]
- 37.Chen JC, Hardy PA, Kucharczyk W, Clauberg M, Joshi JG, Vourlas A, Dhar M, Henkelman RM. Mr of Human Postmortem Brain-Tissue - Correlative Study between T2 and Assays of Iron and Ferritin in Parkinson and Huntington Disease. Am J Neuroradiol. 1993;14(2):275–281. [PMC free article] [PubMed] [Google Scholar]


