

Abstract
There is a need for a technology that can be incorporated into routine laboratory procedures to obtain a continuous, quantitative, fluorescence-based measurement of the dynamic behaviors of numerous individual living cells in parallel, while allowing other manipulations, such as staining, rinsing, and even retrieval of targeted cells. Here we report a simple, low cost microarray platform that can trap cells for dynamic single-cell analysis of mammalian cells. The elasticity of polydimethylsiloxane (PDMS) was utilized to trap tens of thousands of cells on an array. The PDMS microwell array was stretched by a tube through which cells were loaded on the array. Cells were trapped on the array by removal of the tube and relaxation of the PDMS. Once that was accomplished, the cells remained trapped on the array without continuous application of an external force and permitted subsequent manipulations, such as staining, rinsing, imaging, and even isolation of targeted cells. We demonstrate the utility of this platform by multicolor analysis of trapped cells and monitoring in individual cells real-time calcium flux after exposure to the calcium ionophore ionomycin. Additionally, a proof of concept for target cell isolation was demonstrated by using a microneedle to locally deform the PDMS membrane in order to retrieve a particular cell from the array.
Keywords: Bioanalytical methods, Cell systems / Single cell analysis, Biochips / High throughput screening
Introduction
Traditional cell-based assays yield data averaged across large numbers of cells, yet individual cells even clones differ in numerous characteristics, such as concentrations of critical ions and metabolites or expression of a gene [1]. Due to this heterogeneity, biochemical assays that analyze cells in bulk often overlook the rich information available when single cells are studied. Single cell studies have elucidated unique biological phenomena not discoverable by bulk sampling procedures. For example, fluorescent indicators of calcium ion (Ca2+) concentration have revealed that some cells have unique patterns of increases and decreases in Ca2+ concentration that are believed to encode information in their frequency, amplitude and organization [2]. These patterns are hidden when averaging Ca2+ concentration over a population due to differences in timing and response of individual cells. Single-cell measurements are also of value in studying mixed cell populations. In studies of disease states, analysis of a sample taken directly from a patient is complicated by the admixture of normal cells with diseased cells. Single-cell studies of tumor biopsies have shown that the majority of cells within a tumor may be normal, and that significant heterogeneity exists even among the abnormal cells, thus determination of the molecular characteristics of most tumors is limited by bulk analysis [3]. A caveat for single-cell approaches is that stochastic biological events or the chance analysis of a very rare cell can create noise which may confound observations; therefore, in addition to extending biological measurements beyond population averages, single-cell measurement techniques must retain the capacity to perform population statistics [4].
To monitor cellular properties as a function of time in a high-throughput, statistically relevant manner, it is often desirable to localize individual cells in an array format to maintain their position and prevent migration. Many different techniques have been applied for trapping cells for single-cell analysis, including passive confinement of cells in microwells [5-9], biochemical patterning [10,11], and direct printing [12]. A variety of techniques have also been described utilizing external forces such as hydrodynamic [13], mechanical [14-16], magnetic [17], dielectrophoretic [18], optical [19], acoustic [20], and microfluidic droplet formation [21]. The numerous techniques and microdevices developed for trapping cells for single-cell analysis have been covered recently by two excellent reviews to which the interested reader is referred [22,23].
The analysis of arrayed cells is typically fluorescence based, and a wide array of fluorescent reagents are now available to investigate cellular parameters including ion flux, gene expression, and protein synthesis and activity [24]. Fluorescent indicators have been used in conjunction with a variety of microfabricated devices to analyze single cells within an array, to manipulate isolated single cells, and to investigate the contents of disrupted single cells [25]. Microwell arrays have been the most widely adopted format for these fluorescence-based high-content analyses of single cells. The microwell format to trap and then analyze single, nonadherent cells on-chip is exemplified by early work using a glass-based device that led to a commercial product (LiveCell Array™, NUNC) [26]. High density arrays of hemispherical cavities were fabricated by etching wells into a glass surface. After cells were loaded into the wells, a glass coverslip was placed over the array to retain the cells in the microwells during wash and dye-loading steps; the wells being constructed in such a way that fluid added to one end of the device moved by capillary action across the array to enable reagent exchange, albeit slowly. The device was marketed for several years to carry out cell-based assays for high-content analyses, but has been discontinued due to its high per unit cost (~$100/array) and its fluid exchange characteristics.
One of the advantages to an array of cell traps is that once in a trap, each cell is held at a unique, fixed position on the array. Thus, the transient properties of thousands of cells can be individually monitored in parallel by capturing images sequentially using a conventional fluorescence microscope. Single-cell quantification can be obtained by analyzing the images using various software packages [27]. Although a diversity of cell arraying/trapping techniques have been reported as outlined above, each technique has its own merits and limitations. A microwell array, for example, provides the simplest way to segregate individual cells by merely using gravity-based sedimentation, but the cells are not actively held in place and can be easily dislodged from the array during washing or reagent exchange unless the microwells are covered, which limits fluidic exchange [26,28]. Various cell traps utilizing external forces, such as dielectrophoresis, require a relatively complex apparatus with sophisticated controllers, but these devices can generate a high cell trapping efficiency and offer cell manipulation or sorting functions [15,29,30].
Despite the plentiful cell trapping/arraying techniques available, there remains a need for an inexpensive, easy-to-use technology to effectively trap cells on an array to accomplish continuous, quantitative, fluorescence-based measurement of dynamic single-cell behaviors in a highly parallel manner, at the same time allowing other manipulations, such as staining, rinsing, and perhaps isolation of targeted cells for further analysis. Here we report a new method for trapping cells in a high-density array format by utilizing the elastic property of polydimethylsiloxane (PDMS). The working principle of trapping cells is simple and uncomplicated (Fig. 1A.). A microwell array was made of PDMS and stretched uniaxially by a plastic tube controlled by a micromanipulator. Cells were added to the tube and allowed to settle into the expanded microwells. Relaxation of the PDMS by removal of the tube resulted in contraction of the microwells around the cells, thus trapping them. Cells remained trapped for both imaging analysis and other manipulations, such as staining, rinsing, and single-cell retrieval. No sophisticated equipment is necessary for use of the array except for a microscope and a simple translation stage (e.g. a micromanipulator) which are already available in many biology labs. We demonstrate the utility of this platform by multicolor analysis of trapped cells and monitoring real-time Ca2+ flux in individual cells after ionomycin treatment. A proof of concept was demonstrated in using a microneedle to locally deform the PDMS membrane to retrieve a targeted cell from the array.
Fig. 1.

Reversible stretching of PDMS microwells and loading of cells on the array. (A) Schematic of the working principle of trapping cells by utilizing the elasticity of PDMS. (B) Schematic of uniaxially stretching a PDMS microwell array by pressing with a plastic tube. (C) Transmitted light images of a PDMS microwell array: (i) Original array, (ii) stretched array, (iii) cell loading on the stretched array, (iv) array relaxed with cells trapped in microwells. Scale bar = 50 μm. (D) Diameter of microwells vs. z-axis displacement of the plastic tube.
Experimental
Chemicals and materials
SU-8 photoresist was purchased from MicroChem Corp. (Newton, MA). Polydimethylsiloxane (PDMS) was prepared from the Sylgard 184 silicone elastomer kit (Dow Corning, Midland, MI). Polycarbonate plates (12 inch × 12 inch × 0.25 inch) were purchased from McMaster-Carr (Los Angeles, CA). CellTracker Green CMFDA, CellTracker Red CMTPX, CellTracker Blue CMAC, CellTracker Orange CMTMR, Fluo-3 AM, Oregon Green 488 carboxylic acid diacetate, Live/Dead viability/cytotoxicity kit, ionomycin, RPMI medium, fetal bovine serum (FBS), and penicillin/streptomycin were obtained from Invitrogen (Carlsbad, CA). All other reagents were from Fisher Scientific (Pittsburgh, PA). The Ba/F3 cell line was purchased from ATCC (Manassas, VA).
Fabrication of PDMS microwell arrays
Microwell arrays were fabricated by micromolding PDMS on an SU-8 master by the well-established soft lithography process [31]. The SU-8 master was fabricated by standard photolithography on a glass slide spin-coated with an SU-8 layer of 5 - 20 μm thickness [32]. The master mold was treated with 50 μL octyltrichlorosilane in a vapor-phase silanization process in a polycarbonate desiccator (Fisher Scientific): the desiccator was degassed by an oil-free pump for 2 min and then closed for 16 h. PDMS prepolymer (10:1 mixture of base:curing-agent in the Sylgard 184 kit) was spread on the master mold, and degassed under vacuum to remove trapped air bubbles. The slides were spin coated at 1000 rpm for 30 s, and then baked at 100 °C on a hotplate for 30 min to cure the PDMS. To maintain the flatness of the flexible PDMS array, a rigid cassette was used as the support for the array (Fig. 1B). The square cassette with a central, circular hole was machined from a polycarbonate sheet using a computer numerical control (CNC) machine. The size of the cassette was 1 inch × 1 inch × 0.25 inch and the diameter of the hole was 12 mm. Both the PDMS array (while still on the master) and cassette were treated in an air plasma cleaner (Harrick Plasma, Ithaca, NY) for 1 min, and a permanent bonding was formed by attaching the cassette to the PDMS array. The PDMS microwell array was transferred from the mold to the cassette by detaching the cassette from the mold. A photo of a flexible microwell array attached to the cassette is shown in Electronic Supplementary Material Fig. S1A.
Cell trapping by reversibly stretching the flexible microwell arrays
A simple stretching device was built to reversibly, uniaxially stretch the flexible PDMS microwell array prior to cell loading (Electronic Supplementary Material Fig. S1C). A manual micromanipulator (World Precision Instrument, model# M3301R) was mounted on an inverted microscope (Nikon Eclipse TE300). A plastic tube (diameter: 7 mm, length: 50 mm) cut from a 1 mL polypropylene pipet tip was attached to the micromanipulator. The tube was used to stretch the microwell array by applying circumferential pressure on the array in a downward direction as described below. The PDMS microwell array was treated in an air-plasma cleaner for 30 s to render its surface hydrophilic. The array was placed on the microscope stage and stretched by depressing the PDMS membrane with the plastic tube (Fig. 1B). Typically, 6 mm of z-axis displacement of the tube against the PDMS membrane surrounding the microwell array expanded the individual microwells from 12 μm to 20 μm in diameter (Fig. 1C-i and ii). Then 1 mL of a suspension of Ba/F3 cells (1.25 ×10⁶ cells/mL) in medium was added to the plastic tubing, and the cells were allowed to settle for 5 min to load the microwells (Fig. 1C-iii). The microscope stage was gently tapped with a finger at ~ 1 Hz to assist the cells settling into the microwells. The plastic tube was then slowly raised at a speed of ~ 2 mm/min to release tension on the PDMS membrane. Cells became trapped in the microwells as the flexible PDMS membrane relaxed to its original dimensions. To remove non-trapped cells, the cassette housing the array was tilted and the chamber was rinsed 5× with 1 mL of PBS buffer.
Optical image acquisition and analysis
In some experiments, Ba/F3 cells were pre-stained with a fluorescent marker (1 μM CellTracker Green, 10 μM CellTracker Red, or 10 μM Fluo-3 AM) before loading on the array following standard protocols provided by the manufacturer (Invitrogen, Carlsbad, CA). In other experiments, cells were stained on the array with a fluorescence marker (e.g. 10 μM Oregon Green 488 carboxylic acid diacetate) after being trapped, also following the manufacturer’s protocol. 3-D images of the trapped cells stained with Oregon Green 488 were obtained with a Leica SP2 microscope with an excitation wavelength of 488 nm. Static and dynamic cellular behaviors were characterized by imaging the array on a standard epifluorescence microscope (Olympus IX81) with appropriate filter sets (Chroma; Bellows Falls, VT). Images were collected with a cooled CCD camera (Photometrix Cool Snap HQ2; Roper Scientific, Tucson, AZ) using a simple image acquisition script implemented in MATLAB (MathWorks; Natick, MA) using a device interface provided by the open-source microscopy platform Micro-Manager [33]. Image acquisition was synchronized with a shutter (Sutter Instrument Lambda 10-2; Novato, CA) to minimize photobleaching and acquired using fixed exposure times over pre-programmed delays. Image acquisition speed was 10 seconds per image, and exposure time for each acquisition was 100-200 milliseconds depending on the fluorescence intensity to be measured.
Image analysis was performed using a custom script implemented in MATLAB based on a simplified approach to marker-controlled watershed segmentation [34]. The segmented images were then filtered for over or under-segmentation by rejecting objects differing from the median object area by +/− 25%. The resulting segmentation was used as a mask to integrate fluorescence intensities in the acquired images. For experiments in which dynamic properties were tracked, the brightest image in the sequence was selected for segmentation and the resulting mask applied to all images in the sequence.
Release of a targeted cell from the array using a microneedle
The trapped Ba/F3 cells were stained with Oregon Green 488. The array was turned over and placed in a Petri dish on two spacers (2 mm thickness). Medium was added to the space between array and Petri dish. A stainless steel needle with a tip diameter of 12.5 μm (Fine Science Tools; Foster City, CA) was attached to a micromanipulator. The targeted cell was released from the array by probing the backside of the PDMS membrane, causing localized deformation and expansion of the microwell holding the cell. The released cell then settled to the Petri dish.
Results and discussion
Reversible stretching of PDMS microwells
A flexible PDMS membrane containing a high density array of microwells was fabricated by micromolding and was secured to a rigid hollow polycarbonate cassette for reversible stretching. The PDMS membrane had a thickness of ~100 μm. The microwells making up the array possessed a diameter of 12 μm, a height of 15 μm, and an inter-well gap (rim-to-rim) of 5 μm. The entire array dimensions were 3 mm × 3 mm and contained 31,000 microwells. The fabrication could be easily extended to make a much larger array with the potential for high-throughput single-cell analysis of millions of cells. As an example, we have successfully fabricated an array with a dimension of 100 mm × 100 mm which can possess 3.6 × 10⁷ microwells (Electronic Supplementary Material Fig. S1B). Uniaxial stretching of the PDMS was performed simply by mechanically stretching the membrane using a rigid plastic tube (Fig. 1B) attached to and controlled by a manual micromanipulator. The stretching of the PDMS membrane caused the expansion of the microwell diameter (Fig. 1C-i and ii). The extent of stretching and the diameter of microwells were precisely controlled by the z-axis displacement of the micromanipulator (Fig. 1D). The microwells were directly imaged by brightfield microscopy during stretching, and the stretching was stopped when the desired diameter was achieved. For microwells with a diameter of 12 μm, 6 mm of z-axis displacement against the PDMS membrane expanded the microwell to a diameter of 20 μm. When the tube was withdrawn, the PDMS membrane relaxed and the diameter of the microwells returned to the original dimensions. It was found that the contraction curve was not completely coincident with the expansion curve (Fig. 1D). Although the expansion and contraction of microwells was not linearly dependent on the z-axis displacement, the microwells completely contracted to their original diameter when the tube was withdrawn from the array. PDMS (Sylgard 184) is an excellent elastomer with a tensile strength of 7.1 MPa and an elongation at break of 140% [35]. No breakage of the PDMS membranes has been encountered at a z-axis displacement of ≤6 mm in all experiments performed to date (n > 50).
High density single cell array on the flexible PDMS membrane
Cells were loaded onto the array as a suspension placed into the chamber formed by the tube pressing on the PDMS membrane (Fig. 1C-iii). The PDMS membrane remained flat under stretching so that cells distributed evenly across the array. Cells settled into the stretched microwells by gravity. It was found that vibration created by gentle tapping of the microscope stage aided cells in settling into microwells during sedimentation. Ba/F3, an immortalized murine bone marrow-derived pro-B-cell line, was used as a model cell line for the experiment. Ba/F3 cells are an increasingly popular tool in kinase drug discovery as well as single cell analysis. Ba/F3 cells possessed an average diameter of 14.1 ± 1.4 μm (n = 30). Each stretched microwell had a diameter of 20 μm, thus could only accommodate one cell. In initial experiments it was noted that two cells occasionally stacked on each other when the depth of the well was larger than the cell diameter. This double trapping of cells was nearly eliminated by reducing the depth of the microwells to 15 μm which was used in all experiments reported in the current paper.
After waiting 5 min for sedimentation of the cells, the PDMS membrane was made to slowly contract to its original size by withdrawing the tube. The diameter of microwells contracted from 20 μm to 12 μm trapping the cells in the microwells. To prevent expulsion of the cells from the traps during the contraction of the PDMS membrane, the withdrawal speed of the tube was required to be slow and steady. A withdrawal speed of ~2 mm/min was found to be appropriate. Fig. 1C-iv shows that a majority of microwells (277 out of 360 in this image) contained trapped cells after removal of the tube from the PDMS membrane. Empty microwells could be differentiated from filled microwells based on appearance, since the boundary of microwells filled with cells was blurred compared with empty microwells (Fig. 1C-iv). This difference in image quality can be explained by the difference in refractive index for the aqueous medium (1.33), cells (1.39-1.40) [36], and PDMS (1.43) [37]. The difference in refractive index between the well lumen and PDMS wall was less when the microwell was filled with a cell compared with an empty microwell (filled with medium).
Trapped Ba/F3 cells were stained with Oregon Green and then imaged under fluorescence. At 4× field of view (2.2 mm × 1.6 mm), most of 12,180 microwells were loaded with cells (Fig. 2A). The images were segmented to identify the wells with cells and the average intensity of each cell was recorded. In a single field, 9,556 cells were trapped in 12,180 microwells. Fig. 2B shows a magnified view of the same array. A more detailed evaluation of the parameters affecting trapping efficiency is given below.
Fig. 2.

High-density, single-cell array on the stretchable traps. (A) Fluorescence image (4× magnification) of trapped Ba/F3 cells on the array stained with Oregon Green 488 carboxylic acid diacetate. (B) Zoomed in view of a small region of the fluorescence image seen in “A”. (C) Confocal microscope image of a trapped Oregon-green-488-stained Ba/F3 cell on the array. The blue color is due to the reflection from the PDMS membrane. (D) SEM image of trapped cells on the array. Scale bar = 20 μm.
Confocal microscopy was used to provide 3D images of single Ba/F3 cells trapped in the PDMS microwells (Fig. 2C). Blue indicates the scatter from the PDMS membrane, and green indicates the fluorescence from cells stained with the Oregon green 488 dye. Since Ba/F3 cells are normally spherical, the image demonstrates that the cell was compressed into an oval shape when trapped in the microwell (diameter: 12 μm, depth: 15 μm). As a result, the cell partially protruded out of the well. An SEM image (Fig. 2D) verified this result. Depending on their size, most trapped cells partially protruded out of the well, while smaller ones were fully trapped inside the wells. Although the cells were trapped within the microwells, part of their plasma membrane was exposed to the overlying liquid so that the cells could interact with reagents applied to the extracellular medium.
The trapping was stable, permitting fluid exchange on the array without loss of trapped cells. To demonstrate the stability of cell trapping, the post-rinse cell retention was compared on both stretchable and standard (i.e. non-stretched) PDMS microwell arrays. The detailed procedures for cell loading and rinsing for both arrays were described in Electronic Supplementary Material. On the stretchable microwell array (diameter: 12 μm, height: 15 μm), 99.5 ± 0.3% of the cells were retained after rinsing (n = 5 images, 4,007 cells counted). On the standard PDMS microwell array (diameter: 20 μm, height: 15 μm), only 68.9 ± 18.6% cells were retained on the array after rinsing (n = 5 images, 1,465 cells counted). Thus, passive confinement of cells in standard microwells was found to be less effective at preventing cell loss than trapping in the stretchable array.
The trapping mechanism may affect the cell activity since the cells experienced a static mechanical compression, but the effect is largely unknown and deserves future study. To determine if cells remained viable after trapping, Ba/F3 cells were trapped on the array and incubated in RPMI medium for 4 hours under standard tissue culture conditions. A standard assay for viability (Live/Dead viability/cytotoxicity kit, Invitrogen) was used. Four hours after trapping, 100% (n = 3 independent experiments) remained viable. Furthermore, trapped cells were able to proliferate on the array. For example, Ba/F3 cells trapped on the array for 20 h proliferated and the progeny were found to have migrated out of the microwells (Electronic Supplementary Material Fig. S2). Cell proliferation indicated that cell viability was retained over many hours, but since daughter cells can migrate out of traps, this array is not designed for long-term analysis, e.g. over 6 hours.
A number of parameters were evaluated for their impact on cell trapping efficiency. Cell loading density, microwell diameter and depth, and extent of stretching were systematically studied (Electronic Supplementary Material Fig. S4). For Ba/F3 cells (average diameter 14.1 μm), the average cell trapping efficiency achieved was 65.3 ± 7.6% (n = 3 independent arrays, average ± standard deviation) when the cell loading density was 1.25 ×10⁶ cells/cm2, the microwell depth was 15 μm, the stretching z-axis displacement was 6 mm, and the non-stretched microwell diameter was 10-12 μm. For other cell types of varying size and/or distribution, these factors will likely need to be adjusted accordingly to achieve the optimal cell capture efficiency. As a general rule, the ideal cell trap would have a diameter of slightly smaller than the diameter of cells, so that cells can be effectively trapped without experiencing too much compression.
Compared with a standard microwell array, a major advantage of the stretchable microwell array is that the cells are trapped permitting washing or the exchange of reagents without dislodging cells from the array. A number of other cell trapping techniques have been reported which trap cells using various external forces [23]. Compared with these cell traps, the stretchable microwell array is simpler and easier-to-use. Once the cells are trapped on the array, the trapping is stable over at least 4 h without the need for continuous application of an active intervention.
Multicolor single-cell analysis
Many fluorescence-based assays for single-cell analysis require detection of two, or more, wavelengths. To demonstrate the ability to perform multicolor analysis of trapped cells on the array, a heterogeneous mixture of fluorescently labeled Ba/F3 cells was used. One portion of Ba/F3 cells was stained with CellTracker Green, and the other was stained with CellTracker Red. These two populations were mixed at an appropriate ratio of 4:1 (green:red), and the cells were trapped on the array and microscopically imaged using the green and red channels of a standard fluorescence detection system. Multiple images were taken on the same array. Fig. 3A shows a representative image stacked with both green and red fluorescence at 10× magnification. Fig. 3B shows a higher power image of the selected region (white dotted line). A composite image was generated by summing normalized images of the two channels. A scatter plot of the fluorescence intensity of 12,274 imaged cells is shown (Fig. 3C). Of the cells trapped in the array 77.9% exhibited strong fluorescence in the green channel while 22.0% exhibited strong red fluorescence. Only 0.16% of cells were found to exhibit both red and green fluorescence, possibly a result of double cell trapping, or fluorescence crosstalk between the red and green channels. Dyes of other fluorescence wavelengths, for example CellTracker Blue and Orange, were tested on the array as well. In three independent experiments, two arrays were loaded with samples composed of a mixed cell population containing a ratio of 4:1 CellTracker Orange: CellTracker Blue stained cells. In these experiments, 21.7 ± 0.5% of cells were detected in the blue channel (Electronic Supplementary Material Fig. S5). The small standard deviation demonstrates the repeatability of the experiment.
Fig. 3.
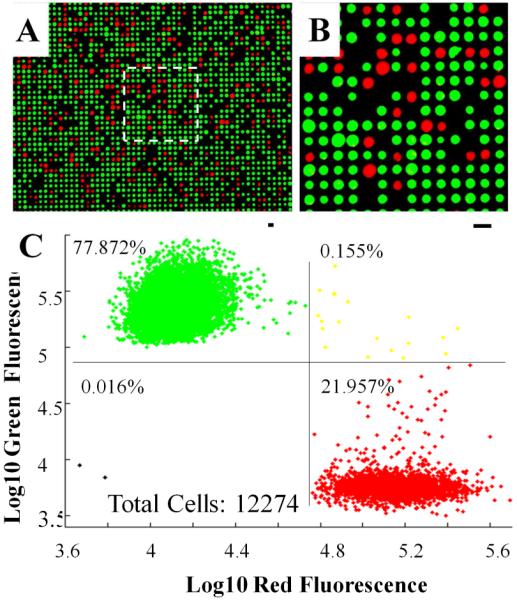
Two-color, single-cell analysis. (A) Fluorescence image (10×) of a mixture of Ba/F3 cells on the array stained with CellTracker Green or CellTracker Red. (B) 20× magnification of the region of the array indicated by the white dotted square, scale bar = 20 μm. (C) Dot plot of the fluorescence intensity of 12,274 cells.
Time-course of live single-cell kinetics of calcium flux
To evaluate whether trapped cells on the array could be monitored in real time to follow a dynamic property of single cells, Ba/F3 cells were stained with Fluo-3 calcium (Ca2+) indicator (10 μM) and then trapped on the array. Ionomycin is commonly used to raise the intracellular level of Ca2+ in cells. At low concentrations (100 nM) ionomycin acts by discharging the endoplasmic reticulum calcium store while at high concentrations (10 μM), ionomycin dissipates the calcium gradient across the plasma membrane. Ionomycin is commonly used as a research tool to understand Ca2+ transport across biological membranes. Ionomycin (100 nM or 10 μM) was added to the array, and images were acquired approximately every 500 milliseconds for 5 min. Per-cell fluorescence was quantified to track the dynamic response of the cells present in the field-of-view. Fig. 4A shows the fluorescence intensity vs. time for a randomly selected subset of the tracked cells, demonstrating the cellular heterogeneity in response to external stimuli even in a small population of cells (83 cells). Not surprisingly, large variations were found among individual cells in their initial fluorescence intensities and overall amplitude of their response to ionomycin, as well as the fluorescence decay following ionomycin treatment. The fluorescence intensity averaged from 860 cells is shown in Fig. 4B. The cells responded to ionomycin within 5-10 seconds of exposure. Fluorescence intensity increased rapidly and reached a maximum at around 1 min followed by a slow progressive decline, which is consistent with results reported by others [38]. The imaged cells were divided into three groups based on their initial fluorescence intensity before ionomycin exposure: 119 cells had high initial fluorescence response and showed the strongest absolute response to ionomycin, but decayed rapidly, 710 cells had a medium level of initial fluorescence and showed an intermediate response to ionomycin yet decayed slowly, and 31 cells had very low initial fluorescence and exhibited the weakest absolute response to ionomycin exposure (Fig. 4C). Fig. 4D shows the sensitivity of this platform in detecting the cellular response to low ionomycin concentrations (100 nM), a concentration of biological significance for cellular analysis. Thus, the variations among single cells in response to a stimulus were easily detected on this simple, low-cost array.
Fig. 4.

Time course for live single-cell kinetic measurements of Ca2+ flux after exposure to ionomycin (10 μM for A-C and 100 nM for D). (A) Fluorescence intensity vs. time for 83 randomly selected cells. (B) Average fluorescence intensity vs. time for 860 cells. (C) Out of 860 cells, three groups of cells can be sub-categorized based on their initial fluorescence response. (D) Average fluorescence intensity vs. time for 788 cells. The error bars in all graphs represent the standard deviation of the data points. These graphs were replicated with three different chips
Selective isolation of a targeted cell from the array
After analysis of living cells on the array, it may be desirable to retrieve a particular cell for expansion or destructive analysis, such as polymerase chain reaction (PCR). A few technologies have been reported for retrieving cells from microwell arrays, such as optical tweezers [39], and stimuli-responsive microwells [40]. In the type of array described here, the cells were trapped in microwells on a thin, flexible PDMS membrane. It was reasoned that a localized mechanical deformation of a microwell could cause deformation of the microwell causing release of its trapped cell. As a proof of concept, a microwell array with 20 μm inter-well gap was used. Fig. 5A shows cells (stained with Oregon Green 488) trapped on the array, and a targeted cell to be released denoted with an arrow. A needle was used to slowly probe the backside of the PDMS membrane to cause the localized deformation as indicated by the asterisk (Fig. 5B). The cell was released from the array, leaving an empty microwell site (Fig. 5C). The cell was collected in an underlying Petri dish (Fig. 5D). At the time image, the released cell was elongated (Fig. 5D), which is consistent with the elongated cell shape in the confocal image (Fig. 2C). Using a micromanipulator, we were able to precisely control the z-axis movement of the needle punch and obtained a reproducible recovery of individual cells in the proof-of-concept test (100% release, n=5 targeted cells).
Fig. 5.
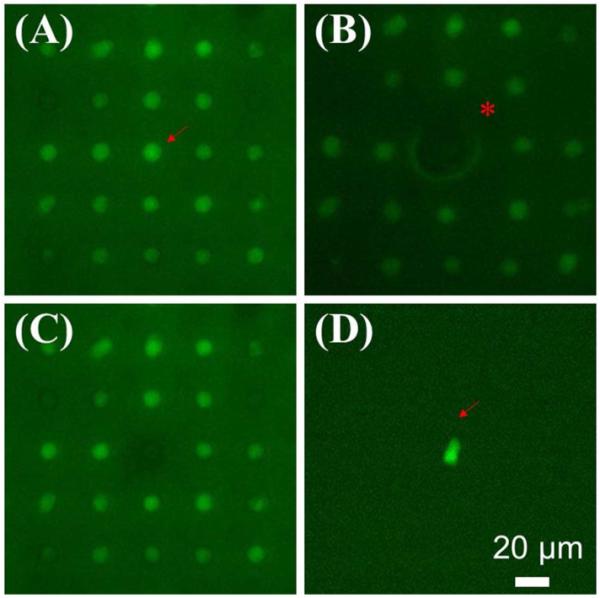
Selective retrieval of a targeted cell from the array by a microneedle. (A) Ba/F3 cells were trapped on the array and stained with Oregon Green 488. A targeted cell is indicated by an arrow. (B) Localized deformation was caused by a needle (asterisk). (C) The cell was released from the array leaving an empty microwell. (D) The targeted cell was collected in a Petri dish. Its elongated shape was due to its deformation while held in the microwell (see Fig. 2C). Scale bar = 20 μm.
Conclusions
The stretchable cell trap provides a low cost, easy-to-operate platform for a cell-based array, particularly suited for dynamic highly parallel analyses of single cells. The method uses a simple strategy to trap the cells at a given position on an array. Other cell trapping techniques suffer from either complex fabrication (e.g. dry etching, laser drilling, microelectrode deposition), or the need for an external apparatus to operate the trap devices (e.g. magnetic, optical, electrical, acoustic, mechanical, vacuum or hydrodynamic actuation). In the platform described here, the fabrication of PDMS microwell arrays by soft lithography is easily performed on a benchtop without the need for a cleanroom. The microwell can be reversibly and evenly stretched by a simple device to apply and then release pressure to trap the cells. Once that is accomplished, the cells remain trapped without continuous application of an external force. This platform uses readily available instruments (a microscope and a manipulator) and widely adopted fabrication technology (soft lithography). Also, unlike other cell trap techniques, individual laboratories can easily create and utilize the traps without access to high tech microfabrication facilities or sophisticated ancillary technologies. Cells trapped on the array permit subsequent manipulations, such as staining, rinsing, imaging, and even isolation of targeted cells. The stretchable microwell array will be of use in investigating dynamic cellular responses and cell-to-cell variability.
Supplementary Material
Acknowledgment
This research was supported by the NIH (EB007612 and EB012549). We thank Michelle Kovarik for helpful discussions.
References
- 1.Spiller DG, Wood CD, Rand DA, White MRH. Nature. 2010;465(7299):736–745. doi: 10.1038/nature09232. [DOI] [PubMed] [Google Scholar]
- 2.Berridge MJ, Bootman MD, Roderick HL. Nat Rev. 2003;4:517–529. doi: 10.1038/nrm1155. [DOI] [PubMed] [Google Scholar]
- 3.Bodey B. Exp Opin Biol Ther. 2002;2(4):371–393. doi: 10.1517/14712598.2.4.371. [DOI] [PubMed] [Google Scholar]
- 4.Altschuler SJ, Wu LF. Cell. 2010;141(4):559–563. doi: 10.1016/j.cell.2010.04.033. [DOI] [PMC free article] [PubMed] [Google Scholar]
- 5.Charnley M, Textor M, Khademhosseini A, Lutolf MP. Integrative Biology. 2009;1(11-12):625–634. doi: 10.1039/b918172p. [DOI] [PubMed] [Google Scholar]
- 6.Kim SM, Lee SH, Suh KY. Lab on a Chip. 2008;8(7):1015–1023. doi: 10.1039/b800835c. [DOI] [PubMed] [Google Scholar]
- 7.Rettig JR, Folch A. Analytical Chemistry. 2005;77(17):5628–5634. doi: 10.1021/ac0505977. [DOI] [PubMed] [Google Scholar]
- 8.Lee WC, Rigante S, Pisano AP, Kuypers FA. Lab on a Chip. 2010;10(21):2952–2958. doi: 10.1039/c0lc00139b. [DOI] [PubMed] [Google Scholar]
- 9.Ozawa T, Kinoshita K, Kadowaki S, Tajiri K, Kondo S, Honda R, Ikemoto M, Piao L, Morisato A, Fukurotani K, Kishi H, Muraguchi A. Lab on a Chip. 2009;9(1):158–163. doi: 10.1039/b810438g. [DOI] [PubMed] [Google Scholar]
- 10.Kane RS, Takayama S, Ostuni E, Ingber DE, Whitesides GM. Biomaterials. 1999;20(23-24):2363–2376. doi: 10.1016/s0142-9612(99)00165-9. [DOI] [PubMed] [Google Scholar]
- 11.Falconnet D, Csucs G, Grandin HM, Textor M. Biomaterials. 2006;27(16):3044–3063. doi: 10.1016/j.biomaterials.2005.12.024. [DOI] [PubMed] [Google Scholar]
- 12.Liberski AR, Delaney JT, Schubert US. Acs Combinatorial Science. 2011;13(2):190–195. doi: 10.1021/co100061c. [DOI] [PubMed] [Google Scholar]
- 13.Valero A, Merino F, Wolbers F, Luttge R, Vermes I, Andersson H, van den Berg A. Lab on a Chip. 2005;5(1):49–55. doi: 10.1039/b415813j. [DOI] [PubMed] [Google Scholar]
- 14.Di Carlo D, Wu LY, Lee LP. Lab on a Chip. 2006;6(11):1445–1449. doi: 10.1039/b605937f. [DOI] [PubMed] [Google Scholar]
- 15.Hosokawa M, Arakaki A, Takahashi M, Mori T, Takeyama H, Matsunaga T. Analytical Chemistry. 2009;81(13):5308–5313. doi: 10.1021/ac900535h. [DOI] [PubMed] [Google Scholar]
- 16.Schiffenbauer YS, Kalma Y, Trubniykov E, Gal-Garber O, Weisz L, Halamish A, Sister M, Berke G. Lab on a Chip. 2009;9(20):2965–2972. doi: 10.1039/b904778f. [DOI] [PubMed] [Google Scholar]
- 17.Liu W, Dechev N, Foulds IG, Burke R, Parameswaran A, Park EJ. Lab on a Chip. 2009;9(16):2381–2390. doi: 10.1039/b821044f. [DOI] [PubMed] [Google Scholar]
- 18.Taff BM, Voldman J. Analytical Chemistry. 2005;77(24):7976–7983. doi: 10.1021/ac0513616. [DOI] [PubMed] [Google Scholar]
- 19.Grier DG. Nature. 2003;424(6950):810–816. doi: 10.1038/nature01935. [DOI] [PubMed] [Google Scholar]
- 20.Shi JJ, Ahmed D, Mao X, Lin SCS, Lawit A, Huang TJ. Lab on a Chip. 2009;9(20):2890–2895. doi: 10.1039/b910595f. [DOI] [PubMed] [Google Scholar]
- 21.Brouzes E, Medkova M, Savenelli N, Marran D, Twardowski M, Hutchison JB, Rothberg JM, Link DR, Perrimon N, Samuels ML. Proceedings of the National Academy of Sciences of the United States of America. 2009;106(34):14195–14200. doi: 10.1073/pnas.0903542106. [DOI] [PMC free article] [PubMed] [Google Scholar]
- 22.Nilsson J, Evander M, Hammarstrom B, Laurell T. Analytica Chimica Acta. 2009;649(2):141–157. doi: 10.1016/j.aca.2009.07.017. [DOI] [PubMed] [Google Scholar]
- 23.Lindstrom S, Andersson-Svahn H. Lab on a Chip. 2010;10(24):3363–3372. doi: 10.1039/c0lc00150c. [DOI] [PubMed] [Google Scholar]
- 24.Giepmans BNG, Adams SR, Ellisman MH, Tsien RY. Science. 2006;312:217–224. doi: 10.1126/science.1124618. [DOI] [PubMed] [Google Scholar]
- 25.Sims CE, Allbritton NL. Lab Chip. 2007;7:423–440. doi: 10.1039/b615235j. [DOI] [PubMed] [Google Scholar]
- 26.Deutsch M, Deutsch A, Shirihai O, Hurevich I, Afrimzon E, Shafrana Y, Zurgila N. Lab Chip. 2006;6:995–1000. doi: 10.1039/b603961h. [DOI] [PubMed] [Google Scholar]
- 27.Park MC, Hur JY, Cho HS, Park SH, Suh KY. Lab on a Chip. 2011;11(1):79–86. doi: 10.1039/c0lc00114g. [DOI] [PubMed] [Google Scholar]
- 28.Yamamura S, Kishi H, Tokimitsu Y, Kondo S, Honda R, Rao SR, Omori M, Tamiya E, Muraguchi A. Analytical Chemistry. 2005;77(24):8050–8056. doi: 10.1021/ac0515632. [DOI] [PubMed] [Google Scholar]
- 29.Fuchs AB, Romani A, Freida D, Medoro G, Abonnenc M, Altomare L, Chartier I, Guergour D, Villiers C, Marche PN, Tartagni M, Guerrieri R, Chatelain F, Manaresi N. Lab on a Chip. 2006;6(1):121–126. doi: 10.1039/b505884h. [DOI] [PubMed] [Google Scholar]
- 30.Gray DS, Tan JL, Voldman J, Chen CS. Biosensors & Bioelectronics. 2004;19(12):1765–1774. doi: 10.1016/j.bios.2004.03.016. [DOI] [PubMed] [Google Scholar]
- 31.Qin D, Xia YN, Whitesides GM. Nature Protocols. 2010;5(3):491–502. doi: 10.1038/nprot.2009.234. [DOI] [PubMed] [Google Scholar]
- 32.Datasheet T SU-8 Photoresist Formulations. http://www.microchem.com/products/su_eight.htm.
- 33.Edelstein A, Amodaj N, Hoover K, Vale R, Stuurman N. Current Protocols in Molecular Biology. 2010:14.20.11–14.20.17. doi: 10.1002/0471142727.mb1420s92. [DOI] [PMC free article] [PubMed] [Google Scholar]
- 34.Malpica N, deSolorzano CO, Vaquero JJ, Santos A, Vallcorba I, GarciaSagredo JM, delPozo F. Cytometry. 1997;28(4):289–297. doi: 10.1002/(sici)1097-0320(19970801)28:4<289::aid-cyto3>3.0.co;2-7. [DOI] [PubMed] [Google Scholar]
- 35.Product Information, SYLGARD® 184 Silicone Elastomer. Dow Corning Corporation; [Google Scholar]
- 36.Liang XJ, Liu AQ, Lim CS, Ayi TC, Yap PH. Sensors and Actuators A-Physical. 2007;133(2):349–354. [Google Scholar]
- 37.Horvath R, Lindvold LR, Larsen NB. Journal of Micromechanics and Microengineering. 2003;13(3):419–424. [Google Scholar]
- 38.Zhang XL, Yin HB, Cooper JM, Haswell SJ. Electrophoresis. 2006;27(24):5093–5100. doi: 10.1002/elps.200600390. [DOI] [PubMed] [Google Scholar]
- 39.Luo CX, Li H, Xiong CY, Peng XL, Kou QL, Chen Y, Ji H, Ouyang Q. Biomedical Microdevices. 2007;9(4):573–578. doi: 10.1007/s10544-007-9066-2. [DOI] [PubMed] [Google Scholar]
- 40.Tekin H, Anaya M, Brigham MD, Nauman C, Langer R, Khademhosseini A. Lab on a Chip. 2010;10(18):2411–2418. doi: 10.1039/c004732e. [DOI] [PMC free article] [PubMed] [Google Scholar]
Associated Data
This section collects any data citations, data availability statements, or supplementary materials included in this article.