

Abstract
Use of the final size distribution of minor outbreaks for the estimation of the reproduction numbers of supercritical epidemic processes has yet to be considered. We used a branching process model to derive the final size distribution of minor outbreaks, assuming a reproduction number above unity, and applying the method to final size data for pneumonic plague. Pneumonic plague is a rare disease with only one documented major epidemic in a spatially limited setting. Because the final size distribution of a minor outbreak needs to be normalized by the probability of extinction, we assume that the dispersion parameter (k) of the negative-binomial offspring distribution is known, and examine the sensitivity of the reproduction number to variation in dispersion. Assuming a geometric offspring distribution with k=1, the reproduction number was estimated at 1.16 (95% confidence interval: 0.97–1.38). When less dispersed with k=2, the maximum likelihood estimate of the reproduction number was 1.14. These estimates agreed with those published from transmission network analysis, indicating that the human-to-human transmission potential of the pneumonic plague is not very high. Given only minor outbreaks, transmission potential is not sufficiently assessed by directly counting the number of offspring. Since the absence of a major epidemic does not guarantee a subcritical process, the proposed method allows us to conservatively regard epidemic data from minor outbreaks as supercritical, and yield estimates of threshold values above unity.
Keywords: Basic reproduction number, Branching process, Statistical model, Likelihood function, Confidence interval
Highlights
► Even for supercritical process, the available data may be limited to minor outbreaks. ► Final size distribution of minor outbreaks is derived assuming R0>1. ► The proposed method was used to estimate R0 of pneumonic plague. ► Given only minor outbreak data, estimation of R0 is not sufficiently achieved by directly counting the number of offspring. ► Minor outbreak data need to be assessed by both subcritical and supercritical assumptions.
1. Introduction
The basic reproduction number, R 0 is a summary measure of the transmission potential of infectious diseases, interpreted as the average number of secondary cases generated by a typical primary case throughout its entire course of infection in a fully susceptible population (Diekmann and Heesterbeek, 2000). Because of the well-known threshold property (Anderson, 1991), given R 0<1 we observe only minor outbreaks in which the infectious agent goes extinct before affecting a substantial fraction of the population (Diekmann and Heesterbeek, 2000). Given R 0>1, an introduction of a single infected individual into a population could potentially lead to a major epidemic, which does not naturally decline until the pool of susceptible individuals falls below a critical proportion, and in which substantial fraction of the population thus experiences infection (though, as we will discuss in the present study, it must be remembered that R 0>1 can also result in minor outbreaks). Accordingly, R 0 has played a key role in identifying optimal strategies for infectious disease control (Keeling and Rohani, 2007), including the determination of vaccination coverage required to eradicate an infectious disease (Anderson and May, 1991).
Various statistical methods have been employed to estimate R 0 based on empirical data from epidemic or endemic diseases. These include maximum likelihood method and the use of estimators obtained from biomathematical and theoretical studies (Dietz, 1993, Farrington et al., 2001, Li et al., 2011). Recently, the estimation of R 0 has mainly focused on the analysis of early exponential (linear) growth rates (Chowell et al., 2007, Vynnycky et al., 2007). This type of analysis requires the prior observation of an actual major epidemic. However, it is frequently the case for rare and exotic diseases that we rarely (or never) observe a major epidemic prior to an actual large-scale epidemic event (e.g. severe acute respiratory syndrome (SARS) from 2002 to 2003).
Also, an observed single epidemic curve represents only a single sample path profile (i.e. a single stochastic realization) of all possible sample paths (Lindsey, 2001, van den Broek and Nishiura, 2009), and thus, a model and estimate for R 0 explicitly accounting for demographic stochasticity are needed (Becker, 1989, Andersson and Britton, 2000). Branching process approximation is one stochastic modeling approach. The discrete-type branching process is referred to as Galton–Watson process (Harris, 1963), and the process with infection–age structure is referred to as Crump–Mode–Jagers (CMJ) process (Jagers, 1975, Mode and Sleeman, 2000). Other than the branching processes, a martingale model has been employed to estimate R 0 and its uncertainty based on a single sample of the final size of a major epidemic (i.e. based on a single observation of cumulative incidence) (Becker, 1989). For theoretical purposes, not only the analysis of single samples of the final size, but also final size distributions of major epidemics have been well analyzed through the so-called Sellke-construction (Andersson and Britton, 2000, Ball and O'Neill, 1999, Ball and Clancy, 1993, Nishiura et al., 2011a). While major epidemics have attracted modelers’ interest, little attention has been paid to the final size distribution of minor outbreaks. Only a small number of studies have analyzed the final size distribution of minor outbreaks adopting the key assumption that a subcritical process (i.e. R 0<1) resulted in the observation (Becker, 1974). Classical mortal branching process models have been applied to surveillance data for diseases such as measles and avian influenza (Farrington et al., 2003, Ferguson et al., 2004). However, the final size distribution of minor outbreak data given a supercritical process (i.e. R 0>1) have not been explicitly examined to date.
The purpose of the present study is to estimate R 0 for a supercritical process based on the final size distribution of minor outbreaks. We illustrate the estimation method with application to primary pneumonic plague. In the next section, we begin with a description of our practical motivations.
2. Materials and methods
2.1. Pneumonic plague
This study considers the human-to-human transmission of primary pneumonic plague, a fatal clinical presentation of bacterial infection with Yersinia pestis. Presently, primary pneumonic plague is rarely observed; though the form of bubonic plague transmitted by flea bites (in humans and rodents) is sometimes reported (Pollitzer, 1954). When infected fleas bite humans, transmission of the bubonic plague with fever and lymph node swelling is possible. If Y. pestis gets into the blood stream, septicemic plague occurs. Systemic circulation of Y. pestis can also progress to the “secondary pneumonic plague”, a lung infection spreadable through respiratory droplet and from which an epidemic of primary pneumonic plague can occur. However, pneumonic plague is not transmitted by aerosols (i.e. not by droplet nuclei) but by droplet infection (Kool, 2005). In the absence of early treatment, the case fatality ratio of pneumonic plague can reach 100% (Pollitzer, 1954). Due to the high virulence of Y. pestis, industrialized countries across the world have identified its potential for use in biological warfare (Inglesby et al., 2000). For these reasons, knowledge of the human-to-human transmission potential of pneumonic plague is a critical question among experts.
Several studies have analyzed historical outbreak data of primary pneumonic plague, estimating the reproduction number R h of human-to-human transmission (i.e. the average number of secondary human cases directly caused by a single human primary case of pneumonic plague). Gani and Leach (2004) fitted a geometric distribution directly to observed distributions of secondary cases produced by a single primary case based on eight minor outbreak data sets showing transmission networks (i.e. a network showing who acquired infection from whom based on contact tracing). They found a mean and variance of 1.3 and 3.1, respectively. However, minor outbreak data are limited to outbreaks that decline to extinction and include substantial numbers of primary cases that did not generate any secondary transmissions. To avoid potential underestimation of R h, Nishiura and Kakehashi (2005) focused on time-dependency in the transmissibility and Nishiura et al. (2006) estimated the initial value of the reproduction number (i.e. theoretical R h at time 0 of an epidemic) as ranging from 2.8 to 3.5. Lloyd-Smith et al. (2005) took into account the effectiveness of public health interventions, fitting a branching process model with a negative binomially distributed offspring distribution to a transmission network, estimating R h as 1.32 (90% confidence interval (CI): 1.01–1.61) and dispersion parameter as k=1.37 (90% CI: 0.88–3.53). They identified that published outbreak data tended to start with a superspreading event (implying that an R h of 2.8–3.5 in Nishiura et al. (2006) may be overestimated), and that the offspring distribution of pneumonic plague is not overdispersed. Other published studies on this subject include an analysis of minor outbreak data by directly counting the number of offspring (Egan, 2010) and a reanalysis of major epidemic data from Manchuria, 1911 in which the absence of bubo among pneumonic plague cases was partly noted (Nishiura, 2006). Overall, the mean number of human secondary cases per single human primary case (i.e. R h) is likely to be greater than unity (because we observed an actual major epidemic in Manchuria) with a relatively small variance in the offspring distribution. Since historical data for pneumonic plague are scarce, the finding of R h being slightly greater than unity should be validated using several other methods.
The present study examined historical minor outbreak data (see Table 1 for a summary). We include outbreaks known to be the pneumonic plague (through bacteriological confirmation) and involving two or more cases (i.e. outbreaks with at least one secondary transmission event). These limits are necessary as the frequency of bubonic plague is much higher than that of pneumonic plague in literature, and it was not considered feasible to collect reports with only one pneumonic plague case. Indeed, the reporting of no offspring is usually underestimated (Lloyd-Smith, 2007). We also ignored transmission events from animals to humans (e.g. dog-to-human transmission). Since an explicit estimation of the effectiveness of interventions is too challenging from only small minor outbreak data, and because previous studies documented extinction events or a decline in the number of cases before implementing control measures (Egan, 2010, Nishiura et al., 2006), we ignore the influence of public health interventions on the transmission dynamics. It should be noted that a few published studies explicitly took into account the timing and effectiveness of interventions (Gani and Leach, 2004, Lloyd-Smith et al., 2005, Egan, 2010). As bacteriological confirmation was a prerequisite for inclusion, most of the outbreaks studied occurred in the 20th century. Included are 18 minor outbreaks and 1 major epidemic. Among the 18 minor outbreaks, there was mean of 14.7 cases (standard deviation: 13.3), and a median of 11 cases (quartiles: 3–21). All of these outbreaks started with only one index case.
Table 1.
Reported outbreaks of primary pneumonic plague since the 20th century.
The total number of cases includes index case.
There were two independent clusters of pneumonic plague cases.
Not only to validate published findings of transmission potential, but we used the minor outbreak data to overcome the scarcity of data on pneumonic plague. The occurrence of a major epidemic in Manchuria ( Fig. 1) possibly suggests that R h>1. Using the pneumonic plague as an example, we aim to demonstrate a method that uses minor outbreak data for an assessment of the reproduction number in a supercritical process. Where possible, reproduction numbers should be estimated using major epidemic data. However, bites from infected fleas also cause human plague. Therefore, major epidemic data that involved many cases without confirmation of the absence of bubo and are not independent of flea biting may not be appropriate for the estimation of R h, because the time evolution of cases may be influenced by other modes of transmission (e.g. those arising directly or indirectly from bubonic plague cases). Also, dead rodents were observed during the 1911 epidemic in Manchuria, indicating an involvement of bubonic plague (Temporary Quarantine Section, Kanto Totokufu, 1912). To limit our interest to human-to-human transmission, we do not use R 0 to refer to the transmission potential of pneumonic plague and hereafter consistently use R h.
Fig. 1.
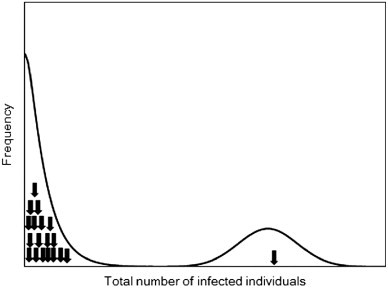
The distribution of final epidemic size. The final size distribution of a homogeneously mixing population usually exhibits a bimodal shape where the first peak represents minor outbreaks and the second peak corresponds to the mode of major epidemics. Arrows indicate the available evidence for the final size of pneumonic plague (18 minor outbreaks and 1 major epidemic).
2.2. Probability generating functions of supercritical branching process
Assuming R h>1, we considered a statistical model for analyzing the final size distribution of minor outbreaks. We used a discrete-time Galton–Watson (GW) process. This has been used to estimate a subcritical threshold parameter based on a mortal branching process model (Becker, 1974, Farrington et al., 2003). The model can also be regarded as an embedded age-dependent CMJ process (Jagers, 1975, Mode and Sleeman, 2000). Let Y be the integer-valued random variable representing the total size of an epidemic (including the index case), described by the embedded GW process with X n cases in generation n. We have
| (1) |
Let p y represent the probability that the total number of cases is y, i.e., Pr(Y=y). Also, let π be the probability of extinction. Since R h is assumed as greater than 1, the final size Y is infinite with probability (1−π). In other words, we have
| (2) |
Let the probability mass function of the offspring distribution ξ be f k. As a well-known property of the GW process (Harris, 1963), the probability generating function (pgf) h(s) is written as
| (3) |
for s∈[0,1]. With an assumption R h>1, we assume that R h=h′(1)>1. If the offspring distribution follows a negative binomial distribution with dispersion parameter k, the probability of extinction is calculated by
| (4) |
With a gamma-distributed infectious period and constant infectiousness, k in Eq. (4) could be interpreted as being equivalent to an inverse of the coefficient of variation of the infectious period (Anderson and Watson, 1980, Britton and Lindenstrand, 2009). Poisson and geometric distributions are special cases of the negative binomial distribution with k→∞ and k=1, respectively. The derivatives of h(s), which are required later, are
| (5) |
and
| (6) |
Similarly, the total outbreak size is also considered, i.e.
| (7) |
Here we consider g(s) as if it were the probability generating function (though it is not, because g(1)=π≤1 (Yan, 2008)). Eq. (7) is useful to determine the probability p k. For n=1, 2, 3, …, the sequence of partial sums is considered:
| (8) |
For s∈[0.1], let
| (9) |
be the pgf of the random variable Y n. Since Y 1=1+X 1, we have (Mode and Sleeman, 2000):
| (10) |
Moreover, let {Y nk; k=1, 2, …, X 1} be a collection of independently and identically distributed copies of Y n. For every n≥1,
| (11) |
leading us to find that
| (12) |
By applying the dominated convergence theorem, the pgf of the random variable Y satisfies
| (13) |
for s∈[0,1].
2.3. The final size distribution of minor outbreaks
Since R h>1, we have Eq. (2), and thus, the conditional distribution of the final size which starts with one primary case (conditioned on minor outbreak) is
| (14) |
Closed-form solution does not always exist for g(s). For the negative binomial distribution, Eq. (13) is rewritten as
| (15) |
For y=1,
| (16) |
For y≥2, the distribution is recursively calculated as (Yan, 2008)
| (17) |
These can be numerically checked using (5), (6) for y=2 and 3. When k→∞, Eq. (17) agrees with the Borel–Tanner distribution (Farrington et al., 2003). When k=1, the distribution is geometric:
| (18) |
as derived by Mode and Sleeman (2000) and confirmed by Yan (2008).
Given a total of m complete observations, each with information of the final size n i, including an index case, and assuming that k is known, the likelihood function to estimate R h is
| (19) |
However, we excluded all observations of y=1 (i.e. index cases with no secondary case were excluded) and the observed distribution is thus truncated. The likelihood should now read
| (20) |
The probability of extinction π depends on both R h and k, but assuming that k is known for now, π is written as a function of R h. We consider five different values of k being 1/3, 1/2, 1, 2 and 3, because a previous study analyzing transmission networks of pneumonic plague estimated k at 1.37 (90% CI: 0.88–3.53) (Lloyd-Smith et al., 2005). Five possible k correspond to a plausible range of the dispersion parameter, and also account for the fact that overdispersed k<1 are more likely to be missed in empirical observations. Provided that k=1/2, 1 or 2, we have
| (21) |
for k=1/2,
| (22) |
as is well known for k=1 (i.e. the case of geometric distribution), and
| (23) |
for k=2. To compare likelihood values to assess goodness of fit, we used Akaike Information Criterion (AIC). In the case of k=1, it is a conventional geometric offspring distribution with only one unknown parameter (R h). In the other four scenarios (k≠1), we need the parameters R h and k, and both were regarded as unknown.
2.4. Estimation of the reproduction number using two other methods
Focusing on the data in Table 1 we used two other methods to estimate R h. The first was to estimate R h based on the observed probability of extinction, assuming that the dispersion parameter of the offspring distribution is known. Among 19 samples in Table 1, only one major epidemic was reported, and thus, the probability of extinction was 18/19. Using this, we estimated R h from the relationship π=18/19. It should be emphasized that this method required us to adopt an unrealistic assumption that the data in Table 1 fully represented the total occurrences of pneumonic plague outbreaks (including immediate extinctions and thus the final size distribution is not truncated).
Second, we estimated R h from the major epidemic data. Fig. 2 shows an epidemic curve in Manchuria, 1911. We estimated the intrinsic growth rate r, which is also referred to as the Malthusian growth rate. Assuming that generation time follows a gamma distribution with mean μ=5.66 days and coefficient of variation v=0.644 (where the standard deviation σ satisfies σ=μv=3.65 days), the reproduction number was calculated using the following estimator derived from the Euler–Lotka equation (Wallinga and Lipsitch, 2007):
| (24) |
Fig. 2.
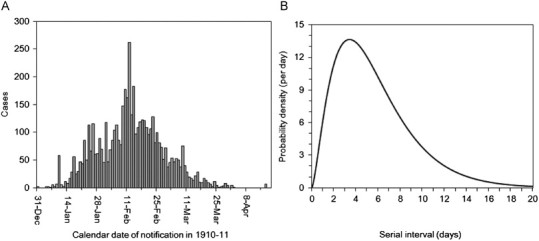
Epidemiological dynamics of primary pneumonic plague in Manchuria, China from 1910 to 1911: (A) daily number of plague notifications in and around the area under direct political control of the Japanese empire (n=5009). (B) Probability density function of the serial interval for primary pneumonic plague. The mean (and standard deviation) serial interval has been estimated at 5.66 (3.65) days (Nishiura, 2006).
This argument permits us to replace r by the right-hand side of
| (25) |
We estimated R h (or r) based on a pure birth process. Given observations of the cumulative number of cases on day 0, 1, …, t, C(0), C(1), …C(t), we have
| (26) |
which can be used to construct a likelihood function for r:
| (27) |
Detailed derivation of the likelihood is given elsewhere (Bailey, 1964, Nishiura et al., 2009). The likelihood function (27) was used for estimating R h. Profile likelihood was used to derive 95% confidence intervals. Since the generation time of pneumonic plague has yet to be fully quantified (Nishiura, 2010, Klinkenberg and Nishiura, 2011), we investigated the sensitivity of R h to different μ ranging from 3.66 to 7.66 days, corresponding to empirically observed quartiles of 3–7 days (Nishiura, 2006).
3. Results
3.1. Estimate of Rh based on the sample probability of extinction
Assuming that the samples in Table 1 (n=19) represented the total presentations of a pneumonic plague case into a fully susceptible population, the probability of epidemic would be calculated as 100(1−π)=5.26%. If the number of secondary cases per single primary case is geometrically distributed, we get
| (28) |
For other dispersion parameters of the negative-binomially distributed offspring distribution (k=1/3, 1/2, 2 and 3), R h is calculated using a solution of (4) (e.g. see (21), (22), (23)) and estimated as 1.12, 1.08, 1.04 and 1.04, respectively. As the offspring distribution becomes overdispersed, the estimate of R h increases due to the fixed nature of the data used.
3.2. Estimate of Rh based on the final size distribution of minor outbreaks
Table 2 shows the estimates of R h based on the final size of minor outbreaks. As mentioned above, we assumed k as a known quantity and considered possible integer values of k (or an inverse of integer values) in realistic ranges. When the offspring distribution is geometric, R h is 1.16 (95% CI: 0.97, 1.38). When overdispersed with k=1/3 and 1/2, the maximum likelihood estimates of R h were 1.22 and 1.19, respectively. When less dispersed with k=2 and 3, R h was estimated at 1.14 and 1.13, respectively. This qualitative pattern occurs because empirical data are fixed and only the dispersion parameter is varied. In terms of AIC, the geometric distribution appeared to yield the best fit, consistent with Lloyd-Smith et al. (2005). The estimate based on the sample probability of extinction was not significantly deviated from the above-mentioned crude estimate.
Table 2.
Estimates of the threshold parameter of primary pneumonic plague based on minor outbreak data (n=18).
| Dispersion parameter (k) | Reproduction number (95% CI)a | AICb | |
|---|---|---|---|
| 1/3 | Overdispersed | 1.22 (0.95, 1.60) | 139.0 |
| 1/2 | ↑ | 1.19 (0.96, 1.49) | 138.8 |
| 1 | Geometric distribution | 1.16 (0.97, 1.38) | 136.3 |
| 2 | ↓ | 1.14 (0.98, 1.32) | 137.7 |
| 3 | Less dispersed | 1.13 (0.98, 1.30) | 137.5 |
CI, Confidence intervals, derived from profile likelihood.
AIC, Akaike Information Criterion.
3.3. Estimate of Rh based on growth data from a major epidemic
Fig. 3A shows the results from conditionally fitting exponential growth to the major epidemic data. Assuming that the mean generation time is 5.66 days, the reproduction number is estimated as 2.16 (95% CI: 2.06–2.28) which is significantly greater than the estimates of R h based on minor outbreak data. As the mean generation time varied from 3.66 to 7.66 days, the maximum likelihood estimate of R h also varied from 1.59 to 2.96 (Fig. 3B). The lower 95% CI of R h with the shortest assumed mean generation time (3.66 days) was 1.54 and was significantly greater than estimates based on minor outbreak data, except for the unrealistically overdispersed offspring distribution (k≤1/3).
Fig. 3.
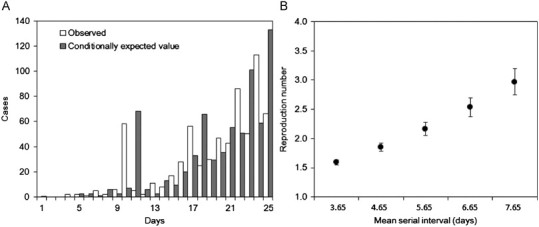
Transmission dynamics of primary pneumonic plague in Manchuria, China from 1910 to 1911: (A) observed (white) and predicted (gray) daily numbers of primary pneumonic plague cases. Assuming exponential growth, the daily growth rate (and the 95% confidence intervals) was estimated at 0.16 (0.15, 0.17) per day. Day 1 corresponds to 1 January 1911. (B) The sensitivity of the reproduction number to different mean lengths of the generation time ranging from 3.65 to 7.65 day. Circles represent maximum likelihood estimates, while the whiskers extend to the upper and lower 95% confidence intervals based on the profile likelihood.
4. Discussion
The present study proposed a method for the estimation of the threshold parameter of a supercritical process, based on the final size distribution of minor outbreaks. The method was applied to pneumonic plague, which rarely occurs and has limited availability of major epidemic data. To estimate R h using the proposed method, the likelihood function must be conditioned on minor outbreak and include the probability of extinction in the denominator. Therefore, the dispersion parameter was assumed as known to rewrite the probability of extinction as a function of R h (and eliminate the probability of extinction from the likelihood). For this reason, we examined the sensitivity of R h to various dispersion parameters k of the negative binomial distribution. As a result, the geometric offspring distribution yielded R h=1.16 and a less dispersed offspring distribution with k=2 suggested an R h of 1.14. These estimates are in concordance with those reported from an analysis of transmission networks (Lloyd-Smith et al., 2005) and did not differ substantially from estimates calculated from directly counting the number of secondary cases per primary case from a transmission tree (Gani and Leach, 2004). Overall, the human-to-human transmission potential of plague is not very high, and is close to a critical level, in good agreement with field observations (Begier et al., 2006, Kool, 2005).
Given that an observed outbreak represents only a single sample path profile of all possible sample paths, there are certain diseases for which the occurrence of a major epidemic is rare, with most of the available data being from minor outbreaks. The present study shows that this can happen even when the underlying process is supercritical (R h>1), but the probability of major epidemic is small. The pneumonic plague most likely illustrates this case. Even though most historical data arise from observed small outbreaks, what is more important in public health is the assessment of the transmission potential of a major epidemic, such as that occurring in Manchuria. However, large-scale outbreaks of plague cannot avoid contamination by the flea–rodent cycle, and thus, if our interest is limited to precise estimation of human-to-human transmission potential, large epidemics may not be useful. Clearly, pneumonic plague is a disease that required an estimation of the reproduction number using the proposed method. Our study indicates that, given only minor outbreaks, epidemiological assessment of the transmission potential is not sufficiently achieved by directly counting the number of offspring in the transmission tree (because the reproduction number to be estimated is likely to be below 1 given minor outbreaks, even in the case of supercritical process). As long as our objective is to assess the transmission potential, minor outbreak data need to be interpreted with caution adopting assumptions of both subcritical and supercritical processes.
Assuming the dispersion parameter as a known quantity is not regarded as a significant weakness of the proposed approach for a number of reasons. First, data from of transmission network can be used to derive a prior estimate and plausible range for the dispersion parameter k. Second, given a plausible range of k, we can assess the sensitivity of the reproduction number to different k, and check the robustness of our findings. Third, if assuming k as a known quantity is regarded as implausible (or impractical), one should be able to employ a special case, i.e. geometric, to the offspring distribution and (perhaps) conservatively estimate the reproduction number.
The reproduction number was estimated to be as high as 1.59–2.96 based on early growth data from the major epidemic in Manchuria, 1911. There are several explanations for this potential overestimation. First, although the majority of cases were believed as primary pneumonic plague in Manchuria (due to absence of bubo), Y. pestis was isolated from dead rodents at the time (Temporary Quarantine Section, Kanto Totokufu, 1912). The outbreak undoubtedly involved bubonic plague and thus transmission routes other than human-to-human transmission during the course of the epidemic. Consequently, the growth rate is greater than that based only on human-to-human transmission, illustrating the difficulty in estimating R h from major epidemic data. Second, validity of R h based on epidemic growth rates is vulnerable to various epidemiological characteristics including heterogeneity and mobility of host population (Mercer et al., 2011, Nishiura et al., 2010, Nishiura and Kamiya, 2011). Indeed, as described by Nishiura (2006), the data in Fig. 2A was extracted from the Japanese area only, probably ignoring dynamics in surrounding geographical areas in Manchuria. It remains that the exponential growth rate is useful epidemiological information, offering important insights into estimating R h. However, we must be mindful of the relevant pitfalls in the interpretation of the growth rate, and perhaps validate the estimate using other methods, as outlined in the present study.
As the probability of extinction could be higher in heterogeneously mixing populations (Nishiura et al., 2011b), the proposed method could have underestimated R h. Our model accounts for dispersion (Garske and Rhodes, 2008), but the negative binomially distributed offspring distribution represents only contact heterogeneity at individual levels. In reality, contact heterogeneity depends on the contact network structure in a population (Trapman, 2007), often elevating the probability of extinction as compared with models with approximate network structures. Moreover, we assumed that the index case was in the population from the beginning of its infectiousness, although the involvement of imported cases in secondary transmission tends to be delayed (Nishiura and Inaba, 2011, Nishiura and Roberts, 2010, Roberts and Nishiura, 2011). Thus, the potential underestimation of R h should be considered a limitation of the proposed method.
Because of the need to interpret minor outbreak data carefully, we believe that the proposed method should always be chosen as one of estimation methods given minor outbreak data and would be very useful for estimating the transmission potential, especially for rare diseases. When we observe only minor outbreaks, it must be remembered that the absence of a major epidemic does not always guarantee that the pathogen's transmission potential is subcritical (Begier et al., 2006), and in such an instance, assessment of the transmission potential cannot rely only on directly counting the number of offspring. Thus, the proposed method allows us to conservatively regard the epidemic process leading to minor outbreaks as supercritical and produce the supercritical threshold parameter estimate. As long as we are not sure if the reproduction number is below unity, the investigation of minor outbreak data should always be accompanied by the proposed analysis. We believe that our estimation method has high potential for application to other data sets and we plan to extend the method to the analysis of minor outbreak data in heterogeneously mixing populations.
Acknowledgments
This study was supported by the University of Hong Kong Seed Funding Program for Basic Research (Project Code: 201109159007), the Harvard Center for Communicable Disease Dynamics from the US National Institutes of Health Models of Infectious Disease Agent Study (MIDAS) program (award number 1 U54 GM088558) and the Japan Science and Technology Agency PRESTO program. The content is solely the responsibility of the authors and does not necessarily represent the official views of the National Institute of General Medical Sciences or the National Institutes of Health.
References
- Anderson D., Watson R. On the spread of disease with gamma-distributed latent and infectious periods. Biometrika. 1980;67:191–198. [Google Scholar]
- Anderson R.M. Discussion: the Kermack–McKendrick epidemic threshold theorem. Bull. Math. Biol. 1991;53:3–32. doi: 10.1016/s0092-8240(05)80039-4. [DOI] [PubMed] [Google Scholar]
- Anderson R.M., May R.M. Oxford University Press; Oxford: 1991. Infectious Diseases of Humans: Dynamics and Control. [Google Scholar]
- Andersson H., Britton T. Springer; New York: 2000. Stochastic Epidemic Models and their Statistical Analysis, Lecture Notes in Statistics. [Google Scholar]
- Anonymous . U.S. Department of Health, Education and Welfare; Washington DC: 1955. Public Health Monograph No. 26: A History of Plague in the United States. [Google Scholar]
- Anonymous Bubonic and pneumonic plague—Uganda, 2006. Morb. Mortal Wkly. Rep. 2009;58:778–781. [PubMed] [Google Scholar]
- Bailey N.T.J. Wiley; New York: 1964. The Elements of Stochastic Processes with Applications to the Natural Sciences. [Google Scholar]
- Ball F., Clancy D. The final size and severity of a generalised stochastic multitype epidemic model. Adv. Appl. Probab. 1993;25:721–736. [Google Scholar]
- Ball F., O'Neill P. The distribution of general final state random variables for stochastic epidemic models. J. Appl. Probab. 1999;36:473–491. [Google Scholar]
- Becker N.G. On parametric estimation for mortal branching processes. Biometrika. 1974;61:393–399. [Google Scholar]
- Becker N.G. Chapman and Hall; London: 1989. Analysis of Infectious Disease Data. [Google Scholar]
- Begier E.M., Asiki G., Anywaine Z., Yockey B., Schriefer M.E., Aleti P., Ogen-Odoi A., Staples J.E., Sexton C., Bearden S.W., Kool J.L. Pneumonic plague cluster, Uganda, 2004. Emerg. Infect. Dis. 2006;12:460–467. doi: 10.3201/eid1203.051051. [DOI] [PMC free article] [PubMed] [Google Scholar]
- Black J., Black D. Plague in East Suffolk 1906–1918. J. R. Soc. Med. 2000;93:530–543. doi: 10.1177/014107680009301014. [DOI] [PMC free article] [PubMed] [Google Scholar]
- Britton T., Lindenstrand D. Epidemic modelling: aspects where stochasticity matters. Math. Biosci. 2009;222:109–116. doi: 10.1016/j.mbs.2009.10.001. [DOI] [PubMed] [Google Scholar]
- Brygoo E.R., Gonon M. Une epidemie de peste pulmonaire dans le nord-est de Madagascar. Bull. Soc. Pathol. Exot. 1958;51:47–60. (in French) [PubMed] [Google Scholar]
- Bulstrode H.T. Report to the Local Government Board upon the occurrence in the autumn of 1910 of four deaths at Freston near Ipswich, from a rapidly fatal and infectious malady diagnosed as pneumonic plague, and upon the prevalence of plague in rodents in Suffolk and Essex. Together with a report upon two localized outbreaks of disease in East Suffolk in 1909–10 and 1906–7 which may have been instances of bubonic and pneumonic plague respectively. Bull. Soc. Exot. Pathogens. 1927;20:1–55. [Google Scholar]
- Chowell G., Ammon C.E., Hengartner N.W., Hyman J.M. Estimating the reproduction number from the initial phase of the Spanish flu pandemic waves in Geneva, Switzerland. Math. Biosci. Eng. 2007;4:457–470. doi: 10.3934/mbe.2007.4.457. [DOI] [PubMed] [Google Scholar]
- Dickie, W.M., 1926. Plague in California 1900–1925. In: Proceedings of the Conference on State and Provisional Health Authorities, North America, vol. 21, pp. 30–78.
- Diekmann O., Heesterbeek J.A.P. Wiley; New York: 2000. Mathematical Epidemiology of Infectious Diseases: Model Building, Analysis and Interpretation, Wiley Series in Mathematical & Computational Biology. [Google Scholar]
- Dietz K. The estimation of the basic reproduction number for infectious diseases. Stat. Methods Med. Res. 1993;2:23–41. doi: 10.1177/096228029300200103. [DOI] [PubMed] [Google Scholar]
- Egan J.R. A plague on five of your houses—statistical re-assessment of three pneumonic plague outbreaks that occurred in Suffolk, England, between 1906 and 1918. Theor. Biol. Med. Model. 2010;7:39. doi: 10.1186/1742-4682-7-39. [DOI] [PMC free article] [PubMed] [Google Scholar]
- Farrington C.P., Kanaan M.N., Gay N.J. Estimation of the basic reproduction number for infectious diseases from age-stratified serological survey data. Appl. Stat. 2001;50:251–292. [Google Scholar]
- Farrington C.P., Kanaan M.N., Gay N.J. Branching process models for surveillance of infectious diseases controlled by mass vaccination. Biostatistics. 2003;4:279–295. doi: 10.1093/biostatistics/4.2.279. [DOI] [PubMed] [Google Scholar]
- Ferguson N.M., Fraser C., Donnelly C.A., Ghani A.C., Anderson R.M. Public health. Public health risk from the avian H5N1 influenza epidemic. Science. 2004;304:968–969. doi: 10.1126/science.1096898. [DOI] [PubMed] [Google Scholar]
- Gabastou J.M., Proano J., Vimos A., Jaramillo G., Hayes E., Gage K., Chu M., Guarner J., Zaki S., Bowers J., Guillemard C., Tamayo H., Ruiz A. An outbreak of plague including cases with probable pneumonic infection, Ecuador, 1998. Trans. R. Soc. Trop. Med. Hyg. 2000;94:387–391. doi: 10.1016/s0035-9203(00)90114-7. [DOI] [PubMed] [Google Scholar]
- Gani R., Leach S. Epidemiologic determinants for modeling pneumonic plague outbreaks. Emerg. Infect. Dis. 2004;10:608–614. doi: 10.3201/eid1004.030509. [DOI] [PMC free article] [PubMed] [Google Scholar]
- Garske T., Rhodes C.J. The effect of superspreading on epidemic outbreak size distributions. J. Theor. Biol. 2008;253:228–237. doi: 10.1016/j.jtbi.2008.02.038. [DOI] [PubMed] [Google Scholar]
- Gupta M.L., Sharma A. Pneumonic plague, northern India, 2002. Emerg. Infect. Dis. 2007;13:664–666. doi: 10.3201/eid1304.051105. [DOI] [PMC free article] [PubMed] [Google Scholar]
- Harris T.E. Springer; Berlin: 1963. The Theory of Branching Processes. [Google Scholar]
- Inglesby T.V., Dennis D.T., Henderson D.A., Bartlett J.G., Ascher M.S., Eitzen E., Fine A.D., Friedlander A.M., Hauer J., Koerner J.F., Layton M., McDade J., Osterholm M.T., O'Tooole T., Parker G., Perl T.M., Russell P.K., Schoch-Spana M., Tonat K. Plague as a biological weapon: medical and public health management. Working Group on Civilian Biodefense. JAMA. 2000;283:2281–2290. doi: 10.1001/jama.283.17.2281. [DOI] [PubMed] [Google Scholar]
- Jagers P. John Wiley and Sons; London: 1975. Branching Processes with Biological Applications. [Google Scholar]
- Joshi K., Thakur J.S., Kumar R., Singh A.J., Ray P., Jain S., Varma S. Epidemiological features of pneumonic plague outbreak in Himachal Pradesh, India. Trans. R. Soc. Trop. Med. Hyg. 2009;103:455–460. doi: 10.1016/j.trstmh.2008.11.026. [DOI] [PubMed] [Google Scholar]
- Keeling M.J., Rohani P. Princeton University Press; Princeton: 2007. Modeling Infectious Diseases in Humans and Animals. [Google Scholar]
- Kellogg W.H. An epidemic of pneumonic plague. Am. J. Public Health. 1920;10:599–605. doi: 10.2105/ajph.10.7.599. [DOI] [PMC free article] [PubMed] [Google Scholar]
- Klinkenberg D., Nishiura H. The correlation between infectivity and incubation period of measles, estimated from households with two cases. J. Theor. Biol. 2011;284:52–60. doi: 10.1016/j.jtbi.2011.06.015. [DOI] [PubMed] [Google Scholar]
- Kool J.L. Risk of person-to-person transmission of pneumonic plague. Clin. Infect. Dis. 2005;40:1166–1172. doi: 10.1086/428617. [DOI] [PubMed] [Google Scholar]
- Li J., Blakeley D., Smith? R.J. The failure of R0. Comp. Math. Methods Med. 2011;2011:527610. doi: 10.1155/2011/527610. [DOI] [PMC free article] [PubMed] [Google Scholar]
- Lindsey J.K. 2nd edition. Oxford University Press; Oxford: 2001. Nonlinear Models for Medical Statistics, Oxford Statistical Science Series. [Google Scholar]
- Lloyd-Smith J.O. Maximum likelihood estimation of the negative binomial dispersion parameter for highly overdispersed data, with applications to infectious diseases. PLoS One. 2007;2:e180. doi: 10.1371/journal.pone.0000180. [DOI] [PMC free article] [PubMed] [Google Scholar]
- Lloyd-Smith J.O., Schreiber S.J., Kopp P.E., Getz W.M. Superspreading and the effect of individual variation on disease emergence. Nature. 2005;438:355–359. doi: 10.1038/nature04153. [DOI] [PMC free article] [PubMed] [Google Scholar]
- McLean K.L. An outbreak of plague in Northwestern Province, Zambia. Clin. Infect. Dis. 1995;21:650–652. doi: 10.1093/clinids/21.3.650. [DOI] [PubMed] [Google Scholar]
- Mercer G.N., Glass K., Becker N.G. Effective reproduction numbers are commonly overestimated early in a disease outbreak. Stat. Med. 2011;30:984–994. doi: 10.1002/sim.4174. [DOI] [PubMed] [Google Scholar]
- Mode C.T., Sleeman C.K. World Scientific Publishing; Singapore: 2000. Stochastic Processes in Epidemiology: HIV/AIDS, Other Infectious Diseases and Computers. [Google Scholar]
- Murdock J.R. Pneumonic plague in Ecuador during 1939. Public Health Rep. 1940;55:2172–2178. [Google Scholar]
- Nishiura H. Epidemiology of a primary pneumonic plague in Kantoshu, Manchuria, from 1910 to 1911: statistical analysis of individual records collected by the Japanese Empire. Int. J. Epidemiol. 2006;35:1059–1065. doi: 10.1093/ije/dyl091. [DOI] [PubMed] [Google Scholar]
- Nishiura H. Time variations in the generation time of an infectious disease: implications for sampling to appropriately quantify transmission potential. Math. Biosci. Eng. 2010;7:851–869. doi: 10.3934/mbe.2010.7.851. [DOI] [PubMed] [Google Scholar]
- Nishiura H., Chowell G., Castillo-Chavez C. Did modeling overestimate the transmission potential of pandemic (H1N1-2009)? Sample size estimation for post-epidemic seroepidemiological studies. PLoS One. 2011;6:e17908. doi: 10.1371/journal.pone.0017908. [DOI] [PMC free article] [PubMed] [Google Scholar]
- Nishiura H., Chowell G., Safan M., Castillo-Chavez C. Pros and cons of estimating the reproduction number from early epidemic growth rate of influenza A (H1N1) 2009. Theor. Biol. Med. Model. 2010;7:1. doi: 10.1186/1742-4682-7-1. [DOI] [PMC free article] [PubMed] [Google Scholar]
- Nishiura H., Cook A.R., Cowling B.J. Assortativity and the probability of epidemic extinction: a case study of pandemic influenza A (H1N1-2009) Interdiscip. Perspect. Infect. Dis. 2011;2011:194507. doi: 10.1155/2011/194507. [DOI] [PMC free article] [PubMed] [Google Scholar]
- Nishiura H., Inaba H. Estimation of the incubation period of influenza A (H1N1-2009) among imported cases: addressing censoring using outbreak data at the origin of importation. J. Theor. Biol. 2011;272:123–130. doi: 10.1016/j.jtbi.2010.12.017. [DOI] [PubMed] [Google Scholar]
- Nishiura H., Kakehashi M. Real time estimation of reproduction numbers based on case notifications. Effective reproduction number of primary pneumonic plague. Trop. Med. Health. 2005;33:127–132. [Google Scholar]
- Nishiura H., Kamiya K. Fever screening during the influenza (H1N1-2009) pandemic at Narita International Airport, Japan. BMC Infect. Dis. 2011;11:111. doi: 10.1186/1471-2334-11-111. [DOI] [PMC free article] [PubMed] [Google Scholar]
- Nishiura H., Klinkenberg D., Roberts M., Heesterbeek J.A.P. Early epidemiological assessment of the virulence of emerging infectious diseases: a case study of an influenza pandemic. PLoS One. 2009;4:e6852. doi: 10.1371/journal.pone.0006852. [DOI] [PMC free article] [PubMed] [Google Scholar]
- Nishiura, H., Roberts, M.G., 2010. Estimation of the reproduction number for 2009 pandemic influenza A(H1N1) in the presence of imported cases. Euro. Surveill. 15, pii=19622. [DOI] [PubMed]
- Nishiura H., Schwehm M., Kakehashi M., Eichner M. Transmission potential of primary pneumonic plague: time inhomogeneous evaluation based on historical documents of the transmission network. J. Epidemiol. Community Health. 2006;60:640–645. doi: 10.1136/jech.2005.042424. [DOI] [PMC free article] [PubMed] [Google Scholar]
- Pollitzer R. World Health Organization; Geneva: 1954. Plague. [Google Scholar]
- Ratsitorahina M., Chanteau S., Rahalison L., Ratsifasoamanana L., Boisier P. Epidemiological and diagnostic aspects of the outbreak of pneumonic plague in Madagascar. Lancet. 2000;355:111–113. doi: 10.1016/S0140-6736(99)05163-6. [DOI] [PubMed] [Google Scholar]
- Roberts M.G., Nishiura H. Early estimation of the reproduction number in the presence of imported cases: pandemic influenza H1N1-2009 in New Zealand. PLoS One. 2011;6:e17835. doi: 10.1371/journal.pone.0017835. [DOI] [PMC free article] [PubMed] [Google Scholar]
- Temporary Quarantine Section, Kanto Totokufu . Manchurian Daily Press; Dalian: 1912. Epidemic Record of Plague during 1910–1911. [Google Scholar]
- Tieh T.H., Landauer E., Miyagawa F., Kobayashi G., Okayasu G. Primary pneumonic plague in Mukden 1946, with report of 39 cases with three recoveries. J. Infect. Dis. 1948;82:52–58. doi: 10.1093/infdis/82.1.52. [DOI] [PubMed] [Google Scholar]
- Trapman P. On analytical approaches to epidemics on networks. Theor. Popul. Biol. 2007;71:160–173. doi: 10.1016/j.tpb.2006.11.002. [DOI] [PubMed] [Google Scholar]
- van den Broek J., Nishiura H. Using epidemic prevalence data to jointly estimate reproduction and removal. Ann. Appl. Stat. 2009;3:1505–1520. [Google Scholar]
- Van Zwanenberg D. The last epidemic of plague in England? Suffolk 1906–1918. Med. Hist. 1970;14:63–74. doi: 10.1017/s0025727300015143. [DOI] [PMC free article] [PubMed] [Google Scholar]
- Viseltear A.J. The pneumonic plague epidemic of 1924 in Los Angeles. Yale J. Biol. Med. 1974;1:40–54. [PMC free article] [PubMed] [Google Scholar]
- Vynnycky E., Trindall A., Mangtani P. Estimates of the reproduction numbers of Spanish influenza using morbidity data. Int. J. Epidemiol. 2007;36:881–889. doi: 10.1093/ije/dym071. [DOI] [PubMed] [Google Scholar]
- Wallinga J., Lipsitch M. How generation intervals shape the relationship between growth rates and reproductive numbers. Proc. R. Soc. London Ser. B. 2007;274:599–604. doi: 10.1098/rspb.2006.3754. [DOI] [PMC free article] [PubMed] [Google Scholar]
- Wynne-Griffith G. Pneumonic plague in Rangoon. Lancet. 1948;1:625–627. doi: 10.1016/s0140-6736(48)90812-5. [DOI] [PubMed] [Google Scholar]
- Yan P. Distribution theory, stochastic processes and infectious disease modeling. In: Brauer F., van den Driessche P., Wu J., editors. Mathematical Epidemiology. Springer; New York: 2008. pp. 229–293. [Google Scholar]