Abstract
The E2F-1 transcription factor is post-translationally modified and stabilized in response to various forms of DNA damage to regulate the expression of cell-cycle and pro-apoptotic genes. The sustained overexpression of E2F-1 is a characteristic feature of gastric cancer. In this study, we investigated the role of short hairpin RNA (shRNA) targeting E2F-1 gene on human gastric cancer MGC-803 cell growth in vivo, and preliminarily revealed the mechanism. Thus, we constructed recombinant pGCSIL-GFP-shRNA-E2F-1 lentiviral vector to knock down E2F-1 expression in human gastric cancer MGC-803 cells in vivo, and studied the effect of E2F-1 shRNA on growth of MGC-803 tumor and evaluated its treatment efficacy. Our data demonstrated that in a mouse model of established gastric cancer, intratumor injection of lentiviral shRNA targeting E2F-1 definitely decreased the endogenous E2F-1 mRNA and protein expression in MGC-803 tumor, and inhibited tumor growth and promoted tumor cells apoptosis. Moreover, we found that E2F-1 shRNA increased the expression of phosphatase and tensin homolog (PTEN), activated caspase-3 and caspase-9, and suppressed nuclear factor (NF)-κB expression in tumor tissue as determined by reverse transcription (RT)-PCR and western blotting. In summary, shRNA targeting of E2F-1 can effectively inhibits human gastric cancer MGC-803 cell growth in vivo and may be a potential therapeutic strategy for gastric cancer.
Keywords: E2F1 transcription factor, gene therapy, lentivirus, RNA interference, stomach neoplasms
Introduction
Despite the decline in its incidence in the past few decades, gastric cancer remains the second most common cause of cancer-related deaths worldwide, and about two-thirds of gastric cancer cases occur in developing countries, and 42% in China alone (Parkin et al., 2005; Amiri, 2011). Many patients lose the chance of surgery because of their systemic condition, whereas others cannot tolerate the side effects of chemotherapy or radiotherapy, and there is a paucity of meaningful treatment strategies (Cunningham et al., 2005). Thus, it is necessary to find a new way to inhibit cancer cell growth effectively and avoid the side effects of drugs or radioactivity. Gene-targeting therapies have proved to be a promising way to achieve this goal.
Dysregulation of gene expression is integral to the neoplastic process, and there is now compelling evidence implicating upregulation or downregulation of multiple genes in the development and progression of gastric cancer. The E2F family of transcription factors can control the transcription of a group of genes that are normally regulated for cell proliferation and cell-cycle progression (Polager and Ginsberg, 2008). E2F-1, as a member of this gene family, is crucial for E2F-dependent apoptotic program (Lazzerini Denchi and Helin, 2005).
Nevertheless, the role of E2F-1 as an oncogene or tumor suppressor gene is still in dispute at the present time (Johnson, 2000). High E2F-1 levels exerte a growth-suppressing effect on osteosarcomas cells and breast cancer cells, and induced arrest of human small cell lung cancer growth in nude mice (Liontos et al., 2009; Brown et al., 2010; Shi et al., 2011). However, several investigators have reported that sustained E2F-1 overexpression is a characteristic feature of human cancer (Sowers et al., 2003; Huang et al., 2007; Xiao et al., 2007; Molina-Privado et al., 2009). Knockdown of E2F-1 is considered to be a tumor suppressor in melanoma cells (Alla et al., 2010). In our previous study, we also have found that upregulation or downregulation of E2F-1 can shRNA-E2F-1 group; 2, Lv-shRNA-NC group; 3, PBS group. suppress gastric cancer progression in vitro, but the mechanisms are unknown (Xiao et al., 2007; Xie et al., 2009b).
It is widely known that RNA interference (RNAi)-based approaches include small interfering RNA (siRNA) and short hairpin RNA (shRNA), which can be used to silence the expression of target genes in mammalian cells. Compare with siRNA, shRNA has high efficiency for transfection in primary and nondividing cells. Lentivirus can transfect both dividing and non-dividing cells at high efficiency and also sustains long-term gene expression by integrating into the host genome (Pfeifer et al., 2006; Gropp and Reubinoff, 2007). Therefore, lentiviral vector is considered as the most suitable delivery method for RNAi technology.
In the present research, we constructed recombinant shRNA-expressing lentiviral vector targeting E2F-1, and observed the effects of E2F-1 downregulation on the growth and apoptosis of MGC-803 cells in vivo after intratumoral injection of recombinant E2F-1 shRNA lentiviruse into nude mice. To reveal the possible mechanism, we also showed the effects of E2F-1 shRNA on the expression of PTEN, caspase-3, caspase-9 and NF-κB in MGC-803 cells in vivo.
Results
Construction and identification of pGCSIL-GFP-shRNA-E2F-1 lentiviral vector
Positive clones were confirmed by DNA sequence analysis (data not shown) and demonstrated that shRNA coding frames and frame sequences were correct, which indicated that the recombinant pGCSIL-GFP-shRNA-E2F-1 and pGCSIL-GFP-shRNA-NC plasmids were constructed successfully.
Determination of lentivirus titers
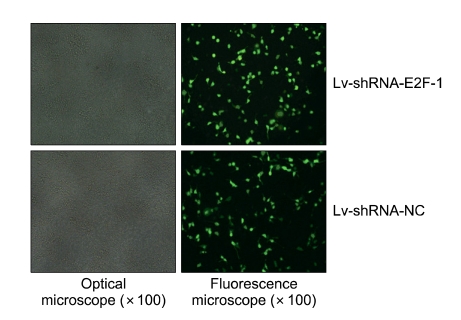
Lentivirus targeting E2F-1 and -NC (Lv-shRNA-E2F-1, and Lv-shRNA-NC) was produced by co-transfection with packaging vector (pHelper1.0) and vesicular stomatitis virus glycoprotein (VSVG) expression plasmid (pHelper2.0) into 293T cells. As shown in Figure 1, Lv-shRNA-E2F-1 or Lv-shRNA-NC was packaged in 293T cells and the viral titer was determined to be in the range of 5 × 10⁸ TU/ml medium by green fluorescent protein (GFP) assay.
Figure 1.
Recombinant lentivirus transfected into 293T cells to determine viral titer by the method of end point dilution through counting the numbers of infected green cells under fluorescence microscope (original manification × 100). The viral dilution factor was 1:1000.
E2F-1 shRNA inhibits MGC-803 tumor growth
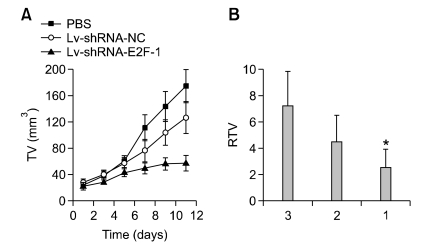
The ability of downregulation of E2F-1 to inhibit MGC-803 tumor growth was evaluated by injecting recombinant lentivirus into established flank tumors. As shown in Figure 2A, the tumor growth curves indicated that mice treated with Lv-shRNA-E2F-1 showed a significant inhibition of tumor growth when compared with those treated with control vector Lv-shRNA-NC or PBS (P < 0.05). The relative tumor volume of the Lv-shRNA-E2F-1 mice was significantly smaller than that of the control groups (P < 0.05) at 12 days after tumor injection, whereas no difference was found between the Lv-shRNA-NC and PBS groups (P > 0.05) (Figure 2B). The tumor weight in the Lv-shRNA-E2F-1 group was 0.637 ± 0.061 g, which was significantly less than 2.225 ± 0.079 g in the Lv-shRNA-E2F-1 group and 2.334 ± 0.087 g from PBS group (P < 0.05).
Figure 2.
(A) Tumor growth curve showed a significant growth tendency in PBS group and in Lv-shRNA-NC group, while the MGC-803 tumor growth in Lv-shRNA-E2F-1 group was obviously inhibited. (B) The relative tumor volume in Lv-shRNA-E2F-1 treated mice was smaller than that in animals from control group respectively at 12 days after tumor injection and presented as means ± SEM (n = 6 animals for each condition) using ANOVA and Student-Newman-Keuls analyses (*P < 0.05). Lanes: 1, Lv-shRNA-E2F-1 group; 2, Lv-shRNA-NC group; 3, PBS group.
E2F-1 mRNA and protein expression was suppressed in MGC-803 tumor
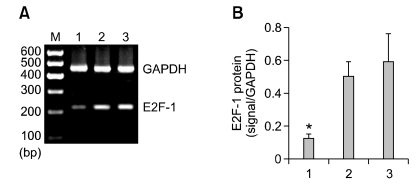
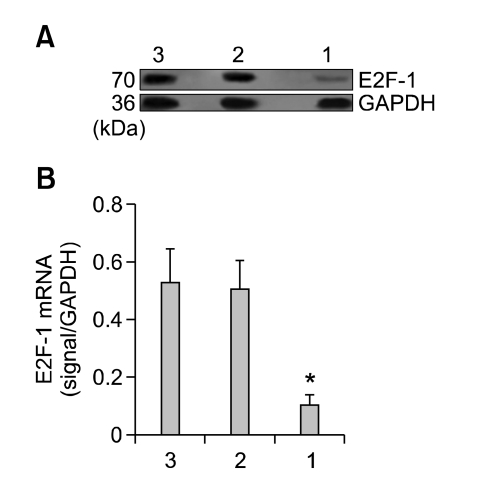
The MGC-803 tumor that was injected with Lv-shRNA-E2F-1 had marked inhibition of E2F-1 mRNA and protein expression. Densitometric analysis showed that E2F-1 mRNA and protein in the Lv-shRNA-E2F-1 group were about 10- and 6-fold lower than those of the two control groups respectively (P < 0.05), whereas no difference was found between the Lv-shRNA-NC and PBS groups (P > 0.05) (Figures 3 and 4).
Figure 3.
Inhibition of E2F-1 mRNA in Lv-shRNA-E2F-1 group. (A) Semi-quantitative RT-PCR analysis of E2F-1 and GAPDH in the MGC-803 tumor tissue from three groups respectively. Lanes: 1, Lv-shRNA-E2F-1 group; 2, Lv-shRNA-NC group; 3, PBS group; M, 600 bp marker. (B) The expression of E2F-1 mRNA were measured at three groups, normalized to GAPDH and presented as means ± SEM (n = 6 animals for each condition). *P < 0.05 compared with Lv-shRNA-NC and PBS group, using ANOVA and Student-Newman-Keuls analyses.
Figure 4.
The expression of E2F-1 protein is suppressed in Lv-shRNA-E2F-1 group. (A) Western blot analysis of E2F-1 and GAPDH in the MGC-803 tumor tissue from three groups respectively. Lanes: 1, Lv-shRNA-E2F-1 group; 2, Lv-shRNA-NC group; 3, PBS group. GAPDH: internal control protein. (B) The expression of E2F-1 protein were measured at three groups, normalized to GAPDH and presented as means ± SEM (n = 6 animals for each condition). *P < 0.05 compared with Lv-shRNA-NC and PBS group, using ANOVA and Student-Newman-Keuls analyses.
E2F-1 shRNA induces in situ MGC-803 tumor cell apoptosis
We evaluated the effect of E2F-1 shRNA on MGC-803 cell apoptosis in vivo. As shown in Figure 5, the percentage of apoptotic tumor cells in the Lv-shRNA-E2F-1 group was 18.7 ± 3.6%, which was more than 6.5 ± 0.7% in the Lv-shRNA-NC group and 5.8 ± 0.3% in the PBS group as shown by the terminal deoxynucleotidyl transferase-mediated dUTP-biotin nick end labeling (TUNEL) method (P < 0.05).
Figure 5.
Tumor cells apoptosis was assessed by TUNEL method. The apoptotic MGC-803 tumor cells in Lv-shRNA-E2F-1 group were more than the Lv-shRNA-NC group and PBS group (original manification × 400).
E2F-1 shRNA increases expression of PTEN, activates caspase-3 and caspase-9, and decreases NF-κB expression
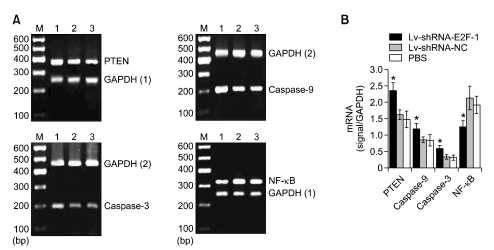
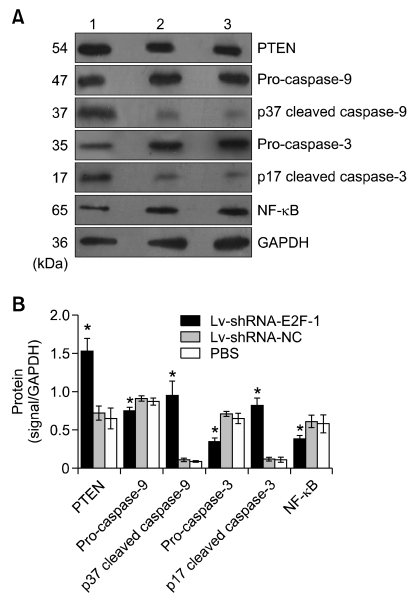
To investigate the mechanisms of E2F-1 shRNA induction of MGC-803 tumor cell apoptosis, we observed the expression of some apoptosis-associated genes by semi-quantitative RT-PCR and western blotting, such as PTEN, caspase-3, caspase-9 and NF-κB. As shown in Figure 6, densitometry showed that PTEN, caspase-3 and caspase-9 mRNA expression in the Lv-shRNA-E2F-1 group was higher while NF-κB was lower than that of the Lv-shRNA-NC and PBS groups (P < 0.05), and no difference was found between Lv-shRNA-NC and PBS groups (P > 0.05). As shown in Figure 7, E2F-1 shRNA induced cleavage of pro-caspase-3 (35 kDa) and pro-caspase-9 (47 kDa) into other multiple, cleaved, maturation products (data not shown), but only the 17-kDa form of cleaved caspase-3 and 37-kDa form of cleaved caspase-9 were observered in MGC-803 tumor tissue. Densitometry showed that PTEN, p17 cleaved caspase-3 and p37 cleaved caspase-9 protein expression in the Lv-shRNA-E2F-1 group was higher while NF-κB, pro-caspase-3 and pro-caspase-9 expression was lower than that in the Lv-shRNA-NC and PBS groups (P < 0.05), and no difference was found between the Lv-shRNA-NC and PBS groups (P > 0.05).
Figure 6.
E2F-1 shRNA induces PTEN, caspase-3 and caspase-9 mRNA expression upregulation and downregulation of NF-κB. (A) Semi-quantitative RT-PCR analysis of PTEN, caspase-3, caspase-9, NF-κB and GAPDH in the MGC-803 tumor tissue from three groups respectively. Lanes: 1, Lv-shRNA-E2F-1 group; 2, Lv-shRNA-NC group; 3, PBS group; M, 600 bp marker. (B) PTEN, caspase-3, caspase-9 and NF-κB mRNA levels were measured at three groups, normalized to those of GAPDH and presented as means ± SEM (n = 6 animals for each condition). *P < 0.05 compared with Lv-shRNA-NC and PBS group, using ANOVA and Student-Newman-Keuls analyses.
Figure 7.
E2F-1 downregulation significantly increases PTEN, p17 cleaved caspase-3 and p37 cleaved caspase-9 protein concentrations while pro-caspase-3, pro-caspase-9 and NF-κB are decreased in MGC-803 tumor. (A) Western blot analysis of PTEN, pro-caspase-3, p17 cleaved caspase-3, pro-caspase-9, p37 cleaved caspase-9, NF-κB and GAPDH in the MGC-803 tumor tissue from three groups respectively. Lanes: 1, Lv-shRNA-E2F-1 group; 2, Lv-shRNA-NC group; 3, PBS group; GAPDH: internal control protein. (B) PTEN, pro-caspase-3, p17 cleaved caspase-3, pro-caspase-9, p37 cleaved caspase-9 and NF-κB protein levels were measured at three groups, normalized to those of GAPDH and presented as means ± SEM (n = 6 animals for each condition). *P < 0.05 compared with Lv-shRNA-NC and PBS group, using ANOVA and Student-Newman-Keuls analyses.
Discussion
Gene alteration is known to be a key factor for a cancer cell to regulate its biological behavior. As one of the most important transcription factors regulated by the cycline-Cdk-Rb pathway during the cell cycle, E2F-1 is a well-characterized member of the E2F gene family. It promotes the cell cycle by regulating critical regulator genes involved in DNA replication and G1/S transition (van den Heuvel and Dyson, 2008). Rabbani and colleagues (Rabbani et al., 1999) have suggested that E2F-1 loses its transformation ability when it is mutated. Thus, an imbalance at any point in the complex gene network causing E2F-1 alteration can affect growth of cells.
Initially, E2F-1 was suggested to behave as an oncogene because E2F-1 promotes cellular proliferation by stimulating expression of a number of genes that promote G1 to the S phase transition (Johnson et al., 1993). According to Olson and colleagues (Olson et al., 2007), transgenic overexpression of E2F-1 in the mouse brain induces a bimodal pattern of tumor growth that resembles human disease. E2F-1 overexpression also has a growth-promoting effect in epithelial ovarian cancer cells and is thought to be a useful prognostic indicator (Suh et al., 2008). Therefore, E2F-1 has oncogenic properties in vitro and in vivo. Interestingly, E2F-1 can eliminate latent neoplastic cells through apoptosis in vitro (Li et al., 2009), and downregulation of E2F-1 transduction significantly inhibits the growth of prostate cancer cell lines and leiomyosarcoma (Nguyen et al., 2005; Vorburger et al., 2005), and it is linked to low proliferation and longer survival of different types of carcinoma cells in vivo and in vitro (Evangelou et al., 2008; Brown et al., 2010). These studies have suggested that E2F-1 is a tumor suppressor. It seems that E2F-1 acts as either an oncogene or a tumor suppressor depending on the tumor type and predominant signal (La Thangue, 2003; Bell and Ryan, 2004).
In the present study, we observed a strong antitumor effect of E2F-1 shRNA on MGC-803 cells in vivo. Tumor growth was suppressed and tumor apoptosis was increased in nude mice when E2F-1 mRNA and protein were silenced by E2F-1 shRNA. This agreed with our previous in vitro research (Xie et al., 2009b). Therefore, RNAi-directed targeting of E2F-1 can be used as a potent and specific therapeutic tool for the treatment of gastric cancer.
However, our previous study also has showed that E2F-1 overexpression inhibites growth of human gastric cancer cells in vitro (Xiao et al., 2007; Xie et al., 2009a), although the mechanisms are not clear. In the present study, E2F-1 shRNA increased PTEN, caspase-3 and caspase-9 expression while NF-κB expression was decreased. PTEN protein product is a lipid phosphatase that antagonizes phosphoinositide 3-kinase (PI3K) function and consequently inhibites downstream signaling transduction through Akt (Chappell et al., 2011). Caspase-9, a member of the protease family, is intimately associated with initiation of apoptosis, and is thought to be activated while Akt is inhibited (Shultz et al., 2010). Activated caspase-9 can cleave caspase-3 in vitro, leading eventually to apoptosis at last (Yamakawa et al., 2008). In addition to upregulation of pro-apoptotic factors, inhibition of Akt can also suppress the transcription of anti-apoptotic genes through inactivation of the transcription factor NF-κB, which also eventually induced apoptosis (Ozes et al., 1999). Thus, our results indicate that blocking E2F-1 expression probably upregulates PTEN expression directly or indirectly, activates caspase-3 and caspase-9, decreases NF-κB expression via PI3K/PTEN/Akt signaling pathway, and inhibits the growth of MGC-803 cells in vivo. Further studies are needed to establish our explanation.
E2F-1 plays a critical role in gastric cancer cell proliferation, invasion, and apoptosis. Downregulation of E2F-1 using RNAi successfully reduces gastric cancer MGC-803 cell progression in vivo and in vitro. In conclusion, this study lays the foundation for treatment of gastric cancer through manipulation of E2F-1 expression.
Methods
Cell culture
The human gastric carcinoma cell line MGC-803 and human kidney 293T cells were supplied by Cell Bank of Shanghai Institute of Cell Biology, Chinese Academy of Sciences. Cells were cultured in Dulbecco's Modified Eagle's Medium (DMEM) (Invitrogen, Gaithersburg, MD). All media were supplemented with 10% FBS, penicillin (100 U/ml), and streptomycin (100 µg/ml). The cells were cultured in an incubator at 5% CO2 and 37℃, with medium changes every 3 days.
Antibodies
Antibodies specific for E2F-1, PTEN, pro-caspase-3, cleaved caspase-3, pro-caspase-9, cleaved caspase-9, NF-κB and GAPDH were from Cell Signaling Technology (Beverly, MA). Secondary antibody was obtained from Santa Cruz Biotechnology (Santa Cruz, CA).
Construction of E2F-1 shRNA lentiviral vector
Inverted and self-complementary hairpin DNA oligos targeting E2F-1 mRNA were obtained from Genchem Biotechnology Company (Shanghai, China). The sequences were 5'-CCGGCACTGACTCTGCCACCATAGTTTCAAGAGAACTATGGTGGCAGAGTCAGTGTTTTTG-3' and 5'-AATTCAAAAACACTGACTCTGCCACCATAGTTCTCTTGAAACTATGGTGGCAGAGTCAGTG-3', including human E2F-1 shRNA pair sequences (italic), 9-nt loop sequences (underlined), a U6 terminator, and two cohesive ends (AgeI/EcoRI) for ligation into pGCSIL-GFP vector. The shRNA targeting site of the transcripted product was nt 124-1437 of E2F-1 mRNA (GeneBank No. NM-005225). The negative control sequences which have been used in a number of studies (Zielske et al., 2005; Pullmann et al., 2005) were 5'-CCGGTTCTCCGAACGTGTCACGTTTCAAGAGAACGTGACACGTTCGGAGAATTTTTG-3' and 5'-AATTCAAAAATTCTCCGAACGTGTCACGTTCTCTTGAAACGTGACACGTTCGGAGAA-3', including negative control scrambled shRNA pair sequences (italic), 9-nt loop sequences (underlined), a U6 terminator, two cohesive ends (AgeI/EcoRI) for ligation into pGCSIL-GFP vector, and they had no significant homology to any human gene sequences.
pGCSIL-GFP vector (U6 promoter, polylinker: ACCGGT CCGCAGGTATGCACGCGTGAATTC, lower case: linker sequences) was digested by AgeI and EcoRI and purified by Qiagen (Shanghai, China) quick gel extraction kit. The pairs of complementary hairpin DNA oligos which were mentioned above were synthesized, annealed, and ligated into linearized pGCSIL-GFP vector. The ligated DNA solution was transformed into E. coli DH5α, and incubated on a Luria Bertani (LB) plate (LB solid medium containing 50 ng/l ampicillin and 2% agarose gel) at 37℃ for 16 h. Positive clones were identified by DNA sequence analysis (Majorbio Biotech Co., Ltd., Shanghai, China) and resulting plasmid was named as pGCSIL-GFP-shRNA-E2F-1 and pGCSIL-GFP-shRNA-NC.
Generation and titer of E2F-1 shRNA lentivirus
Lentiviruses were generated in 293T cells by co-transfection of pGCSIL-GFP-shRNA-E2F-1 or pGCSIL-GFP-shRNA-NC, with pHelper1.0 and pHelper2.0 plasmids. These plasmids were amplified in E. coli DH5α, extracted with a plasmid purification kit (Qiagen) according to manufacturer's instructions, and transfected into 70% confluent 293T cells using Lipofectamine 2000 (Invitrogen). Then lentiviral particles were harvested from the media 48 h after transfection, and purified with ultracentrifugation. The lentivirus carried GFP, therefore, viral titer was determined by the method of end point dilution through counting the numbers of infected green cells at ×100 magnification under fluorescence microscope (Olympus, Tokyo, Japan) 96 h after infection to 293T cells. Titer in IU/ml = (the numbers of green fluorescent cells) × (dilution factor)/(volume of virus solution).
Tumor implantation
Male BALB/c nude mice aged 5 weeks were obtained from Guangxi Animal Center (Nanning, China). All animals were kept under specific pathogen-free conditions. All animal studies were performed in accordance with the guidelines of the Institutional Animal Care and Use Committee of Guangxi Medical University. MGC-803 cells were used for tumor implantation. Approximately 2 × 10⁶ MGC-803 cells were harvested, resuspended in 100 µl PBS, implanted subcutaneously into the flanks of the BALB/c nude mice, and resulting tumor was named as MGC-803 tumor.
Treatment of MGC-803 tumor in nude mice
After 7 days, when the MGC-803 tumor measured 3-5 mm in diameter, these nude mice were randomly divided into the following three groups (6 mice/per group): LV-shRNA-E2F-1, LV-shRNA-NC and PBS. The animals were administered an intratumoral injection of LV-shRNA-E2F-1 or LV-shRNA-NC at a titer of 107 TU in 100 µl PBS, and injection of an equal volume of PBS was used as a blank control. After the first injection, the animals were administered a similar injection every 2 days. The tumors were monitored every day and measured every 2 days with a caliper, and the diameters were recorded. The tumor volume (TV) was calculated by the formula: TV =W2 × L/2, where L is the length and W is the width of the tumor. The relative tumor volume (RTV) was calculated by the formula: RTV = Vt/V0 (V0 is the TV on the day when the chemicals were given and Vt is the TV of subsequent measurement). The animals were sacrificed at 12 days after tumor injection and the tumors were analyzed.
Semi-quantitative RT-PCR
After mice were killed, total RNAs were extracted from MGC-803 tumor tissue using TRIzol Reagent (Invitrogen). Neo gene segments were amplified and verified by semi-quantitative RT-PCR. cDNAs were reverse-transcribed from 2 µg total RNA. Supplemental Data Table S1 shows the E2F-1 PCR primer sequences used in this study. The PCR products were checked by agarose gel electrophoresis, and the abundance of each mRNA was detected and normalized to that of GAPDH mRNA.
Western blot analysis
Equal amounts of protein from MGC-803 tumor tissue homogenates were prepared in a buffer containing 100 mM NaCl, 10 mM Tris-HCl (pH 7.6), 1 mM EDTA (pH 8.0), 1 µg/ml aprotinin, 100 µg/ml PMSF, and 1% (v/v) NP40. After protein quantitation using the Lowry protein assay, equal amounts of proteins were separated by SDS-PAGE and blotted onto nitrocellulose membranes by the semi-dry blotting method using a three buffer system. The membrane was blocked with 5% BSA in PBST (PBS, pH 7.5, containing 0.1% Tween-20) and incubated with a 1:500 dilution of primary antibody (anti-E2F-1) overnight at 4℃. The membrane was then washed with PBST and incubated with E2F-1 peroxidase-conjugated secondary antibody (1:1000) for 1 h. Specific antibody binding was detected using a chemiluminescence detection system (Pierce, Rockford, IL), according to the manufacturer's recommendations. Western blot film was scanned, and the net intensities of the bands were quantified using Image-QuanT software (Molecular Dynamics, Sunnyvale, CA). After development, the membrane was stripped and reprobed with antibody against GAPDH (1:1000) to confirm equal sample loading.
Analyses of in situ MGC-803 tumor apoptosis by TUNEL assay
To quantify the relative numbers of MGC-803 tumor cells with DNA fragmentation, a TUNEL assay was performed for all groups, using ApopTag (S7100; Chemicon International, Billerica, MA) according to the manufacturer's protocol. Apoptosis was evaluated by counting the positive cells (brown-stained cells) as well as the total number of cells in 10 arbitrarily selected fields at × 400 magnification under optical microscope (Olympus) in a double-blinded manner. The apoptotic index (per × 400 microscopic fields) was calculated as number of apoptotic cells × 100/total number of cells. Brown-stained nuclei immediately at the edge of a tissue section were excluded from cell counts to minimize false positives.
Analyses of PTEN, caspase-3, caspase-9 and NF-κB expression
Total RNAs and equal amounts of protein were extracted from MGC-803 tumor tissue. Semi-quantitative RT-PCR and western blot analysis were carried out as described previously. PCR primers of PTEN, caspase-3, caspase-9 and NF-κB used in this study were in Supplemental Data Table S1.
Statistical analysis
Data are expressed as mean ± standard error of the mean (SEM) analyzed by SPSS version 13.0 (SPSS Inc., Chicago, IL) and Origin version 7.5 software programs (OriginLab, Northampton, MA). One-way analysis of variance (ANOVA) was used to measure statistical significance among different groups, followed by Student-Newman-Keuls analyses. Data were considered significant at P < 0.05.
Supplemental data
Supplemental data include a table and can be found with this article online at http://e-emm.or.kr/article/article_files/SP-43-11-05.pdf.
Acknowledgements
This work was supported by grants from the Natural Science Foundation of China (No. 30860273), Natural Science Foundation of Guangxi (No. 10124001A-22) and the Key Health Science Foundation of Guangxi (No. Key 200844), China.
Abbreviations
- PTEN
phosphatase and tensin homolog
- RNAi
RNA interference
Supplementary Material
Supplemental Data
References
- 1.Alla V, Engelmann D, Niemetz A, Pahnke J, Schmidt A, Kunz M, Emmrich S, Steder M, Koczan D, Pützer BM. E2F1 in melanoma progression and metastasis. J Natl Cancer Inst. 2010;102:127–133. doi: 10.1093/jnci/djp458. [DOI] [PubMed] [Google Scholar]
- 2.Amiri M. Stomach cancer mortality in the future: where are we going? Int J Prev Med. 2011;2:101–102. [PMC free article] [PubMed] [Google Scholar] [Retracted]
- 3.Bell LA, Ryan KM. Life and death decisions by E2F-1. Cell Death Differ. 2004;11:137–142. doi: 10.1038/sj.cdd.4401324. [DOI] [PubMed] [Google Scholar]
- 4.Brown KC, Witte TR, Hardman WE, Luo H, Chen YC, Carpenter AB, Lau JK, Dasgupta P. Capsaicin displays anti-proliferative activity against human small cell lung cancer in cell culture and nude mice models via the E2F pathway. PLoS One. 2010;5:e10243. doi: 10.1371/journal.pone.0010243. [DOI] [PMC free article] [PubMed] [Google Scholar]
- 5.Chappell WH, Steelman LS, Long JM, Kempf RC, Abrams SL, Franklin RA, Bäsecke J, Stivala F, Donia M, Fagone P, Malaponte G, Mazzarino MC, Nicoletti F, Libra M, Maksimovic-Ivanic D, Mijatovic S, Montalto G, Cervello M, Laidler P, Milella M, Tafuri A, Bonati A, Evangelisti C, Cocco L, Martelli AM, McCubrey JA. Ras/Raf/MEK/ERK and PI3K/PTEN/Akt/mTOR inhibitors: rationale and importance to inhibiting these pathways in human health. Oncotarget. 2011;2:135–164. doi: 10.18632/oncotarget.240. [DOI] [PMC free article] [PubMed] [Google Scholar]
- 6.Cunningham D, Jost LM, Purkalne G, Oliveira J. ESMO minimum clinical recommendations for diagnosis, treatment and follow-up of gastric cancer. Ann Oncol. 2005;16(Suppl 1):i22–i23. doi: 10.1093/annonc/mdi812. [DOI] [PubMed] [Google Scholar]
- 7.Evangelou K, Kotsinas A, Mariolis-Sapsakos T, Giannopoulos A, Tsantoulis PK. E2F-1 overexpression correlates with decreased proliferation and better prognosis in adenocarcinomas of Barrett oesophagus. J Clin Pathol. 2008;61:601–605. doi: 10.1136/jcp.2007.050963. [DOI] [PubMed] [Google Scholar]
- 8.Gropp M, Reubinoff BE. Lentiviral-RNA-interference system mediating homogenous and monitored level of gene silencing in human embryonic stem cells. Cloning Stem Cells. 2007;9:339–345. doi: 10.1089/clo.2006.0077. [DOI] [PubMed] [Google Scholar]
- 9.Huang CL, Liu D, Nakano J, Yokomise H, Ueno M, Kadota K, Wada H. E2F1 overexpression correlates with thymidylate synthase and survivin gene expressions and tumor proliferation in non small-cell lung cancer. Clin Cancer Res. 2007;13:6938–6946. doi: 10.1158/1078-0432.CCR-07-1539. [DOI] [PubMed] [Google Scholar]
- 10.Johnson DG. The paradox of E2F1: oncogene and tumor suppressor gene. Mol Carcinog. 2000;27:151–157. doi: 10.1002/(sici)1098-2744(200003)27:3<151::aid-mc1>3.0.co;2-c. [DOI] [PubMed] [Google Scholar]
- 11.Johnson DG, Schwarz JK, Cress WD, Nevins JR. Expression of transcription factor E2F1 induces quiescent cells to enter S phase. Nature. 1993;365:349–352. doi: 10.1038/365349a0. [DOI] [PubMed] [Google Scholar]
- 12.La Thangue NB. The yin and yang of E2F-1: balancing life and death. Nat Cell Biol. 2003;5:587–589. doi: 10.1038/ncb0703-587. [DOI] [PubMed] [Google Scholar]
- 13.Lazzerini Denchi E, Helin K. E2F1 is crucial for E2F-dependent apoptosis. EMBO Rep. 2005;6:661–668. doi: 10.1038/sj.embor.7400452. [DOI] [PMC free article] [PubMed] [Google Scholar]
- 14.Li WJ, Gu YY, Zhang HJ, Zhou J, Jia HT. Induction of p14ARF by E2F1 contributes to 8-chloro-adenosine-induced apoptosis in human lung cancer H1299 cells. Chemotherapy. 2009;55:335–343. doi: 10.1159/000230697. [DOI] [PubMed] [Google Scholar]
- 15.Liontos M, Niforou K, Velimezi G, Vougas K, Evangelou K, Apostolopoulou K, Vrtel R, Damalas A, Kontovazenitis P, Kotsinas A, Zoumpourlis V, Tsangaris GT, Kittas C, Ginsberg D, Halazonetis TD, Bartek J, Gorgoulis VG. Modulation of the E2F1-driven cancer cell fate by the DNA damage response machinery and potential novel E2F1 targets in osteosarcomas. Am J Pathol. 2009;175:376–391. doi: 10.2353/ajpath.2009.081160. [DOI] [PMC free article] [PubMed] [Google Scholar]
- 16.Molina-Privado I, Rodríguez-Martínez M, Rebollo P, Martín-Pérez D, Artiga MJ, Menárguez J, Flemington EK, Piris MA, Campanero MR. E2F1 expression is deregulated and plays an oncogenic role in sporadic Burkitt's lymphoma. Cancer Res. 2009;69:4052–4058. doi: 10.1158/0008-5472.CAN-08-4617. [DOI] [PMC free article] [PubMed] [Google Scholar]
- 17.Nguyen KH, Hachem P, Khor LY, Salem N, Hunt KK, Calkins PR, Pollack A. Adenoviral-E2F-1 radiosensitizes p53wild-type and p53 null human prostate cancer cells. Int J Radiat Oncol Biol Phys. 2005;63:238–246. doi: 10.1016/j.ijrobp.2005.04.033. [DOI] [PMC free article] [PubMed] [Google Scholar]
- 18.Olson MV, Johnson DG, Jiang H, Xu J, Alonso MM, Aldape KD, Fuller GN, Bekele BN, Yung WK, Gomez-Manzano C, Fueyo J. Transgenic E2F1 expression in the mouse brain induces a human-like bimodal pattern of tumors. Cancer Res. 2007;67:4005–4009. doi: 10.1158/0008-5472.CAN-06-2973. [DOI] [PubMed] [Google Scholar]
- 19.Ozes ON, Mayo LD, Gustin JA, Pfeffer SR, Pfeffer LM, Donner DB. NF-kappaB activation by tumour necrosis factor requires the Akt serine-threonine kinase. Nature. 1999;401:82–85. doi: 10.1038/43466. [DOI] [PubMed] [Google Scholar]
- 20.Parkin DM, Bray F, Ferlay J, Pisani P. Global cancer statistics, 2002. CA Cancer J Clin. 2005;55:74–108. doi: 10.3322/canjclin.55.2.74. [DOI] [PubMed] [Google Scholar]
- 21.Pfeifer A, Eigenbrod S, Al-Khadra S, Hofmann A, Mitteregger G, Moser M, Bertsch U, Kretzschmar H. Lentivector-mediated RNAi efficiently suppresses prion protein and prolongs survival of scrapie-infected mice. J Clin Invest. 2006;116:3204–3210. doi: 10.1172/JCI29236. [DOI] [PMC free article] [PubMed] [Google Scholar]
- 22.Polager S, Ginsberg D. E2F-at the crossroads of life and death. Trends Cell Biol. 2008;18:528–535. doi: 10.1016/j.tcb.2008.08.003. [DOI] [PubMed] [Google Scholar]
- 23.Pullmann R, Jr, Juhaszova M, López de Silanes I, Kawai T, Mazan-Mamczarz K, Halushka MK, Gorospe M. Enhanced proliferation of cultured human vascular smooth muscle cells linked to increased function of RNA-binding protein HuR. J Biol Chem. 2005;280:22819–22826. doi: 10.1074/jbc.M501106200. [DOI] [PMC free article] [PubMed] [Google Scholar]
- 24.Rabbani F, Richon VM, Orlow I, Lu ML, Drobnjak M, Dudas M, Charytonowicz E, Dalbagni G, Cordon-Cardo C. Prognostic significance of transcription factor E2F-1 in bladder cancer: genotypic and phenotypic characterization. J Natl Cancer Inst. 1999;91:874–881. doi: 10.1093/jnci/91.10.874. [DOI] [PubMed] [Google Scholar]
- 25.Shi Y, Yang S, Troup S, Lu X, Callaghan S, Park DS, Xing Y, Yang X. Resveratrol induces apoptosis in breast cancer cells by E2F1-mediated up-regulation of ASPP1. Oncol Rep. 2011;25:1713–1719. doi: 10.3892/or.2011.1248. [DOI] [PubMed] [Google Scholar]
- 26.Shultz JC, Goehe RW, Wijesinghe DS, Murudkar C, Hawkins AJ, Shay JW, Minna JD, Chalfant CE. Alternative splicing of caspase 9 is modulated by the phosphoinositide 3-kinase/Akt pathway via phosphorylation of SRp30a. Cancer Res. 2010;70:9185–9196. doi: 10.1158/0008-5472.CAN-10-1545. [DOI] [PMC free article] [PubMed] [Google Scholar]
- 27.Sowers R, Toguchida J, Qin J, Meyers PA, Healey JH, Huvos A, Banerjee D, Bertino JR, Gorlick R. mRNA expression levels of E2F transcription factors correlate with dihydrofolate reductase, reduced folate carrier, and thymidylate synthase mRNA expression in osteosarcoma. Mol Cancer Ther. 2003;2:535–541. [PubMed] [Google Scholar]
- 28.Suh DS, Yoon MS, Choi KU, Kim JY. Significance of E2F-1 overexpression in epithelial ovarian cancer. Int J Gynecol Cancer. 2008;18:492–498. doi: 10.1111/j.1525-1438.2007.01044.x. [DOI] [PubMed] [Google Scholar]
- 29.van den Heuvel S, Dyson NJ. Conserved functions of the pRB and E2F families. Nat Rev Mol Cell Biol. 2008;9:713–724. doi: 10.1038/nrm2469. [DOI] [PubMed] [Google Scholar]
- 30.Vorburger SA, Hetrakul N, Xia W, Wilson-Heiner M, Mirza N, Pollock RE, Feig B, Swisher SG, Hunt KK. Gene therapy with E2F-1 up-regulates the protein kinase PKR and inhibits growth of leiomyosarcoma in vivo. Mol Cancer Ther. 2005;4:1710–1716. doi: 10.1158/1535-7163.MCT-05-0036. [DOI] [PubMed] [Google Scholar]
- 31.Xiao Q, Li L, Xie Y, Tan N, Wang C, Xu J, Xia K, Gardner K, Li QQ. Transcription factor E2F-1 is upregulated in human gastric cancer tissues and its overexpression suppresses gastric tumor cell proliferation. Cell Oncol. 2007;29:335–349. doi: 10.1155/2007/147615. [DOI] [PMC free article] [PubMed] [Google Scholar]
- 32.Xie Y, Wang C, Li L, Ma Y, Yin Y, Xiao Q. Overexpression of E2F-1 inhibits progression of gastric cancer in vitro. Cell Biol Int. 2009a;33:640–649. doi: 10.1016/j.cellbi.2009.02.015. [DOI] [PubMed] [Google Scholar]
- 33.Xie Y, Yin Y, Li L, Ma Y, Xiao Q. Short interfering RNA directed against the E2F-1 gene suppressing gastric cancer progression in vitro. Oncol Rep. 2009b;21:1345–1353. doi: 10.3892/or_00000360. [DOI] [PubMed] [Google Scholar]
- 34.Yamakawa N, Takahashi A, Mori E, Imai Y, Furusawa Y, Ohnishi K, Kirita T, Ohnishi T. High LET radiation enhances apoptosis in mutated p53 cancer cells through Caspase-9 activation. Cancer Sci. 2008;99:1455–1460. doi: 10.1111/j.1349-7006.2008.00818.x. [DOI] [PMC free article] [PubMed] [Google Scholar]
- 35.Zielske SP, Stevenson M. Importin 7 may be dispensable for human immunodeficiency virus type 1 and simian immunodeficiency virus infection of primary macrophages. J Virol. 2005;79:11541–11546. doi: 10.1128/JVI.79.17.11541-11546.2005. [DOI] [PMC free article] [PubMed] [Google Scholar]
Associated Data
This section collects any data citations, data availability statements, or supplementary materials included in this article.
Supplementary Materials
Supplemental Data


