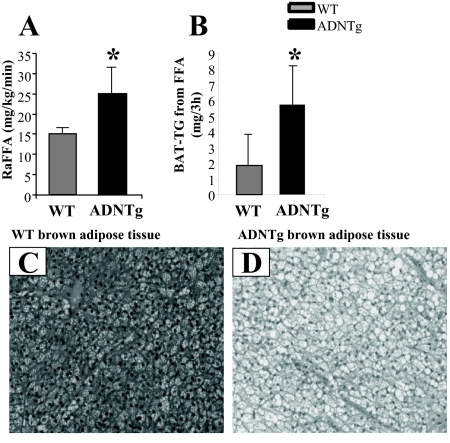
Fig. 5.
Plasma FFA appearance rate, BAT-TG synthesis, and morphologic assessment of BAT. Plasma FFA turnover was measured in five WT and five ADNTg 16-h fasted animals (A) and the quantity of BAT-TG synthesized (B) during the 3-h isotope infusion assessed by GC/MS. Representative sections are shown for WT (C) and ADNTg (D) BAT. For BAT histology in 6-h fasted animals, sections were stained with hematoxylin and eosin and imaged at a ×20 magnification. *, P < 0.05.

