

Abstract
The dose to critical structures plays a very important role in treatment plan evaluation and forms a major challenging parameter in radiotherapy treatment planning. In this study, a simple index, Plan Normal tissue complication Index (PNI) has been proposed for treatment plan evaluation based on the dose to surrounding critical structures. To demonstrate the proposed index, four different critical treatment sites that include the prostate, upper abdominal cancer, lung, and head and neck were selected for this study. A software progam (PNIcalc) has been developed to compute the PNI from the exported dose-volume histogram data and from the tissue tolerance data published by Emami et al. and Kehwar et al. The software also shows the parameters that exceed the threshold limits of dose-volume parameters presented in the QUANTEC recommendations (2010). In all the studied cases, PNI gave an overall picture of the dose received by the critical structures and also indicate the fractional volume exceeding the tolerance limit. The proposed index, PNI gives a quick comparison and selection of treatment plans that result in reduced dose to the critical structures. It can be used as an additional tool for routine treatment plan evaluation in external beam radiotherapy.
Keywords: Critical structures, plan evaluation, radiation oncology, treatment planning system, tolerance dose
Introduction
The main aim of radiotherapy is to maximize the tumor control probability with less complication to the surrounding critical structures. A treatment plan is generated based on this simple rule and several methods of treatment delivery techniques, including 3D conformal radiotherapy, intensity modulated radiation therapy (IMRT), stereotactic radiosurgery/radiotherapy, image-guided radiotherapy, brachytherapy are currently available in radiotherapy. Each of the above techniques has its own advantages and disadvantages in achieving the goal. In fractionated radiotherapy, the biological factors that affect response of normal and tumor tissues are repair, repopulation, reoxygenation, redistribution,[1] and radiosensitivity (5R's of radiobiology). In reality, it is difficult to quantify the individual effect these factors have on normal tissues and tumor tissues for a routine clinical case. Based on previous clinical experience, the radiation oncologists prescribe the dose to the tumor after critical evaluation of the dose to critical structures. In external beam radiotherapy, dose-volume histograms (DVH) play a key role in selecting the optimal plan for treatment delivery and it is presented in the form of cumulative DVH[2–4] and differential DVH. Indices such as conformality index (CI) and dose homogeneity index have been proposed to assess the target coverage and dose uniformity inside the target volume. In addition to these, slice-based plan evaluation methods were also proposed for treatment plan evaluation.[5,6] The dose to critical structures plays a key role in treatment plan evaluation and presents a major challenging parameter in radiotherapy treatment planning. The dose to critical structure is analyzed based on the information available from the DVH. The concept of minimal (TD5/5) and maximal (TD50/5) tissue tolerance dose was introduced by Rubin and Casserett in 1972 and applied to whole or partial organ volume receiving daily fractionations of 1.8-2 Gy.[7] The tolerance dose TD5/5 represents the radiation dose that would result in 5% risk of severe complications within 5 years after irradiation and TD50/5 represents the dose that would result in 50% probability of developing severe complications within 5 years after irradiation. A landmark publication by Emami et al.[8] compiled the normal tissue tolerance doses for various critical structures in terms of TD5/5 and TD50/5 and it is widely used in radiotherapy treatment planning.[8] These normal tissue tolerance data are defined for uniformly irradiated 1/3, 2/3, and 3/3 partial volumes of the normal tissues and organs and are applicable for conventional fractionation schedules of 1.8-2 Gy per fraction, 5 fractions a week. The missing TD5/5 and TD50/5 values in the Emami et al.[8] publication were fitted by Kehwar using an empirical model.[9] Even though, many other researchers have also reported the tolerance doses for individual organs, but the data are scattered in the literature and the tolerance doses for same organ differ among different investigators. Recently, a new set of recommendations known as the Quantitative Analysis of Normal Tissue Effects in the Clinic (QUANTEC) has been published based on evidence-based guidelines.[10–12] The tolerance data published by Emami et al.[8] represents the DVH in the form of 1/3rd, 2/3rd, and 3/3 of a critical structure and it is much simpler to compare two plans. In this study, a simple index, PNI has been proposed for treatment plan evaluation, based on the doses to surrounding critical structures and on correlating these dose values with the tolerance dose compiled by Emami et al.[8,9] and Kehwar.
Materials and Methods
To demonstrate the proposed index, four different critical treatment sites that include prostate, upper abdominal cancer (UAC), lung, and head and neck were selected for this study. All the patients were planned on Eclipse™ treatment planning system. In case of prostate, five different treatment plans: (1) three fields with open anterior and two lateral wedged fields (3F), (2) three fields with open anterior and two lateral wedged fields (3F-M) fitted with mulitleaf collimator (MLC), (3) four field box technique fitted with MLC (4F-M), (4) six fields fitted with MLC (6F-M), and (5) seven field intensity modulated radiotherapy technique (IMRT) were generated in the treatment planning system. For plan comparison, the dose prescription was kept as 74 Gy uniformly in all the treatment plans. The DVH for the bladder, rectum, right femur, and left femur were exported to a software (PNIcalc) developed in Visual Basic.net 2008 (Microsoft Corporation™) that computes PNI. Figure 1 shows the screen shot of PNIcalc comparing the DVH of two rival plans. The software has the provision for importing the DVH data from the treatment planning system and the user can select the critical structures to be included for PNI computation. In addition to this, the PNIcalc can also compute the ratio of near-maximum to near-minimum doses (D2/D98) to the target volume, volume of planning target volume (PTV) receiving greater than 107% (D > 107%) and less than 95% (D < 95%) of the prescribed dose.[13] The conformality index (CI) for the treatment plan in this study was computed from the ratio of the total volume enclosed by prescription dose to the volume within the target irradiated to at least the prescription dose.[14] The software also computes the CI defined by the Radiotherapy Oncology Group (RTOG).[15] The PNIcalc also compares the plan based on the recent QUANTEC recommendations and highlights the dose volume parameters that exceeds the limits presented in the QUANTEC guidelines for a given structure.[10]
Figure 1.
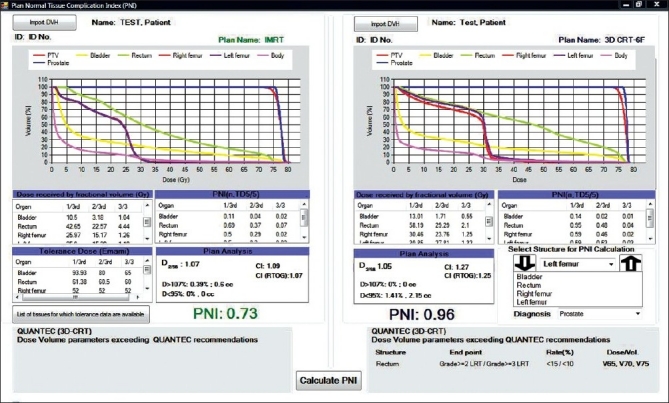
Software module for comparing two rival plans based on PNI
The plan normal tissue complication index is derived from the knowledge of the tolerance doses for different critical structures and the dose received by 1/3rd, 2/3rd, and 3/3 of the critical structure.
PNI = f (n, j/3, TD)
where
n = critical structures
j/3; where j = 1,2,3
TD = tolerance dose and it can be either TD5/5 or TD50/5.
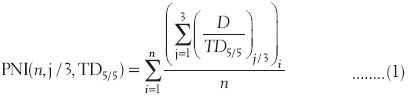
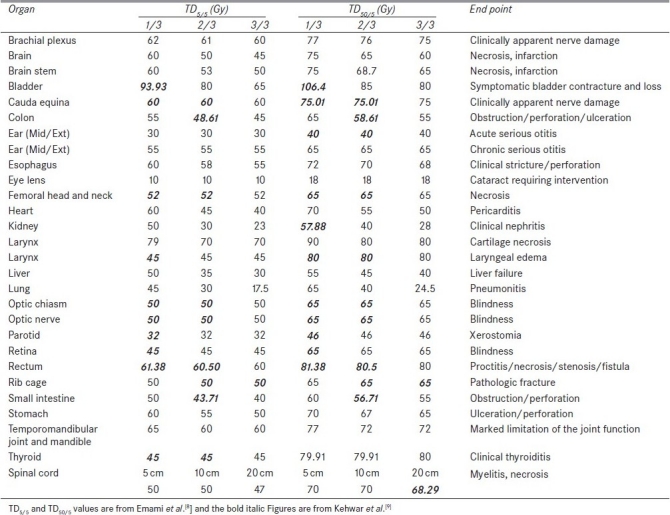
The PNIcalc computes the PNI for the plan based on the tolerance data given in Table 1 adopted from Emami et al. and Kehwar.[8,9]
Table 1.
Tolerance dose TD5/5 and TD50/5 for various critical structures
In case of upper abdominal cancer, two plans were generated (1) a simple three fields with anterior open and two lateral 45° wedged fields (3F-MLC) fitted with multileaf collimator (MLC) and (2) a seven-field IMRT plan with 6 MV beams. The prescription dose to the PTV was kept as 45 Gy in 25 fractions for comparing the 3F-MLC and IMRT plans. The DVH data of the right kidney, left kidney, liver, and spinal cord were exported to the PNIcalc program. The spinal cord is a serial structure and the concept of 1/3rd, 2/3rd, and 3/3 does not apply and moreover the DVH does not contain the information about the length of the spinal cord. Hence, for computing PNI, the tolerance dose TD5/5 was kept as 47 Gy uniformly for 1/3, 2/3, and 3/3 and the software reads the maximum dose received by spinal cord from the exported DVH data.
The third case was a lung cancer, planned for 3D conformal radiotherapy (3D-CRT) and IMRT. The 3D-CRT was planned by three fields that include an anterior open and two wedged lateral MLC fields. The IMRT planning was performed with five 6 MV fields. A dose of 60 Gy in 30 fractions was prescribed in both of the treatment plans. In this case, the right lung, left lung, liver, and spinal cord were the critical structures included for PNI computation.
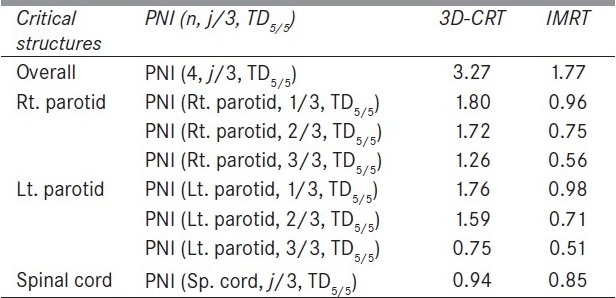
The head and neck was a case of cancer of vallecula (T3N0M0) for which a 3D-CRT and an IMRT plan was generated. The 3D-CRT plan included 50 Gy prophylactic planned by parallel opposed fields with spine sparing after 40 Gy and posterior bilateral neck on either side were boosted with 9 MeV electron fields to reduce the dose to the spinal cord. The lower neck was planned with 50 Gy anterior fields with mid-line shielding. The prophylactic irradiation was followed by a 20 Gy boost to the gross tumor volume. The IMRT plan includes a uniform seven fields planned with 6 MV beams. In this case, right and left parotid and spinal cord were the critical structures included for PNI calculation as both the right and left parotid were closer to the PTV.
Results
Figure 1 compares the DVH generated for the IMRT and six-field 3D-CRT prostate plans. It clearly illustrates the dose received by 1/3rd, 2/3rd, and 3/3 volume of bladder, rectum, right femur, and left femur and its corresponding computed PNI. It also shows the tolerance doses for the user selected critical structures and the PNI for the whole plan. In addition to PNI computation, it also shows a comparison of dosimetric parameters, such as D2/D98, D > 107%, D < 95%, and CI. The Figure also shows that the percentage of rectum volume receiving V65, V70, and V75 exceeds the threshold limit recommended by QUANTEC for six-field 3D-CRT plan. Table 2 shows the PNI computed for the prostate case. The PNI for 3F, 3F-M, 4F-M, 6F-M, and 7F-IMRT were 1.54, 1.30, 1.27, 0.96, and 0.73, respectively. Using Eq. (1), PNI can also be computed for individual structures as shown in Table 2 and these values illustrate the ratio of actual dose received by a partial/whole volume to the tolerance dose. These Figures indicate that IMRT considerably reduces the doses to the overall combined critical structures as compared to other techniques and 3F-O results in more doses to the critical structures. The rectal and femoral doses are significantly affected with the number and orientation of treatment fields. The CI for 3F-O, 3F-M, 4F-M, 6F and 7F-IMRT were 1.90, 1.29, 1.34, 1.27, and 1.09, respectively. Figure 2 shows the prescription isodose colorwash for the 3-F MLC plan and IMRT for UAC and Figure 3 compares the DVH of PTV, CTV, rt. kidney, lt. kidney, liver, and spinal cord for 3-F MLC and IMRT plans. The CI computed for the 3F-MLC and IMRT were 1.6 and 1.16, respectively. Table 3 compares the PNI for 3-F MLC plan and IMRT. The computed PNI for 3F-MLC and IMRT were 1.26 and 1.05 indicating that IMRT relatively reduces the overall dose to critical structures. Figure 4 shows the comparison of 3D-CRT and IMRT plan for lung cancer. Table 4 shows the comparison of PNI with 3D-CRT and IMRT for lung cancer. In this particular case, the PNI for 3D-CRT plan is almost equivalent to the IMRT plan. The decrease in the dose to right lung and liver with IMRT is offsetted by dose to the contralateral lung and spinal cord. But at the same time, the IMRT plan demonstrates a good CI (1.16) as compared to 1.45 for 3D-CRT. Table 5 shows the comparison of PNI with 3D-CRT and IMRT for head and neck cancer. The PNI for 3D-CRT and IMRT were 3.27 and 1.77, respectively. In the case of 3D-CRT, both the parotids have exceeded the tolerance doses due to the arrangement of parallel opposed fields to a dose of 50 Gy and hence the PNI for parotids are high as compared to IMRT plan.
Table 2.
Comparison of PNI with different treatment planning techniques for prostate cancer
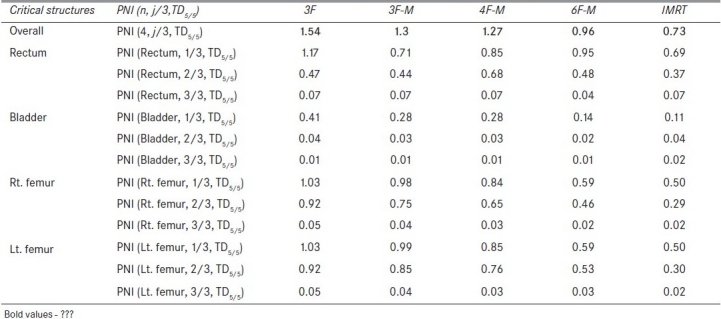
Figure 2.
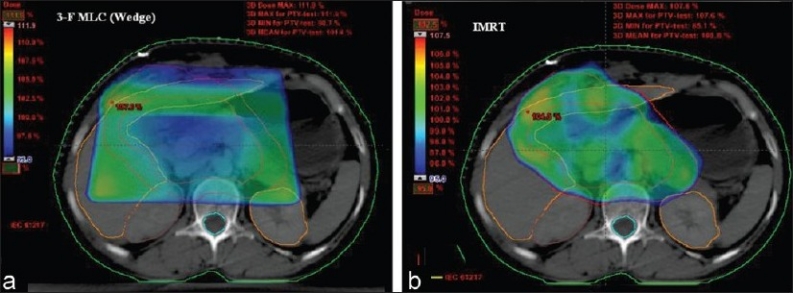
Comparison of prescription isodose color wash for 3-F MLC plan (3D-CRT) and IMRT for UAC
Figure 3.
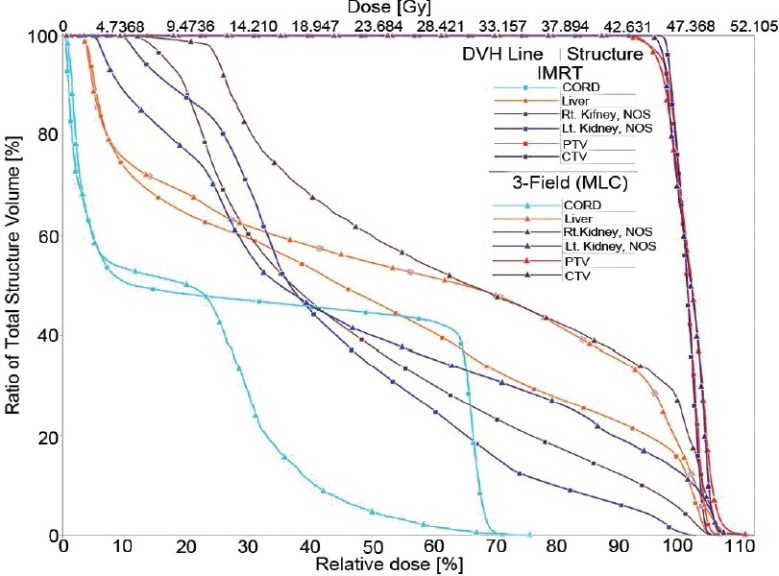
Comparison of dose-volume histograms for 3-F MLC and IMRT treatment plans
Table 3.
Comparison of PNI with 3D-CRT and IMRT for upper abdominal malignancy
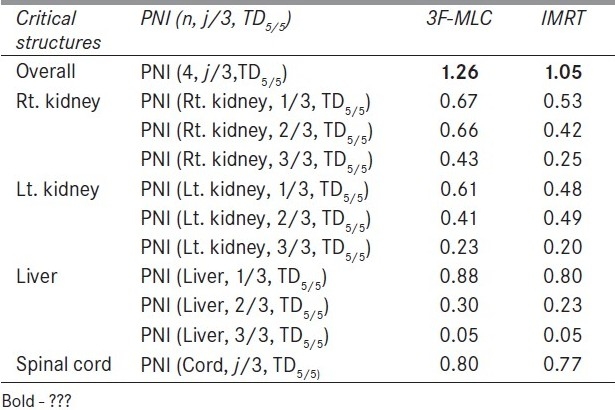
Figure 4.
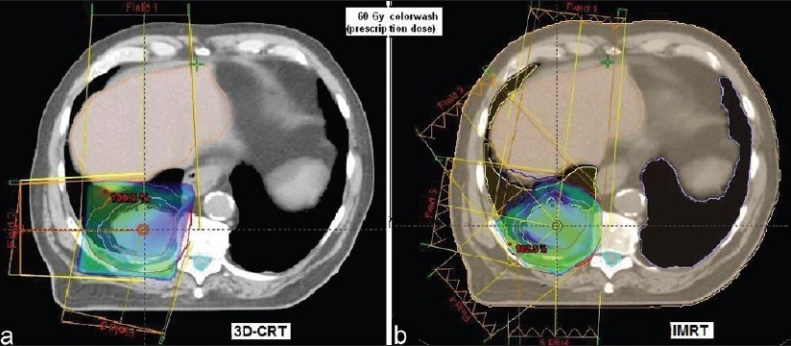
Comparison of 3-F MLC plan and IMRT for lung cancer
Table 4.
Comparison of PNI with 3D-CRT and IMRT for a lung cancer
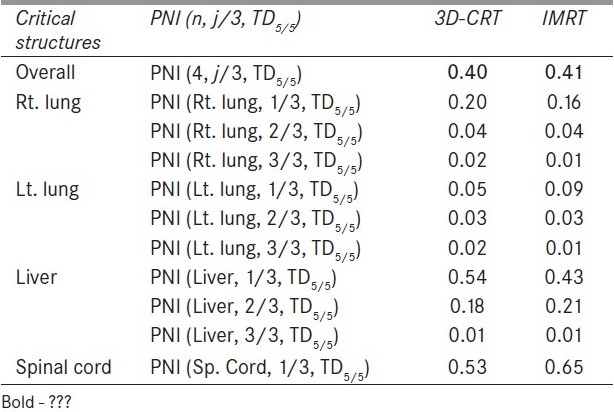
Table 5.
Comparison of PNI with 3D-CRT and IMRT for a head and neck cancer
Discussion
The PNI is a function of critical structures and 1/3rd, 2/3rd, 3/3 fraction of the critical structure and which can also be used for evaluating the treatment plans for a given fraction of the structure volume. The 1/3rd, 2/3rd, and 3/3 of the DVH curve represent the overall DVH for the critical structure and by incorporating these parameters for computing the PNI gives an overall trend of the DVH. The tolerance doses compiled by Emami et al.[8] are used in many clinics for assessing the normal tissue complications and form the basis of the decision-making process conducted by the radiation oncologist. The proposed index is applicable to treatment plans with conventional fractionation schedule of 1.8-2 Gy per fraction. The tissue tolerance data are stored in the software and it has the flexibility for the user to add any new tolerance data to the existing tissue tolerance table. The PNI should be as low as possible for a given plan and if it reaches 3 then all/most of the critical structures have exceeded the tolerance dose. It is clearly evident from Table 5 that the PNI with 3D-CRT has exceeded 3, thus indicating that both of the parotids are receiving higher than the acceptable tolerance doses predicting possible xerostomia. If the PNI for a partial/whole organ of an individual structure exceeds 1, then the plan has resulted in a dose higher than the tolerance dose. The treatment plan, 3F-O in Table 2 shows that rectum and right and left femur have exceeded the tolerance dose. Similarly in Table 5, with 3D-CRT both of the parotids have exceeded their tolerance dose. Except for the lung cancer treatment plan, all other plans showed that IMRT considerably reduced the overall dose to surrounding critical structures. In the case of lung cancer, five beams were employed resulting in a good CI as compared to 3D-CRT with three fields. Moreover the orientation of the treatment fields with 3D-CRT resulted in less dose to the spinal cord. In all the test cases, IMRT resulted in a very good CI. The PNI defined in Eq. 1 incorporates the minimal tolerance dose (TD5/5) and can also be used for computing PNI for maximal tolerance dose (TD50/5) by substituting TD5/5 with TD50/5. Even though the tolerance data published by Emami et al.[8] are applicable to a uniform dose distribution, they are frequently used in radiotherapy in most situations for assessing the normal tissue complications, and moreover the proposed PNI is essentially used for comparing treatment plans. The comparison of the overall PNI can be used for comparing rival plans, and their subsets can be used for analyzing the plan selected for treatment. The proposed index, PNI provides a quick comparison of the treatment plans for the radiation oncologist and also for the physicist to assess their treatment plans. The comparison of treatment plans based on QUANTEC recommendations helps in identifying those structures that exceed the threshold limit as set by the QUANTEC guidelines.
Conclusions
The proposed index, PNI, gives a quick comparison of the plan that results in reduced dose to the critical structures and totally relies on the tolerance doses to the critical structures. It can be used as an additional tool for routine treatment plan evaluation.
Footnotes
Source of Support: Nil
Conflict of Interest: None declared.
References
- 1.Withers HR. The 4R's of radiotherapy. In: Lett JT, Adler H, editors. Advances in radiation biology. Vol. 5. New York: Academic Press; 1975. pp. 241–5. [Google Scholar]
- 2.Austin-Seymour MM, Chen GT, Castro JR, Saunders WM, Pitluck S, Woodruff KH, et al. Dose volume histogram analysis of liver radiation tolerance. Int J Radiat Oncol Biol Phys. 1986;12:31–5. doi: 10.1016/0360-3016(86)90412-8. [DOI] [PubMed] [Google Scholar]
- 3.Lawrence TS, Tesser RJ, Ten Haken RK. An application of dose volume histograms to the treatment of intrahepatic malignancies with radiation therapy. Int J Radiat Oncol Biol Phys. 1990;19:1041–7. doi: 10.1016/0360-3016(90)90031-e. [DOI] [PubMed] [Google Scholar]
- 4.Kooy HM, Nedzi LA, Alexander E, Loeffler JS, Ledoux RJ. Dose-volume histogram computations for small intracranial volumes. Med Phys. 1993;20:755–60. doi: 10.1118/1.597029. [DOI] [PubMed] [Google Scholar]
- 5.Prabhakar R, Rath GK. Slice-based plan evaluation methods for three dimensional conformal radiotherapy treatment planning. Australas Phys Eng Sci Med. 2009;32:233–9. doi: 10.1007/BF03179244. [DOI] [PubMed] [Google Scholar]
- 6.Cheng CW, Das IJ. Treatment plan evaluation using dose-volume histogram (DVH) and spatial dose-volume histogram (zDVH) Int J Radiat Oncol Biol Phys. 1999;43:1143–50. doi: 10.1016/s0360-3016(98)00492-1. [DOI] [PubMed] [Google Scholar]
- 7.Rubin P, Cassarett GW. A direction for clinical radiation pathology. In: Walth JM, editor. In Front Radiat Ther Onc. Vol. 6. Baltimore: University Park Press; 1972. pp. 1–16. [Google Scholar]
- 8.Emami B, Lyman J, Brown A, Coia L, Goiten M, Munzenride JE, et al. Tolerance of normal tissue to therapeutic radiation. Int J Radiat Oncol Biol Phys. 1991;21:109–22. doi: 10.1016/0360-3016(91)90171-y. [DOI] [PubMed] [Google Scholar]
- 9.Kehwar TS. Analytical approach to estimate normal tissue complication probability using best fit of normal tissue tolerance doses into the NTCP equation of the linear quadratic model. J Cancer Res Ther. 2005;1:168–79. doi: 10.4103/0973-1482.19597. [DOI] [PubMed] [Google Scholar]
- 10.Marks LB, Yorke ED, Jackson A, Ten Haken RK, Constine LS, Eisbruch A, et al. Use of normal tissue complication probability models in the clinic. Int J Radiat Oncol Biol Phys. 2010;76(3 Suppl):S10–9. doi: 10.1016/j.ijrobp.2009.07.1754. [DOI] [PMC free article] [PubMed] [Google Scholar]
- 11.Jackson A, Marks LB, Bentzen SM, Eisbruch A, Yorke ED, Ten Haken RK, et al. The lessons of QUANTEC: Recommendations for reporting and gathering data on dose-volume dependencies of treatment outcome. Int J Radiat Oncol Biol Phys. 2010;76(3 Suppl):S155–60. doi: 10.1016/j.ijrobp.2009.08.074. [DOI] [PMC free article] [PubMed] [Google Scholar]
- 12.Marks LB, Ten Haken RK, Martel MK. Guest editor's introduction to QUANTEC: A users guide. Int J Radiat Oncol Biol Phys. 2010;76(3 Suppl):S1–2. doi: 10.1016/j.ijrobp.2009.08.075. [DOI] [PubMed] [Google Scholar]
- 13.ICRU Report 50. Prescribing, Recording and Reporting Photon Beam Therapy. Bethesda, MD: ICRU; 1993. International Commission on Radiation Units and Measurements. [Google Scholar]
- 14.Prabhakar R, Julka PK, Rath GK. Can field-in-field technique replace wedge filter in radiotherapy treatment planning: A comparative analysis in various treatment sites. Australas Phys Eng Sci Med. 2008;31:317–24. doi: 10.1007/BF03178601. [DOI] [PubMed] [Google Scholar]
- 15.Shaw E, Kline R, Gillin M, Souhami L, Hirschfeld A, Dinapoli R, et al. Radiation therapy oncology group: Radiosurgery quality assurance guidelines. Int J Radiat Oncol Biol Phys. 1993;27:1231–9. doi: 10.1016/0360-3016(93)90548-a. [DOI] [PubMed] [Google Scholar]