

Abstract
The purpose of this study is to compare Lyman-Kutcher-Burman (LKB) model versus Niemierko model for normal tissue complication probability (NTCP) calculation and Niemierko model versus Poisson-based model for tumor control probability (TCP) calculation in the ranking of different treatment plans for a patient undergoing radiotherapy. The standard normal tissue tolerance data were used to test the NTCP models. LKB model can reproduce the same complication probability data of normal tissue response on radiation, whereas Niemierko model cannot reproduce the same complication probability. Both Poisson-based and Niemierko models equally reproduce the same standard TCP data in testing of TCP. In case of clinical data generated from treatment planning system, NTCP calculated using LKB model was found to be different from that calculated using Niemierko model. When the fractionation effect was considered in LKB model, the calculated values of NTCPs were different but comparable with those of Niemierko model. In case of TCP calculation using these models, Poisson-based model calculated marginally higher control probability as compared to Niemierko model.
Keywords: Niemierko model, normal tissue complication probability, Poisson-based model and Lyman-Kutcher-Burman model, tumor control probability
Introduction
Evaluation of treatment plans for the determination of best plan among the different plans is done by analysis of dose volume histogram (DVH) as well as two-dimensional and three-dimensional spatial dose distributions. These plans are further evaluated by calculating the tumor control probability (TCP) and normal tissue complication probability (NTCP) of the treatment plans to determine the radiobiological ranking of different plans amongst them.[1–3] This final evaluation of treatment plans can be done by using both cumulative and differential DVH generated by treatment planning system (TPS). Various researchers developed their own in-house evaluation software for TCP and NTCP calculation.[3–6] Some of these models do not consider the fractionation effect in NTCP calculations,[2,7] whereas some of the models use the effect of fractionation in radiotherapy treatment in NTCP[5,6,8] and TCP[5,6,9] calculation. The purpose of this study is to develop a comprehensive and user-friendly in-house computer program for DVH analysis and clinical implementation of NTCP calculation based on Lyman-Kutcher-Burman (LKB) model and Poisson distribution model based TCP calculation and its comparison with those of calculations based on Niemierko models. Further, the incorporation of different dose per fraction sizes in LKB model will be tested.
Materials and Methods
Software requirements and data input/output
A MATLAB® software version 7.1 was used to develop this program. The differential and cumulative DVH data were exported from Eclipse TPS of Varian Medical System, Palo Alto, USA, in ASCII format in dose bin size of 20 cGy and these DVH data were imported in MATLAB software for the estimation of different DVH parameters, TCP and NTCP.
Normal tissue complication probability based on dose response curve
Lyman-Kutcher-Burman model
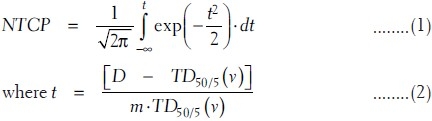
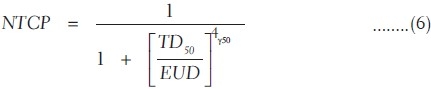
Lyman's formula models the sigmoid-shaped dose response curve of NTCP as a function of dose (D) to a uniformly irradiated fractional reference volume (vref). The parameters used in this model are TD50/5 (dose at which probability of complication becomes 50% in 5 years), m (tissue-specific parameter inversely proportional to the slope of response curve) and n [parameter to find the equivalent uniform dose (EUD) of inhomogeneous irradiation using DVH reduction method proposed by Kutcher-Burman model].[10,11] The expression of this NTCP is given as
The volume-dependent parameter TD50/5 (v) for fractional volume v can be expressed in terms of TD50/5 (1) of full volume irradiation as
![]()
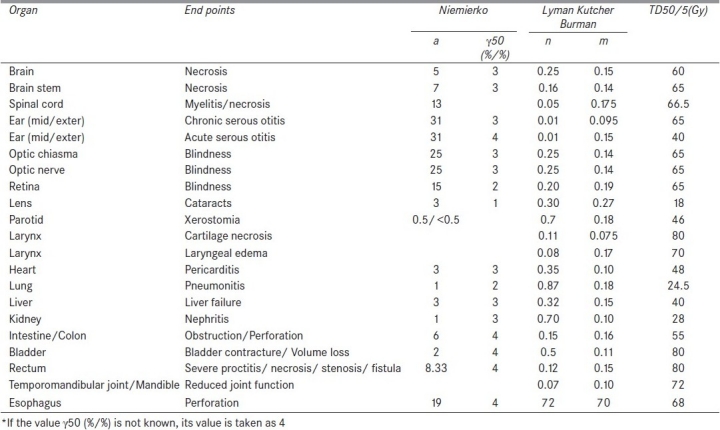
where 0 < n < 1 for all tissues fitted by Burman et al.[7] The above parameters are fitted on this model by Burman et al.[7] for the normal tissue tolerance data of high-grade complications associated with full or partial organ irradiation, compiled by Emami et al.[12] The values used in this study are summarized in Table 1. The dose response data of Emami et al. are derived mostly from nominal doses near to 2 Gy per fraction. Dose fractionation effects are not explicitly taken into account in this LKB model calculation of NTCP.
Table 1.
Parameters of sigmoidal dose response curve and dose volume histogram reduction scheme used in normal tissue complication probability calculation (LKB and Niemierko model)
Application of fractionation in Lyman-Kutcher-Burman model
The raw data obtained from TPS are of different dose per fraction. The radiobiological effects of such different dose per fraction size are different from those of 2 Gy per fraction for the same radiation dose distribution in an organ. In order to consider the effect of fractionation and size of dose per fraction in the NTCP calculation, the DVH of different doses per fraction is converted into biologically equivalent physical dose of 2 Gy per fraction (EQD2) using the linear quadratic (LQ) model as
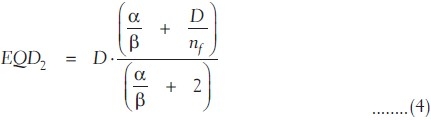
where nf and df = D/nf are the number of fractions and dose per fraction size of the treatment course, respectively. α/β are the tissue-specific LQ parameters of the organ being exposed. EQD2 DVH data obtained using equation (4) were used to calculate the LKB model based NTCP by Kuperman et al.,[13] using equations (1)-(3).
Niemierko model
In this model also, the raw data from TPS are converted into the biological equivalent physical EQD2 DVH using equation (4). Then, this DVH is converted into the DVH of the whole volume of the organ receiving an EUD, using the DVH reduction method proposed by Kutcher et al.[10] The EUD, obtained from the conversion of inhomogeneous dose distribution of different partial volume vi receiving the dose Di, is given as
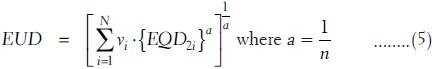
The value of a is equal to 1 when EUD is equal to mean dose. The “a” is a large negative value for tumor as the tumor control depends on the minimum dose received by the tumor. In case of normal tissues such as serial and parallel architectures, the values of a are large positive and small positive values depending on small and large volume effects, respectively. Then, the NTCP of such organ is determined using a logistic function as
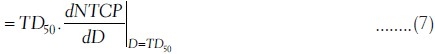
where γ50 is the slope of sigmoidal dose response curve of normal tissue at 50% complication probability
The tissue-specific parameters given in Table 1 are used for NTCP calculation based on Niemierko model.[8]
Tumor control probability
Poisson's model of cell killing
Survival of cell killing by radiation exposure follows the Poisson's distributions.[14] The probability of survival of clonogenic cell that does not receive any hit (N = 0) after the exposure of radiation dose D is given by
![]()
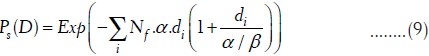
where Nc.p(D) is the average number of hits on Nc (clonogenic cells) due to small p(D) (probability of hit per cell). If it is assumed that cell killing follows two-target model of single-track and multiple track events, the probability of survivability of clonogenic cells after Nf, number of exposures of dose per fraction d, is given by
Similarly, TCP depends on the number of survived clonogenic cells Ns and small survival fraction ps(D), and TCP is given by the probability of average number of clonogenic cells survived (Ns = 0 = Nc.ps(D)) as
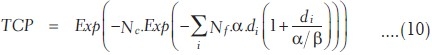
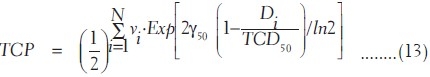
The number of clonogenic cells can be found out using the following relation according to Niemeirko and Goiten[9] and Stavrev et al.[15,16] [Appendix A]. If the clonogenic cell data are not available, the expression of TCP in equation (10) can also be rewritten in terms of sigmoidal dose response parameters according to Warkentin et al.[4] and Stavrev et al.[15,16] as
Appendix A.
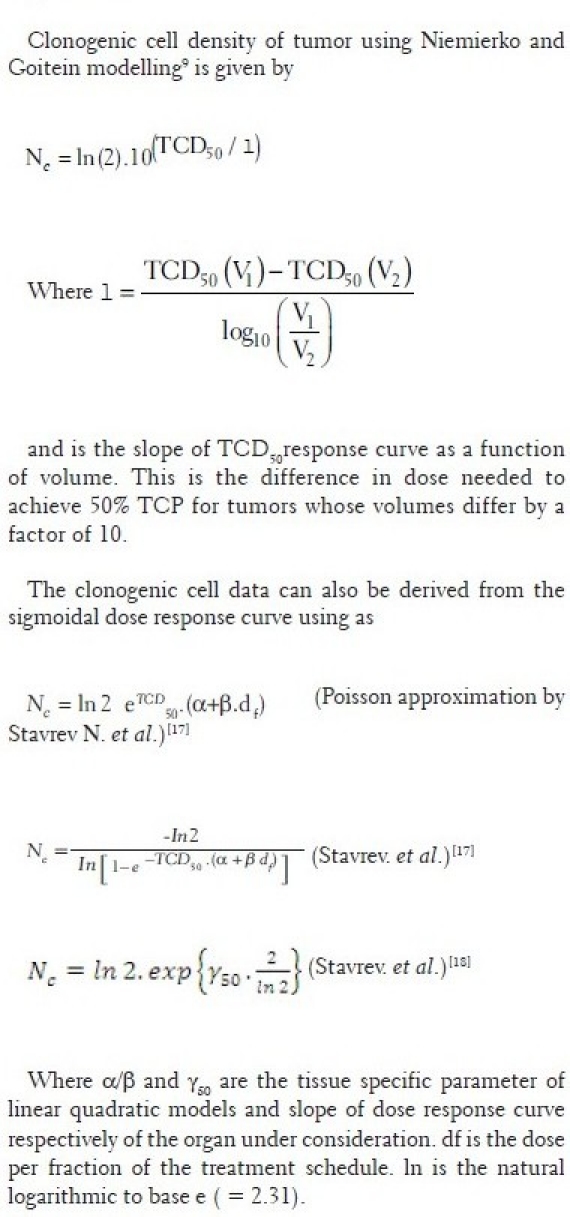
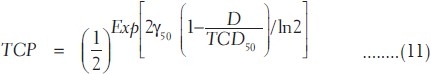
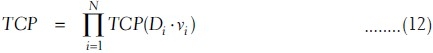
where TCD50 is the tumor dose required to produce 50% TCP and γ50 is the slope of dose response at 50% TCP, which is = 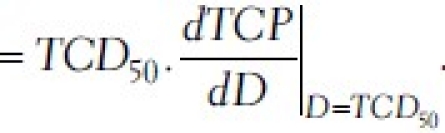 . For a heterogeneous irradiation of independent subvolumes vi of tumors with dose Di, the overall TCP is given by
Using equation (11), the TCP using Poisson-based model is given by
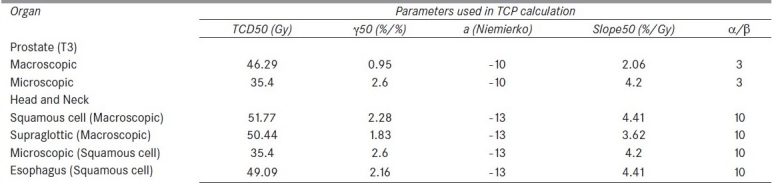
The tumor-specific parameters used in this study are given in Table 2.[17]
Table 2.
Parameters of sigmoidal dose response curve of tumor from Okunieff et al data for TCP calculation
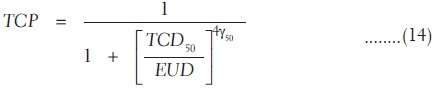
Niemierko model based on equivalent uniform dose
After converting the tumor DVH data of different dose per fraction size into equivalent physical DVH of 2 Gy per fraction using equation (4), the inhomogeneous dose distribution of different dose bin Di irradiating small volume vi is reduced into an EUD of the whole volume of the tumor using equation (5). The TCP of the tumor[9] of such dose distribution is given by
Results and Discussion
Dose volume analysis
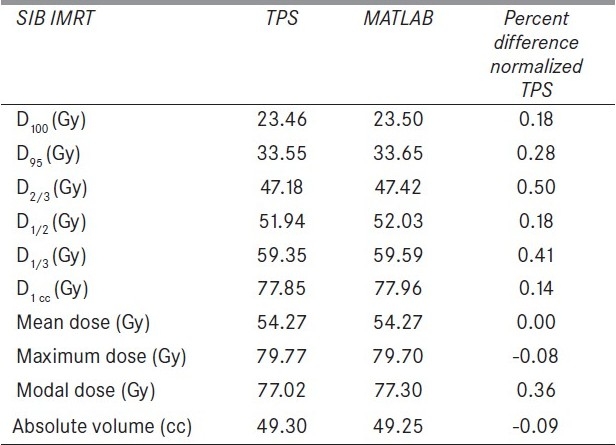
The flow charts of MATLAB programs for dose volume analysis and TCP and NTCP calculation software are shown in Appendix B. For DVH analysis and LKB model based NTCP calculation software, the required input data is cumulative DVH, whereas Poisson's model based TCP calculation software uses the differential DVH. In NTCP and TCP calculation using Niemierko model, differential DVHs are used. This software is compatible for any type of DVH. It can convert any type of DVH into a particular DVH depending on the requirement of model to be used for analysis. Figure 1 shows the output of cumulative DVH of this software, reconstructed from the differential DVH of TPS. This figure also shows percentage difference of calculated cumulative DVH from that of original DVH. The deviations of both the calculated DVHs from those of original DVHs are less than 0.006% except a small spike of –2.35% at an initial dose bin of differential DVH, reconstructed from cumulative DVH. The output of DVH analysis parameters is shown in Table 3. The DVH parameters calculated using this software are D100, D95, D2/3, D1/2, D1/3, and D1cc, (dose to 100%, 95%, 66.66%, 50%, 33.33%, 1 cc volume of the organ, respectively). Mean, maximum and minimum dose (Dmean, Dmax and Dmin) to the organ are also calculated by it.
Appendix B.
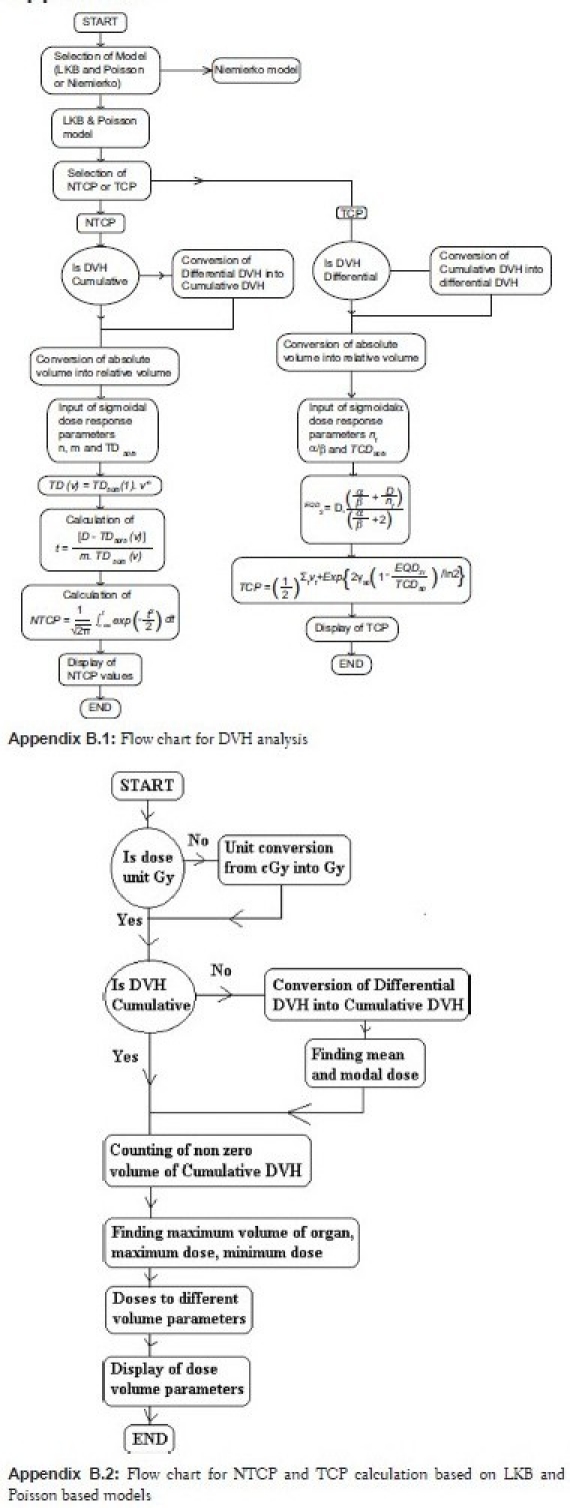
Figure 1.
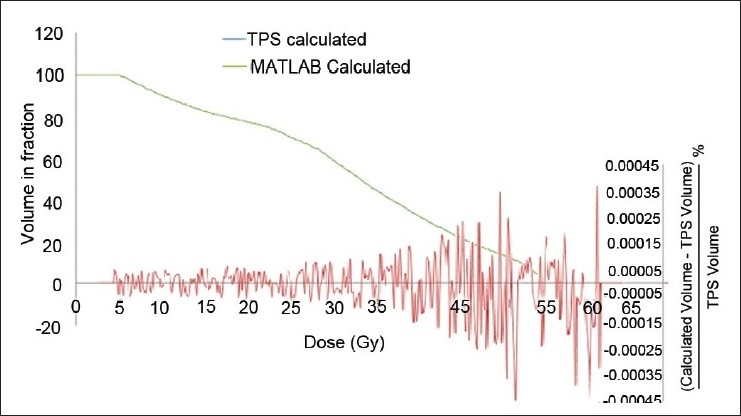
Dose volume histogram comparison of TPS calculated cumulative DVH and MATLAB calculated cumulative DVH from differential DVH for bowel. Fractional volume difference between the TPS calculated and MATLAB calculated DVHs
Table 3.
The difference of MATLAB calculated DVH parameters of an organ from those of TPS
Validity checking of NTCP calculation using Emami et al.'s data
The output of this comprehensive in-house developed m-file program of MATLAB software for NTCP and TCP calculation is shown in Figure 2. Table 4 shows the validity checking of normal tissue tolerance data of Emami et al.[12] NTCP calculation of LKB model for bladder using normal tissue tolerance dose data points of TD5/5 (normal tissue tolerance dose of 80 Gy and 65 Gy to 2/3 volume and whole volume of bladder, respectively, for 5% complication occurrence within 5 years of radiation exposure) of Emami et al.[12] was found as 4.76%, which is approximately equal to 5%, whereas Niemierko model calculated it to be 40.96%. 50% complication of bladder for the data of tolerance dose (TD50/5 of 85 Gy and 80 Gy to 2/3 volume and whole volume of bladder, respectively) was found exactly as NTCP of 50% was obtained using LKB model, whereas Niemierko model calculated higher complication probability of 70.12%. In selecting the data point of dose corresponding to volume lesser than 2/3 volume of bladder, it is assumed that any volume lesser than 2/3 volume of bladder receiving the dose corresponding to 2/3 volume of bladder will produce the same radiobiological effects.
Figure 2.
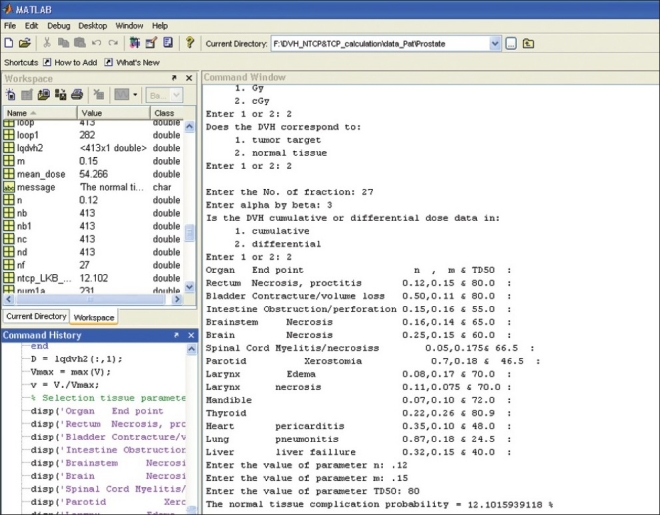
Output of NTCP and TCP calculation software based on Lyman-Kutcher-Burman, Niemierko and Poisson-based model
Table 4.
Validity checking of normal tissue complication probability calculation using Emami et al. (1994) data
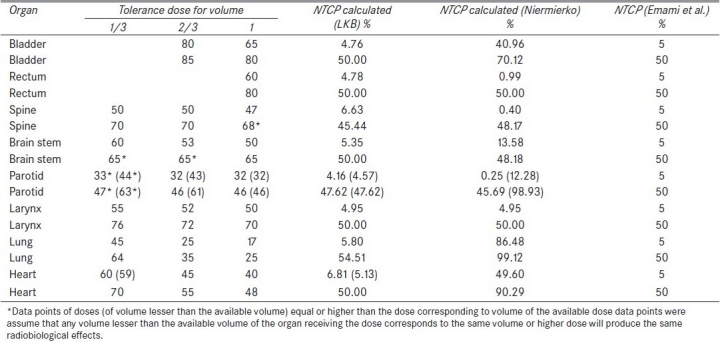
Similarly, in case of rectum, NTCP calculation of LKB model using TD5/5 and TD50/5 of rectum was found to be 4.78% and 50%, respectively, whereas Niemierko model underestimated NTCP to be 0.99% for TD5/5 and 50% complication was exactly calculated for TD50/5. The complication probability calculation of spine using LKB model corresponding to TD5/5 and TD50/5 was found as 6.63% and 45.44%, respectively, whereas those calculated using Niemierko model were found to be 0.40% and 48.17%, respectively. Both TD5/5 and TD50/5 were overestimated by Niemierko model in case of lung and heart. The overestimations of lung were 86.48% and 99.12% for TD5/5 and TD50/5, respectively. Similarly, for heart, TD5/5 and TD50/5 are calculated as 49.60% and 90.29%, respectively. The values for parotid,[18,19] spine and rectum were found to be underestimated as 0.25%, 0.40% and 0.99%, respectively, for TD5/5. However NTCPs of bladder and brainstem were overestimated as 37.91% and 13.58%, respectively, corresponding to TD5/5. In all cases of normal tissues, LKB model reproduces the same complication probabilities of normal tissue tolerance data of Emami et al.[12]
NTCP calculation output using TPS data
A few brief examples of the output of this software are shown in Table 5. These consist of DVH parameters and NTCPs calculated by this software using the normal tissue dose response and tumor dose response parameters. Figure 3 and Table 5 show DVH calculation of rectum for four different prostate adenocarcinoma treatment plans. According to relative cumulative DVHs and DVH parameters of rectum, plan (2) has to produce the minimum NTCP and NTCP has to be increased in the order: plan (2), plan (4), plan (3) and plan (1). The NTCPs calculated using LKB models are 2.73%, 2.88%, 3.07% and 4.66%, respectively, in the increasing order for the above order of plans, whereas Niemierko models calculated the NTCPs to be 16.48%, 15.84%, 3.17% and 5.76%, respectively. The first two plans used the number of fractions of 27, whereas the last two plans used the number of fractions of 37. Since the fractionation effect is not taken into account in the LKB model, the first two plans produce lesser NTCPs as compared to the last two plans. But when the fractionation effect is taken into account using equation (4) by converting the cumulative dose of different dose per fraction into the equivalent dose of 2 Gy per fraction, the first two plans predict NTCPs of 12.10% and 12.25%, respectively, whereas the last two plans are estimated to predict 3.04% and 4.95%, respectively, which are approximately predicted by Niemierko model.
Table 5.
Normal tissue complication probability for the treatment of different sites from tumor control probability data
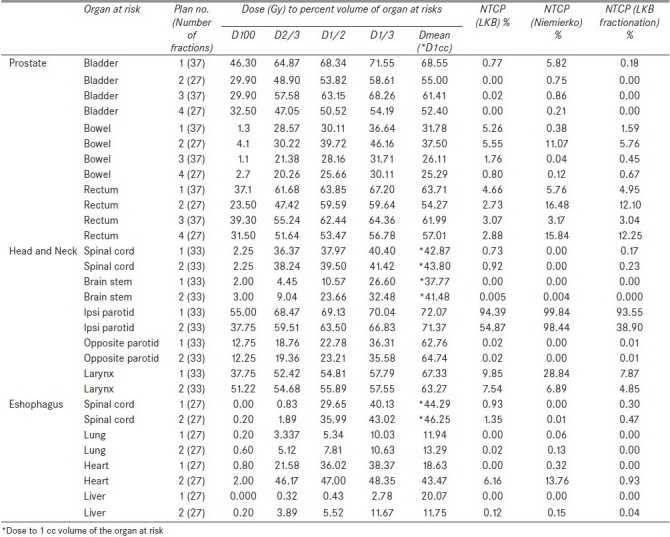
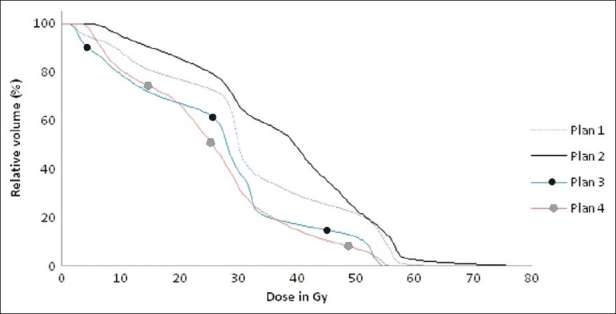
Figure 3.
Cumulative dose volume histograms of rectum of four different plans showing the different dose delivery to rectum
NTCPs of different organs at risk (bowel and bladder for four different cases of prostate adenocarcinoma treatments; spinal cord, brainstem, ipsilateral parotid, larynx and contralateral parotid for two cases of a head and neck radiotherapy treatment, and spinal cord, heart, liver and lung for two treatment cases of squamous cell carcinoma of esophagus) are also shown in Table 5. Similarly, the DVH parameters Table 5and cumulative DVH [Figures 4 and 5] of these organs can predict NTCPs in LKB model. Considering the fractionation effect by Niemierko and LKB models, the calculated NTCPs were comparable to each other in all organs at risk.
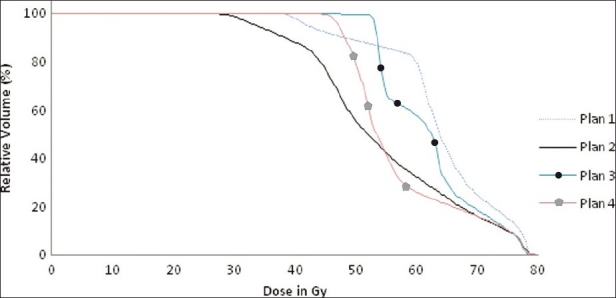
Figure 4.
Cumulative dose volume histograms of bowel of four different plans showing the different dose delivery to bowel
Figure 5.
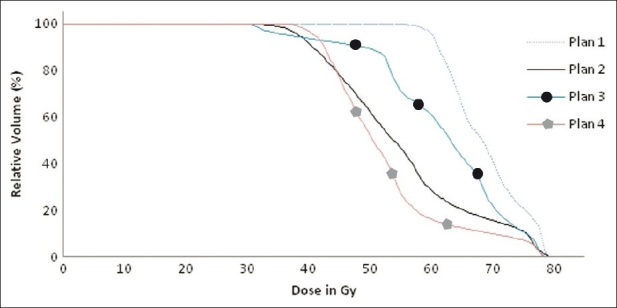
Cumulative dose volume histograms of bladder of four different plans showing the different dose delivery to bladder
The complication probabilities of ipsilateral parotids were found to be 94.38%, 99.84% and 93.55% for plan (1) and 54.87%, 98.44% and 38.90% for plan (2), when they were calculated using LKB, Niemierko and LKB fractionation models, respectively. DVH parameters also showed relatively larger volume of parotid irradiated to higher dose in plan (1) as compared to plan (2). The magnitudes of NTCPs amongst these three models were comparable in plan (1) but varied largely. Both the LKB models calculated smaller than that of Niemierko model in case of plan (2). This is occrred due to the use of a single value of EUD for the whole volume of organ, derived using Kutcher-Burman DVH reduction method in Niemierko model.[5] The decrease in the values of NTCPs of both the LKB models[2,7] is due to the considerations of every fractional volumes and the corresponding equivalent doses reduced from physical doses using the same DVH reduction method. Complication probability calculated using LKB fractionation model was lesser than that of LKB model due to the reduction of the physical dose of parotid into a relatively lesser dose of EQD2. But in case of plan (1), EQD2 dose of different fractional volumes of DVH was approximately equal to the physical dose.
TCP calculation
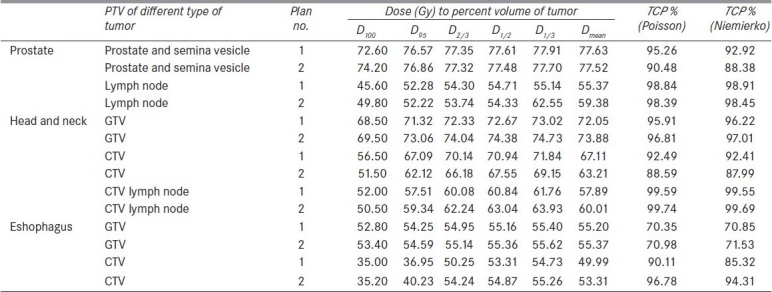
Table 6 presents the calculated values of TCPs of TPS DVH data using Poisson-based model and Niemierko model for the treatment of adenocarcinoma of prostate, squamous cell carcinoma of oropharynx and esophagus tumor. The TCP values calculated using Poisson-based model were marginally larger than those of Niemierko model (within 5%), except the lesser estimation (within 0.6%) for macroscopic tumor of oropharynx and esophagus tumor and microscopic tumor of adenocarcinoma of prostate (within 0.06%). When the DVHs reconstructed from Okunieff et al.'s data[17] were used for TCP calculation, 50% TCPs of microscopic[20] and macroscopic tumor of adenocarcinoma[17,21] of prostate were reproduced as 48.31% and 50.25% by both Poisson and Niemierko models. Both the TCP calculation models calculated the same TCP values of 49.32% for all microscopic tumors of squamous cell carcinoma.[17] In case of squamous cell carcinoma of macroscopic tumor of head and neck[22–25] and esophagus,[26–28] TCP values were calculated as 49.86% and 49.32%, respectively, by both Poisson and Niemierko TCP calculation models.
Table 6.
TCP for the treatment of different sites from TPS data
Conclusion
This software developed using MATLAB platform can be used as a user-friendly program to estimate the DVH parameters, TCP and NTCP values, for the ranking of different plans. From the above discussion, it can be concluded that Niemierko model cannot predict the same normal tissue complication data of Emami et al.,[12] whereas LKB model can predict the same complication data. Both Poisson-based model and Niemierko model for TCP calculation equally reproduced the same TCP of Okunieff et al.'s data.[17] But in case of clinical data generated from TPS, NTCPs calculated using LKB model were found to be different from those of Niemierko model. When the fractionation effect is considered in LKB model, the calculated NTCPs were lesser than those of LKB model which does not take into account fractionation, but both LKB and Niemierko models were comparable to each other. In case of TCP calculation using these models, Poisson-based model calculated marginally higher control probability as compared to Niemierko model.
Footnotes
Source of Support: Nil
Conflict of Interest: None declared.
References
- 1.Langer M, Morrill SS, Lane R. A test of the claim that plan rankings are determined by relative complication and TCP. Int J Radiat Oncol Biol Phys. 1998;41:451–7. doi: 10.1016/s0360-3016(98)00057-1. [DOI] [PubMed] [Google Scholar]
- 2.Lyman JT. Complication probability as assessed from dose volume histogram. Radiat Res Suppl. 1985;8:S13–9. [PubMed] [Google Scholar]
- 3.Wu Q, Mohan R, Niemierko A, Schmidth-Ullrich R. Optimization of IMRT plans based on equivalent uniform dose. Int J Radiat Oncol Biol Phys. 2002;52:224–35. doi: 10.1016/s0360-3016(01)02585-8. [DOI] [PubMed] [Google Scholar]
- 4.Warkentin B, Stavrev P, Stavreva N, Field C, Fallone BG. A TCP and NTCP estimation module using DVHs and known radiobiological models and parameter sets. J Appl Clin Med Phys. 2004;5:50–63. doi: 10.1120/jacmp.v5i1.1970. [DOI] [PMC free article] [PubMed] [Google Scholar]
- 5.Gay H, Niemierko A. A free program for calculating EUD-based NTCP and TCP calculation in external beam radiotherapy. Physica Medica. 2007;2:115–25. doi: 10.1016/j.ejmp.2007.07.001. [DOI] [PubMed] [Google Scholar]
- 6.Sanchez-Nieto B, Nahum AE. BIOPLAN: Software for biological evaluation of radiotherapy treatment plans. Med Dosim. 2000;25:71–6. doi: 10.1016/s0958-3947(00)00031-5. [DOI] [PubMed] [Google Scholar]
- 7.Burman C, Kutcher GJ, Emami, Goiten M. Fitting of normal tissue tolerance data to an analytic-function. Int J Radiat Oncol Biol Phys. 1991;21:123–35. doi: 10.1016/0360-3016(91)90172-z. [DOI] [PubMed] [Google Scholar]
- 8.Niemierko A, Goiten M. Modeling of normal tissue response to radiation critical volume model. Int J Radiat Oncol Biol Phys. 1993;25:135–45. doi: 10.1016/0360-3016(93)90156-p. [DOI] [PubMed] [Google Scholar]
- 9.Niemierko A, Goiten M. Implementation of a model for estimating TCP for an inhomogeneously irradiated tumor. Radiother Oncol. 1993;29:140–7. doi: 10.1016/0167-8140(93)90239-5. [DOI] [PubMed] [Google Scholar]
- 10.Kutcher GJ, Burman C, Brewster L. Histogram reduction method for calculating complication probabilities for three dimensional treatment planning evaluations. Int J Radiat Oncol Biol Phys. 1991;21:137–46. doi: 10.1016/0360-3016(91)90173-2. [DOI] [PubMed] [Google Scholar]
- 11.Kutcher GJ, Burman C. Calculation of complication probability factors for non-uniform normal tissue irradiation: The effective volume method. Int J Radiat Oncol Biol Phys. 1989;16:1623–30. doi: 10.1016/0360-3016(89)90972-3. [DOI] [PubMed] [Google Scholar]
- 12.Emami B, Lyman, Brown A. Tolerance of normal tissue to therapeutic irradiation. Int J Radiat Oncol Biol Phys. 1994;21:109–22. doi: 10.1016/0360-3016(91)90171-y. [DOI] [PubMed] [Google Scholar]
- 13.Kuperman VY. General properties of different models used to predict normal tissue complications due to radiation. Med Phys. 2008;35:4831–6. doi: 10.1118/1.2963988. [DOI] [PubMed] [Google Scholar]
- 14.Feller W. An introduction to probability theory and its applications. 2nd ed. Vol. 1. New York: NY: Wiley and Sons; 1957. pp. 142–3. [Google Scholar]
- 15.Stavrev N, Stavrev P, Warkentin B, Fallone BG. Derivation of the expression for γ50 and D50 for different individual TCP and NTCP models. Phys Med Biol. 2002;47:3591–604. doi: 10.1088/0031-9155/47/20/303. [DOI] [PubMed] [Google Scholar]
- 16.Stavrev P, Stavrev N, Niemierko A, Goiten M. Generalization of a model of tissue response to radiation based on the idea of functional subunits and binomial statistics. Phys Med Biol. 2001;46:1501–18. doi: 10.1088/0031-9155/46/5/312. [DOI] [PubMed] [Google Scholar]
- 17.Okunieff P, Morgan D, Niemierko A, Suit HD. Radiation dose-response of human tumors. Int J Radiat Oncol Biol Phys. 1995;32:1227–37. doi: 10.1016/0360-3016(94)00475-z. [DOI] [PubMed] [Google Scholar]
- 18.Eisbruch A, Ten Haken RK, Kim HM, Marsh LH, Ship JA. Dose, volume, and function relationships in parotid salivary glands following conformal and intensity-modulated irradiation of head and neck cancer. Int J Radiat Oncol Biol Phys. 1999;45:577–87. doi: 10.1016/s0360-3016(99)00247-3. [DOI] [PubMed] [Google Scholar]
- 19.Chao KS, Deasy JO, Markman J, Haynie J, Perez CA, Purdy JA. A prospective study of salivary function sparing in patients with head-and-neck cancers receiving intensity-modulated or three-dimensional radiation therapy: Initial results. Int J Radiat Oncol Biol Phys. 2001;49:907–16. doi: 10.1016/s0360-3016(00)01441-3. [DOI] [PubMed] [Google Scholar]
- 20.Chu FC, Lin FJ, Kim JH, Huh SH, Garmatis CJ. Locally recurrent carcinoma of the breast. Cancer. 1976;37:2677–81. doi: 10.1002/1097-0142(197606)37:6<2677::aid-cncr2820370616>3.0.co;2-l. [DOI] [PubMed] [Google Scholar]
- 21.Burstein FD, Calcaterra TC. Supraglottic laryngectomy: Series report and analysis of results. Laryngoscope. 1995;95:833–6. [PubMed] [Google Scholar]
- 22.Hanks GE. Optimizing the radiation treatment and outcome of prostate cancer. Int J Radiat Oncol Biol Phys. 1985;11:1235–45. doi: 10.1016/0360-3016(85)90239-1. [DOI] [PubMed] [Google Scholar]
- 23.Khafif RA, Rafla S, Tepper P. Effectiveness of radiotherapy with radical neck dissection in cancers of the head and neck. Arch Otolaryngol Head Neck Surg. 1990;117:1960–9. doi: 10.1001/archotol.1991.01870140084012. [DOI] [PubMed] [Google Scholar]
- 24.North CA, Lee DJ, Piantadosi S, Zahurak M, Johns ME. Carcinoma of the major salivary glands treated by surgery or surgery plus postoperative radiotherapy. Int J Radiat Oncol Biol Phys. 1990;18:1319–26. doi: 10.1016/0360-3016(90)90304-3. [DOI] [PubMed] [Google Scholar]
- 25.Fletcher GH. Clinical dose-response curves of human malignant epithelial tumours. Br J Cancer. 1973;46:1–12. doi: 10.1259/0007-1285-46-541-1. [DOI] [PubMed] [Google Scholar]
- 26.Akakura I, Nakamura Y, Kakegawa T, Nakayama R, Watanabe H, Yamashita H. Surgery of carcinoma with preoperative radiation. Chest. 1970;57:47–57. doi: 10.1378/chest.57.1.47. [DOI] [PubMed] [Google Scholar]
- 27.Kasai M, Mori S, Watanabe T. Follow-up results after resection of thoracic esophageal carcinoma. World J Surg. 1978;2:543–51. doi: 10.1007/BF01563699. [DOI] [PubMed] [Google Scholar]
- 28.Whittington R, Coia LR, Haller DG, Rubenstein JH, Rosato EF. Adenocarcinoma of the esophagus and esophago-gastric junction: The effects of single and combined modalities on the survival and patterns of failure following treatment. Int J Radiat Oncol Biol Phys. 1990;19:593–603. doi: 10.1016/0360-3016(90)90485-3. [DOI] [PubMed] [Google Scholar]