

Abstract
The 83Kr magnetic resonance (MR) relaxation time T1 of krypton gas in contact with model surfaces was previously found to be highly sensitive to surface composition, surface to volume ratio, and surface temperature. The current work explored aspects of pulmonary 83Kr T1 relaxation measurements in excised lungs from healthy rats using hyperpolarized (hp) 83Kr with approximately 4.4 % spin polarization. MR spectroscopy without spatial resolution was applied to the ex vivo lungs that actively inhale hp 83Kr through a custom designed ventilation system. Various inhalation schemes were devised to explore the influence of anatomical dead space upon the measured 83Kr T1 relaxation times. The longitudinal 83Kr relaxation times in the distal airways and the respiratory zones were independent of the lung inhalation volume, with T1 = 1.3 s and T1 = 1.0 s, depending only on the applied inhalation scheme. The obtained data was highly reproducible between different specimens. Further, the 83Kr T1 relaxation times in excised lungs were unaffected by the presence of up to 40% oxygen in the hp gas mixture. The results support the possible importance of 83Kr as a biomarker for evaluating lung function.
1. Introduction
Since the first reports of pulmonary MRI with hyperpolarized (hp) 129Xe (Albert et al., 1994) and hp 3He (Middleton et al., 1995) approximately 1 ½ decades ago, a variety of pulmonary diagnostic MRI techniques have been developed that are based on these two noble gas isotopes with nuclear spin I = ½ (Moller et al., 2002; Cherubini and Bifone, 2003; Lutey et al., 2008; Santyr et al., 2009). The immediate task for advancing hp gas based MR techniques is to better understand lung function and to develop new biomarkers for various lung pathologies. Demonstrated examples are direct gas density imaging that provides insights into ventilation defects caused by chronic obstructive pulmonary disease (COPD) and smoking (de Lange et al., 1999) or restricted ventilation caused by asthma (Altes et al., 2001; Samee et al., 2003; Tustison et al., 2010). The apparent diffusion contrast (ADC) is related to alveolar size and is a biomarker for COPD with some research suggesting that it is a sensitive approach for detecting the early stages of COPD (Yablonskiy et al., 2002; Peces-Barba et al., 2003; Fain et al., 2005; Altes et al., 2006; Woods et al., 2006; van Beek et al., 2009). The large gyromagnetic ratio of 3He makes the relaxation of this isotope (and to a lesser extent the relaxation of 129Xe) sensitive to the presence of paramagnetic substances (Abragam, 1961). Molecular oxygen, O2 , is the only paramagnetic molecule present in sufficient quantities in the inhaled gas to influence 3He relaxation. The T1 relaxation of 3He can therefore provide information about alveolar oxygen partial pressure (Fischer et al., 2005; Cieslar et al., 2007; Yu et al., 2008). Hp 129Xe, with high tissue solubility and 300 ppm chemical shift range (Goodson, 2002), has been explored to study gas exchange in lungs (Ruppert et al., 2000; Driehuys et al., 2006; Ruppert et al., 2007; Driehuys et al., 2009; Cleveland et al., 2010). Hp 129Xe was also explored for molecular imaging using functionalized xenon biosensors (Hilty et al., 2006; Schroder et al., 2006) and was infused directly into blood for MR imaging applications (Cleveland et al., 2009).
The recent development of hp 83Kr MR (Pavlovskaya et al., 2005; Cleveland et al., 2006; Cleveland et al., 2007;Cleveland et al., 2008a; Cleveland et al., 2008b) provides potentially a new pulmonary biomarker that utilizes the nuclear electric quadrupole moment of 83Kr as a probe for surfaces. Hyperpolarization of the spin I = 9/2 isotope 83Kr is achieved by spin exchange optical pumping (SEOP) in a stopped flow mode for 10 - 15 min (Walker and Happer, 1997; Cleveland et al., 2006). The gas phase relaxation time, T1, is on the order of hundreds of seconds at atmospheric pressure (Brinkmann and Kuhn, 1980; Cleveland and Meersmann, 2008a, b) and is therefore sufficiently long to separate the hp 83Kr from the rubidium vapor used in the SEOP process without substantial depolarization (Cleveland et al., 2006). The separation of the highly reactive and therefore toxic alkali metal is crucial for any pulmonary application. The 83Kr gas phase relaxation time, T1, is shortened in the presence of a surface and is inversely dependent on the surface-to-volume ratio (Stupic et al., 2006). In porous media, the T1 of 83Kr is affected by surface composition (Stupic et al., 2006; Cleveland et al., 2008b), surface hydration (Cleveland et al., 2007), and surface temperature (Cleveland et al., 2006). The sensitivity of 83Kr relaxation to surfaces that are in contact with the hp gas arises from interactions of the nuclear electric quadrupole moment with the electric field gradient (EFG) from the electronic environment surrounding the krypton nucleus. In the case of noble gas atoms, an EFG is typically caused by distortions of the electron cloud of the noble gas atom during surface adsorption. This effect can provide T1 contrast in MRI (Pavlovskaya et al., 2005; Cleveland et al., 2008b) that may complement information obtained from hp 3He or hp 129Xe MRI data.
Previous reports with hp 83Kr provided the proof of concept of 83Kr relaxation as a surface sensitive contrast agent in model systems (Pavlovskaya et al., 2005) and demonstrated the feasibility of hp 83Kr MRI in rat lungs (Cleveland et al., 2008a). This work explores the effects that influence pulmonary hp 83Kr T1 relaxation measurements using excised lungs of healthy rats. A spatially non-resolved MR spectroscopy study of hp 83Kr relaxation as a function of pulmonary inhalation in excised rat lungs using natural abundance krypton (i.e. 11.5 % 83Kr) is reported here expanding the potential role of this new technique for evaluating and monitoring lung function in health and disease.
2. Materials and Methods
2.1. Spin exchange optical pumping (SEOP) of 83Kr
Hyperpolarized (hp) 83Kr was produced with two 35 W diode array lasers (Spectra Physics, Santa Clara, Ca) line-narrowed to 0.3 nm at the Rb D1 transition of 794.7 nm. The laser power available for SEOP was approximately 30 W for each of the lasers after accounting for losses in the optical elements used for the experiments. The lasers were oriented such that simultaneous illumination from the front and back of the cylindrical glass SEOP cell (Pyrex glass, no surface treatment, ID = 28 mm, length = 125 mm) was achieved. Stopped flow SEOP was employed as previously described (Cleveland et al., 2008a) using 10 – 20 min laser irradiation at a pump cell pressure of 135 kPa. Each SEOP cell was loaded with 1 g of Rb (99.75%; Alfa Aesar, Ward Hill, MA) and the krypton mixture was produced from research grade gases (Airgas, Radnor, PA) comprised of 25% krypton (99.995% pure), 5% nitrogen (99.9997% pure), and 70% helium (99.9999% pure). The SEOP system was constructed of glass and PTFE tubing using brass valves and unions as necessary. Due to fast quadrupolar relaxation on siliconized or silanized surfaces (Wu et al., 1990; Stupic et al., 2006) all glassware that was in contact with hp 83Kr was used without surface treatment of any kind. All other materials in contact with hp 83Kr were also used as supplied without modification of the surfaces. During operation the SEOP cell containing the gas mixture was kept at a temperature of 438 ± 5 K using a temperature controlled air flow to provide even heating across the cell. All SEOP operation took place in the fringe field of the superconducting magnet at approximately 50 mT. 40 ml of the Rb free hp gas was transferred through equalization to ambient pressure into the injection syringe with variable storage volume VA (see figure 1). Note that the ambient pressure is p ≈ 83 kPa at the laboratory location in 1500 m elevation. An air-cooled condenser placed at the outlet of the SEOP cell was used to separate the Rb vapor from the hp gas. The hp gas was then transferred further (section 3.2), without separation of the krypton from the SEOP mixture, for ventilation into the lungs (section (2.3)).
Figure 1.

Overview of experimental setup and gas delivery system for hp 83Kr MR experiments. (a) Experimental setup for the hp 83Kr delivery to the lung. 83Kr is hyperpolarized through SEOP in the pumping cell at 135 kPa pressure, while valves #1 and #3 are closed and valve #2 is opened to evacuate the syringe. Valve # 2 is then closed and valve #1 is opened to deliver hp 83Kr through pressure equalization into storage container VA. Valve 1 is closed again and valve 3 is opened to allow for hp 83Kr injection into the storage container with volume VB. The lungs are fully immersed in Belzer-MPS solution (UW Kidney Preservation Solution) with the trachea pointing downward and connected to the external opening below the ventilation chamber. (b) Expanded view of gas delivery to storage container VB with valve # 3 opened. The hp 83Kr passes over the lung orifice as it is slowly injected into VB while the pressure of the system stays approximately constant, thus preventing any premature entry of hp 83Kr into the lung. Excess hp 83Kr delivered beyond the capacity of storage container VB (expandable from 6 ml to 30 ml) is exhausted to open air. (c) Delivery of hp 83Kr to the lungs (valve #3 closed). A syringe connected to the top of the ex vivo lung ventilation chamber creates a suction, thus causing inhalation by the lungs and therefore active inhalation of the hp 83Kr gas into the lung. The suction volume Vs of the syringe was correlated to the inhalation volume Vi prior to the experiments by monitoring the level of the liquid in the ventilation chamber as a function of Vs.
2.2. Animal care and usage
Following the University of Colorado Health Sciences Center approved protocol, 30 healthy, male Sprague-Dawley rats (Charles River Laboratories, Inc., Wilmington, MA) rats (175 – 400 g) at the time of lung excision were anesthetized with ketamine (80 mg/kg) (University of Colorado Hospital pharmacy) and xylazine (16 mg/kg) (MWT Veterinary Supply, Meridian, ID). 100 USP units heparin (American Pharmaceutical Partners, Inc., Schaumburg, IL) injected into the anesthetized animal via the right ventricle of the heart were allowed to circulate for 10 - 15 s before lungs were placed on a ventilator. The lungs were perfused with 50 ml of Belzer-MPS solution (UW Kidney Preservation Solution, Trans-Med Corporation, Elk. River, MN) and the trachea was clamped at the time of inhalation to avoid collapsing the airways while removing the heart and lungs en bloc from the chest cavity. The excised lungs were then cannulated with a plastic adapter tube and positioned 5 mm above the bifurcation of the lungs (Cleveland et al., 2008a).
2.3. Ex vivo lung ventilation
Following excision, the lungs, with the heart still attached, were immediately transferred into a Pyrex ventilation chamber (inner diameter = 34 mm and height = 100 mm) with the main trachea pointing downwards as shown in figure 1(a-c). The lung trachea was connected via the adapter tube to the access opening in the bottom of the ventilation chamber that allowed for ventilation after the lungs were immersed in ~60 ml of Belzer-MPS solution. The lungs were then inflated to 5-6 ml of air and transported to the imaging facility at a temperature of 277 K.
Prior to all experiments, the lungs submerged in the ventilation chamber were inflated to 1 ml above the maximum inhalation volume used in the measurements. This procedure was undertaken to check if any gas bubbling was occurring from the sutures connecting the trachea to the adapter tube, or from the lung itself since any leakage could affect the apparent relaxation behavior. All lungs were kept at 290 K for the experiments, a temperature that corresponded to the bore temperature of the superconducting magnet.
Lung inhalation was accomplished through suction above the Belzer-MPS solution using a syringe (i.e. ventilation syringe) attached to the top of the ventilation chamber (Cleveland et al., 2008a) as shown in figure 1. The applied suction allowed for the lung to inhale to the desired inhalation volume Vi (see figure 1(c)). The ventilation syringe was calibrated prior to the experiments by correlating the applied ‘suction volume’ Vs with the displacement volume of the Belzer-MPS solution and therefore with the inhaled gas volume Vi in the lungs. The displacement volume was determined through the rise of the liquid level in the ventilation chamber. After calibration, this procedure enables a good control of the inhaled gas volume Vi during the experiments inside the MR magnet when the lungs are shielded from the view. Note that the ventilation chamber enabled the ex vivo lungs to actively inhale the gas, rather than being passively inflated by a pressurized gas.
2.4. Longitudinal relaxation measurements
T1 measurements were obtained with a 43 mm (inner diameter) saddle coil tuned to 15.4 MHz 83Kr resonance frequency at 9.4 T. The lung ventilation chamber of 40 mm diameter allowed the rat lungs to expand without contacting the ventilation chamber walls. A pulse sequence consisting of 32 small (constant 12°) flip angle RF pulses spaced evenly in time at intervals of τ = 0.2 s was used to collect a spectrum at each time interval during inhalation by the lung and subsequent breath hold. Only the spectra at sufficient time after breath hold were used for analysis. Specifically, data recorded at 0.4 s after the observed maximum integrated intensity was used for T1 fitting. This ‘starting point’ for the fitting was defined as experimental number n = 0 at time t = n · τ = 0 s . The natural logarithm of integrated signal, S(n), normalized by its value at n = 0, was fitted as a function of the experimental number n using:
| [1] |
Equation (1) takes the polarization destruction occurring from the θ = 12° flip angle RF pulse into account (Gao et al., 1997; Cleveland et al., 2008b). The linear fitting was applied to data obtained between t = 0 s up to t = 2.6 s because of non-linearity occurring after this time in all data sets.
3. Results and Discussion
3.1. 83Kr hyperpolarization
83Kr SEOP with the two 30 W line-narrowed diode array lasers generated a signal enhancement of 9300 times the thermally polarized 83Kr signal at 9.4 T magnetic field strength and 290 K temperature. The spin polarization P of the thermally polarized spin I = 9/2 system was calculated through equation (2) (Stupic et al., 2011).
| [2] |
where γ is the gyromagnetic ratio, kB is the Boltzmann constant , and ħ = h/2π is the Planck constant. Note that for I = ½, equation (2) leads to P = |γ| ħB0/(2kBT) that is commonly used for 3He and 129Xe. Equation (2) is valid for temperatures T ≫ |γ| ħB0 / kB, a condition that is fulfilled for 83Kr at B0 = 9.4 T at ambient temperature since |γ| ħB0 / kB ≈ 10−3 K, and the thermal polarization is:
| [3] |
A SEOP signal enhancement of 9300 corresponds therefore to approximately 4.4 % spin polarization, a 2 fold improvement in spin polarization compared to previous work (Cleveland et al., 2008a). This improvement was likely achieved because of a 1.2 fold increase in laser power, better laser alignment, and predominately laser line narrowing (i.e 0.3 nm vs. 2 nm used previously). The enhancement was calculated by comparison of the hp signal to the signal of thermally polarized krypton at 10.430 MPa with 116 scans and 600 s delay time between scans resulting to a signal with a signal to noise ratio of 130. The same radio frequency coil, probe head, pulse duration, and power were used for both samples.
The 4.4 % spin polarization was obtained from a mixture of 25% krypton, 5% nitrogen, and 70% helium. Similar to 129Xe (Driehuys et al., 1996; Mortuza et al., 2003) and 131Xe (Stupic et al., 2011) higher polarization is expected from SEOP with more dilute krypton mixtures. However, the increase in signal caused by the increase in polarization is offset by the signal decrease from dilution. In the case of 129Xe, this concern is solved by separating the xenon from the other gases through a freeze-thaw cycle using liquid nitrogen. Unfortunately, the same method would severely depolarize the 83Kr hyperpolarized state due to fast 83Kr quadrupolar relaxation in the frozen state with T1 < 10 s at 77 K (Cowgill and Norberg, 1976). A 25% krypton mixture has been shown to be a good compromise (Cleveland et al., 2007) as long as practical hp 83Kr concentration techniques are not available. It should be noted that effectively less than 3% of the 83Kr isotope is present in the ‘hp-gas’ used in this work.
3.2 Testing of ex vivo hp 83Kr lung ventilation
Ventilation of the lungs with hp 83Kr was achieved through a custom build delivery system that is depicted in figure 1. Following polarization buildup in the SEOP cell for 10 – 20 min at 135 kPa pressure, hp 83Kr was delivered to a pre-evacuated (pressure < 10 Pa) 50 ml borosilicate glass syringe (Chemglass, Vineland, NJ) – i.e. injection syringe with variable storage volume VA - by pressure equalization as shown in figure 1(a). After delivery of approximately 40 ml of hp 83Kr into VA, the valve between VA and the SEOP cell (denoted as valve #1) was closed, while the valve (i.e. valve #3)) between the syringe VA and the transfer line with storage volume VB, was opened. This allowed for the controlled injection of hp 83Kr from the syringe VA into storage container VB (see figure 1(b)) while keeping the gas pressure approximately constant. Using this delivery method, a sudden pressure rise and therefore premature entry of hp 83Kr into the lung is prevented without the need for a valve in the high magnetic field detection region.
Any excess hp 83Kr delivered beyond the capacity of storage container VB (expandable from 6 ml to 30 ml) was exhausted to open air. The hp 83Kr was further transferred from VB into the lung using the ventilation syringe Vs as described in section (2.3). The ventilation system enabled the ex vivo lungs to actively inhale the gas. Active inhalation was preferred over passive inflation by a pressurized gas because it is a better way to prevent depolarization of the fast relaxing hp 83Kr. However, as an additional advantage, the active inhalation method more closely resembles the in vivo breathing process (i.e. through pleural pressure reduction) when compared to a forced inflation method using a pressurized gas.
Figure 2 shows a series of 32 individual MR spectra (without spatial encoding) that were recorded every 0.2 s using a 12° flip angle radiofrequency pulse before and during lung inhalation with hp 83Kr. During the initial 2 s no signal was visible, demonstrating that no amount of MR detectable hp 83Kr was forced into the lung during gas transfer from the injection syringe VA into storage container VB . The hp 83Kr is inhaled into the lung when a suction is applied to the ventilation chamber at t = -1.2 s. At approximately t = -0.6 s, the lungs are reaching the desired inhalation volume Vi. The 83Kr T1 relaxation reduces the observed signal as time progresses. At t = 0 s, the lungs are presumed to be static and lung movement no longer contributes to the temporal changes in the hp 83Kr signal. The behavior of the signal decay at t > 0s is discussed in the following section.
Figure 2.

Time resolved series of hp 83Kr MR spectra for an excised rat lung with Vi = 15 ml inhalation of 25% krypton in a mixture with helium/nitrogen (inhalation scheme 1). The MR signals were acquired from a series of 12° RF pulses evenly spaced every 0.2 s. No signal is initially visible, demonstrating that gas transfer into storage container VB does not lead to MR detectable amounts of hp 83Kr in the lung. As suction is applied to the outside of the lung and the lung inhales hp 83Kr, the MR signal becomes observable and starts to increase over time. The exact timing of the manually applied suction is not known but is also not needed for the analysis. Approximately coinciding with the end of the inhalation period, T1 relaxation leads to an observable decay in the T1 the signal over time. At t = 0 s, labeled with a diamond marker, lung movement no longer contributes to the change in signal intensity.
3.3. Determination of longitudinal 83Kr relaxation in lungs
No attempt was made to spatially resolve the relaxation measurements; however, higher 83Kr MR signal intensities may become available as a result of technological developments and/or a reduction in the prohibitively high costs for isotopically enriched 83Kr. Note that in this publication the wording ‘different zones of the lung’ refers solely to differences between the more proximal airways (the major conducting airways, i.e. trachea and bronchi), the more distal airways (the conducting airways at higher generation of branching, namely bronchioles), and the respiratory zones (i.e. the alveolar ducts and the alveolar sacs). The differentiation of these zones is intentionally kept coarse in order to allow for an initial interpretation of the results.
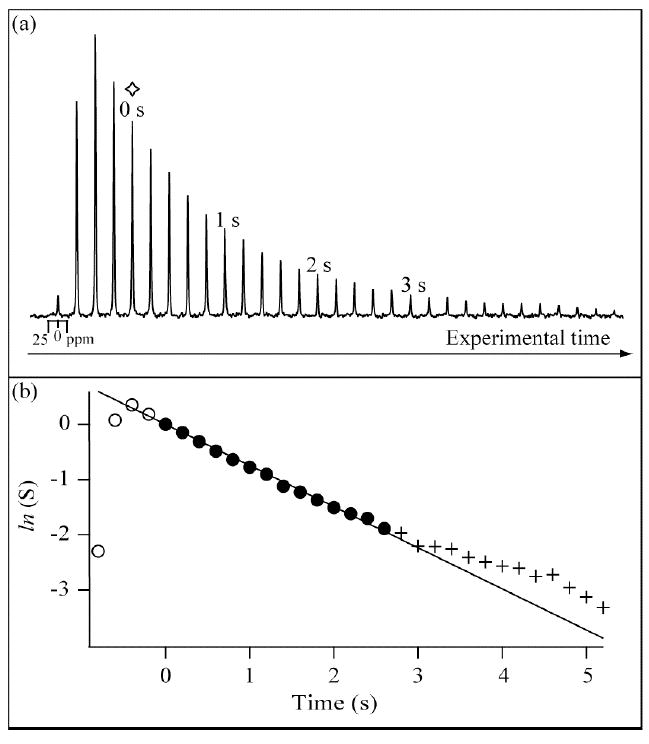
The hp 83Kr T1 times in lungs where obtained from a series of 32 spectra, separated each by 0.2 s, each following a 12° flip angle radiofrequency pulse as described in more detail in sections 2.4 and 3.2. In order to best measure the relaxation behavior, the series of MR scans were timed to commence approximately with the start of the inhalation process thus allowing the first few spectra to capture a part of the actual inhalation. The decay of the signal in the spectra during the “breath hold” that followed the inhalation provided the crucial data for determining the T1 relaxation time. A typical set of spectra, that is used for the relaxation measurements, is shown in figure 3(a) where the inhalation of 20 ml hp 83Kr by an excised rat lung is monitored. Figure 4(a) shows the inhalation of 6 ml hp 83Kr under otherwise identical conditions.
Figure 3.

Experimental data and fitting for a Vi = 20 ml lung inhalation of an excised rat lung with hp 83Kr using inhalation scheme 1 (25% krypton in helium/nitrogen; natural abundance 83Kr). (a) 0.2 s time resolved hp 83Kr MR signal intensity behavior found in ex vivo rat lung analogue to figure 2 but extending further out in time. The diamond marker, also marked at t = 0 s, is the time point where only T1 decay signal is observed during ‘breath hold’ without interference from lung movement. (b) Plot of the natural logarithm of the integrated intensity from the data shown in 3(a) versus time. Three time periods are labeled as follows: Data acquired prior to t = 0 s (open circle), data acquired at or after t = 0 s (closed circle), and data acquired 2.6 s after t = 0 s (crosses). Only data recorded between t = 0 to 2.6 s (solid circles) is fitted to a linear function with a correction factor for the polarization destroyed by the RF pulse to calculate the T1 value using equation (1).
Figure 4.
Experimental and fitting data for a Vi = 6 ml lung inhalation of an ex vivo rat lung (inhalation scheme 1) at conditions otherwise identical to those described for the experiment in figure 3 (all symbols and markings used as in figure 3).
In both experiments, the lung inhalation with hp 83Kr during the initial phase leads to a rapid increase in signal intensity observed in the spectral array until a maximum is reached. The occurrence of the signal maximum corresponds approximately to the point where the lungs have reached the selected inhalation volume Vi. Note that the maximum signal intensity does not necessarily coincide exactly with the end of the inhalation process because of insufficient (0.2 s) time resolution and also because of longitudinal relaxation during the inhalation phase. Therefore, data points used for the T1 fittings start two spectra after the maxima (corresponding to 0.4 s after the maximum signal intensity) when the signal intensities start to follow a mono-exponential decay behavior as can be visualized in the semi-logarithmic graphs in figures 3(b) and 4(b). After this experimental time point, labeled as t = 0 s and marked in figures 3(b) and 4(b) by a diamond marker, the changes in the hp 83Kr signal intensity are assumed to be caused by longitudinal relaxation (and perhaps by diffusion and convection – see arguments below) but not by changes in the lung volume.
Data used in the T1 fittings extended from t = 0 s to t = 2.6 s without considering spectra collected after 2.6 s. The 2.6 s cutoff was chosen to eliminate deviations from mono-exponential relaxation behavior as is apparent in the semi-logarithmic graphs. This deviation is likely caused by vastly different relaxation behavior between the relatively smaller respiratory zones and the larger airways. Depending on the inhalation level, a very high percentage of the signal intensity will initially arise from the smaller respiratory zones, in particular alveolar sacs and alveolar ducts but also by the nearby respiratory bronchioles with similar diameter as the alveoli and perhaps the distal airways such as the terminal bronchioles. Depending on the total ventilation volume, the respiratory zone accounts typically for more than 95 % of the lung volume. A single rate constant appears to be a good description of the hp 83Kr relaxation from this region (see fitted line in 3(b) and 4(b)). However, as time progressed, fast longitudinal relaxation in the high surface-to-volume ratio alveoli reduced the relative contribution of the hp 83Kr signal of this distal region compared to that of the proximal larger airways where the 83Kr T1 relaxation is slower. The relative contribution of the larger airways (with vastly different T1 values) to the signal intensity will therefore rise over time and the decay will no longer have the appearance of single exponential relaxation. This point appears to be reached at t = 2.6 s, a time that is slightly more than two times the T1 time of 83Kr in the alveolar space, when the alveolar signal has decayed to about one tenth or less of the original intensity. Further data analysis after t = 2.6 s is difficult because of low signal to noise ratios. (Depending on the inhalation volume, the initial signal to noise ratio, S/N, is between 189 and 75 at t = 0 s. The S/N drops to values between 12 and 4 at t = 2.6 s). Further, the hp 83Kr in the larger airways will contribute substantially to the signal after this time and is therefore expected to decay at various relaxation time constants depending on the diameter of the airway. The situation may be further complicated by the possibility of migration of hp 83Kr from the adapter tube were the 83Kr relaxation is relatively slow with T1 ≫ 1 s. Although the adapter tube is outside the MR detection region, diffusion and convection of hp 83Kr into the airways within the detection region may lead to an apparent slower 83Kr relaxation in the lungs. If present, this effect will be pronounced for longer experimental time scales.
3.5. Influence of different inhalation schemes
Previously, 83Kr T1 was shown to be inversely dependent on the surface-to-volume ratio, S/V, of porous systems (Stupic et al., 2006). The inverse dependence of 83Kr T1 times on the surface-to-volume should also affect the 83Kr T1 relaxation in various regions of the lungs. Three different inhalation schemes were developed as a way to, as well as is possible, discriminate hp 83Kr relaxation behavior in the larger airways from the relaxation in the alveoli and distal airways. The goal was to obtain first insights in 83Kr longitudinal relaxation in these regions.
In scheme 1, only hp 83Kr gas mixture was used for inhalation. This scheme was applied for the experiments in figures 2, 3 and 4. The outer glass tube of storage container VB had a volume of 6 ml but an additional fitted glass extension tube was available to expand the volume of stored hp 83Kr gas to VB = 30 ml. The extended storage container VB enabled the lungs to inhale up to Vi = 20 ml of hp 83Kr depending on the suction applied by the ventilation syringe. Inhalation volumes Vi > 20 ml would have likely exceeded the lung capacity and were not attempted.
Scheme 1 does not discriminate between major airways and alveoli because the inhaled hp 83Kr is present in the respiratory zone and the anatomical dead space (i.e. the airway encompasses all generations of branching down to the terminal bronchioles) as sketched in figure 5(a). The lung regions filled with hp 83Kr are depicted in light blue color (or light gray in black and white representation) and all regions contribute to the observed signal in this inhalation scheme. However, the airways contribute only to about 5 % of the total lung volume. As a consequence, relaxation initially appears to be mono-exponential but then deviates from this behavior as time passes as discussed in the previous section.
Figure 5.
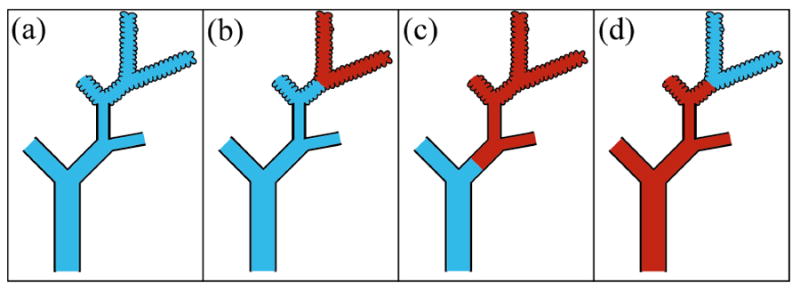
Sketch of gas distribution for hp 83Kr colored in blue (light gray in black and white representation) and thermal gas (non-hp gas) colored in red (dark gray) in a lung for the three different inhalation schemes. (a) Inhalation scheme 1: only hp 83Kr is inhaled, i.e. ; (b) inhalation scheme 2: of thermal gas inhaled followed by inhalation of hp 83Kr to reach the desired inhalation volume Vi ; (c) also inhalation scheme 2: of thermal gas inhaled followed by inhalation of hp 83Kr to reach the desired inhalation volume Vi ; (d) inhalation scheme 3: of hp 83Kr inhaled followed by inhalation of thermal gas to reach the desired Vi. The sketch of the lung loosely follows the architecture of the lung described by Weibel (Weibel, 2009).
Scheme 2 uses non-hp gas that is not detectable by the MR scanner at these experimental conditions, in combination with hp 83Kr. The non-hp gas is referred to in this publication as ‘thermal’ or ‘dark’ gas. In scheme 2, a determined volume of thermal gas was inhaled into the lungs prior to ventilation with hp 83Kr. Thermally polarized 83Kr, which does not produce a detectable MR signal under the conditions used in these experiments, can serve as dark gas. Normal air, which does not contribute at all to signals at the 83Kr frequency, can also be used (see section (3.8) on the effects of oxygen). Specifically, volumes of and of thermal gas were introduced into the lungs prior to the transfer of hp 83Kr into storage container VB. Subsequently, hp 83Kr was transferred into VB and a selected volume of 83Kr was inhaled. The total inhalation volume was therefore .
The rationale for inhalation scheme 2 is to keep hp 83Kr as much as possible in the proximal airways and not in the alveoli as sketched to different degrees in figures 5(b) and 5(c). In these sketches, dark gas (i.e. thermal gas with no appreciable MR signal) is symbolized by red color (dark gray in ‘black and white’ representation) while hp 83Kr is represented by light blue (light gray). The underlying assumption is that gas inhaled during the initial phase of the breath take is more likely to be found in the distal airway and alveoli region than gas inhaled during the later phase of the breath take. Admittedly, this assumption constitutes a simplified model of the breathing process that ignores that different lobes of the lung expand at different times in the breathing cycle and/or other complexities such as mixing that occur during inhalation. Furthermore, the presence of many surface-to-volume ratios at different generations of branching of the airways can not be quantified. Even in the simplified model, the largest contribution to the hp 83Kr signal will originate from the alveolar region of the lung due to the small total overall volume of the conducting airways, which typically contribute 5% or less to the overall lung volume (Fowler, 1948; Heller et al., 1999). Nevertheless, scheme 2 should direct hp 83Kr more towards the proximal airways than scheme 1 and scheme 2 is therefore expected to provide the slowest longitudinal relaxation.
As an example for data obtained from one lung specimen (N = 1), figure 6 shows a resulting set of decay curves for the three different inhalation schemes using a total inhalation volume of Vi = 20 ml. Two different volumes of thermal gas, and have been used with scheme 2. Figure 6 shows a tendency that is further confirmed when the averages of T1 values of lung specimens from 5 individual rats (N = 5) with at least two repeat measurements per specimen are taken. As reported in table 1, the slowest T1 time of 1.48 ± 0.07 s was indeed observed with scheme 2 using whereas T1 of 1.31 ± 0.05 s was observed for . By comparison, the data for Vi = 20 ml using scheme 1 with was T1 = 1.25 ± 0.07 s. The error values shown are one standard deviation of the calculated averaged value obtained from at least 10 T1 measurements. The data demonstrates the increase in the relaxation time with increasing ‘dark’ inhaled gas volume.
Figure 6.

Natural log of the integrated hp 83Kr signal intensities from an excised rat lung (from N = 1 animal) as a function of time and normalized to their values at t = 0 s (i.e. experimental number n = 0). Presented here are the results from four different inhalation schemes, each with a total inhalation volume of Vi = 20 ml. Inhalation scheme 1: only hp 83Kr is inhaled, i.e. (closed circles). Inhalation scheme 2: of thermal gas inhaled prior to of hp 83Kr (open triangles) and thermal gas inhaled prior to hp 83Kr (filled triangles). Inhalation scheme 3: of hp 83Kr inhaled prior to inhalation of of MR non-contributing gas (open circles). Each line is the result of a linear fitting and includes a compensation term for spin destruction by the applied 12° pulses. T1 values obtained from this fitting are presented in figure 7 and table 1.
Table 1.
Longitudinal relaxation times for ex vivo experiments using rat lungs at different inhalation volumes Vi and different inhalation schemes. T1 values are averages of T1 data of lung specimens from 5 individual rats with at least two repeat measurements per specimen. The error values shown are one standard deviation from the calculated averaged value obtained from the (at least) ten T1 measurements. (Note that the fittings were not error weighted by the signal to noise ratio of the spectra and the fitting accuracy was not considered for the error calculation. However, the fitting error of the individual T1 measurements is about one order of magnitude smaller than the standard deviation value between the individual T1 measurements. Examples of relaxation curves are shown in figure 6).
| Inhalation volume | Inhalation scheme 1 Only hp 83Kr gas | Inhalation scheme 2 thermal gas at start of inhalation followed by hp 83Kr | Inhalation scheme 2 thermal gas at start of inhalation followed by hp 83Kr | Inhalation scheme 3 hp 83Kr gas at start of inhalation followed by thermal (non-hp) gas |
|---|---|---|---|---|
| T1 [s] | T1 [s] | T1 [s] | T1 [s] | |
| 3 ml | 2.11 ± 0.75 | |||
| 6 ml | 1.57 ± 0.16 | |||
| 9 ml | 1.43 ± 0.10 | 2.00 ± 0.16 | 1.20 ± 0.13 | |
| 12 ml | 1.31 ± 0.08 | 1.57 ± 0.07 | 1.07 ± 0.08 | |
| 15 ml | 1.29 ± 0.12 | 1.42 ± 0.09 | 2.19 ± 0.29 | 1.01 ± 0.09 |
| 18 ml | 1.28 ± 0.08 | 1.36 ± 0.05 | 1.58 ± 0.08 | 1.01 ± 0.07 |
| 20 ml | 1.25 ± 0.07 | 1.31 ± 0.05 | 1.48 ± 0.07 | 1.00 ± 0.08 |
| 20 ml (20% O2)a | 1.25 ± 0.01 | |||
| 20 ml (40% O2)b | 1.22 ± 0.01 | |||
The measurements with 20% and 40% oxygen were limited to 1 rat lung specimen (total) with three and two repeat measurements respectively.
Scheme 3 used an initial inhalation of hp 83Kr gas immediately followed by inhalation of thermal gas until the selected total inhalation volume Vi was reached. In this case, the transfer of dark gas had to occur rapidly after the hp 83Kr inhalation in order to minimize polarization losses through fast 83Kr relaxation in the lungs. This was accomplished by transferring hp 83Kr into the minimum possible storage volume of VB = 6 ml (i.e. with glass extension tubes removed from storage container VB). The lungs were then inflated using suction with the ventilation syringe to achieve the final inhalation volume . Assuming relatively little gas mixing in the narrow tube of storage container VB during the approximately 1 s inhalation period, any gas inhaled beyond would be largely thermal gas that enters storage container VB through its exhaust opening to the ambient atmosphere (figure 1).
Using analogous arguments to those presented for scheme 2, the procedure of scheme 3 should direct hp 83Kr towards the respiratory zones and the distal airways as opposed to the larger proximal airways (figure 5(d)). As a consequence, the already weak hp 83Kr signal from the relatively small volume of the proximal airways would be further suppressed at moderate inhalation volumes. Even the relative signal contribution from the distal airways is probably reduced compared to that from the alveoli. This assumption is supported by the observation that the steepest slope occurs for scheme 3, as shown in figure 6. Scheme 3 leads to an averaged relaxation time of T1 = 1.00 ± 0.08 s for Vi = 20 ml (see table 1).
3.6. Longitudinal relaxation times in lungs as a function of lung inhalation
The inhalation schemes discussed in the previous section were applied to a series of inhalation volumes ranging from Vi = 3 to Vi = 20 ml in rat lungs. The resulting T1 times are presented as a function of Vi in figure 7 and numerically in table 1. Each relaxation time is the average of measurements from lung specimen of five individual rats and of at least two T1 fittings per inhalation volume and specimen. The relatively small deviation in the relaxation data obtained from lungs of different individual rats (similar age and weight, 3 months old and 350-425 g, respectively) substantiates the generality of the results. One trend discussed in context with figure 6 is observed for all inhalation volumes: Scheme 2 provides the longest T1 values for a chosen total inhalation volume Vi, followed by scheme 1, while the shortest T1 times are found for scheme 3.
Figure 7.

Average longitudinal relaxation times as a function of inhalation volume for different inhalation schemes using the corresponding symbols from figure 6 (i.e. inhalation scheme 1 (closed circles); inhalation scheme 2 with prior to inhalatiom (open triangles); inhalation scheme 2 with prior to inhalation (filled triangles); and inhalation scheme 3 with prior to inhalation of (open circles)). The dashed line used for scheme 3 was extended to the lower inhalation volumes of scheme 1 as a reference. The T1 values are presented in table 1 and are averages from T1 data of lung specimens from 5 individual rats (N = 5) with at least two repeat measurements per specimen. The error values are one standard deviation from the calculated averaged value.
As the inhalation volume increases for all inhalation schemes, T1 times become either shorter or remain constant. A statistically significant slowing of the relaxation with increasing Vi is never observed. The T1 times found with inhalations in scheme 2 decrease monotonically with increasing Vi over the measured range. The relaxation time decrease is more pronounced for than for This indicates that the contribution from the slow relaxing signal of the larger airways to the overall signal cannot be neglected at any inhalation volume Vi for scheme 2.
Experiments using scheme 3 were designed to suppress the hp 83Kr signals from the larger airway and therefore to obtain the T1 times of 83Kr in respiratory zones. Scheme 3 was performed with total inhalation volumes Vi ranging from 9 to 20 ml. As with scheme 1, the T1 times with scheme 3 decrease and eventually stabilize at about 12 ml total inhalation volume Vi . While some mixing may have occurred in the inhalation process, the hp 83Kr gas at high Vi is expected to be more confined to the respiratory zones and the distal airways such as bronchioles and smaller bronchia. This assumption is supported by the measurements with scheme 3 that resulted to T1 ≈ 1.0 s for Vi ≥ 12ml. This value is significantly shorter than the corresponding value of T1 ≈ 1.3 s obtained with scheme 1 for Vi ≥ 12ml.
3.7. Consequences for models of alveolar recruitment
The complete absence of an increase in 83Kr T1 times with increasing lung inhalation in the distal part of the lung warrants consideration. This observation is reminiscent to the finding that inhalation volume independent ADC is observed in diffusion measurement with 3He in lungs (see for instance (Gierada et al., 2009) However, ADC is determined on much shorter timescales, typically 1 – 3 ms, and the hp gas probes therefore a much smaller region (Yablonskiy et al., 2002) than the relaxation measurements of 2.6 s duration reported here. Note that a free diffusing gas of similar composition would display centimeter-sized mean displacements during the 2.6 s time period, as estimated from D = 0.63 cm2s−1 for diffusion of krypton in helium and D = 0.15 cm2s−1 for diffusion of krypton in nitrogen at 293 K (Lide, 2001). The inhalation volume independent 83Kr T1 times in the more distal part of the airways indicate constant surface to volume ratio in the area probed by the krypton atoms (Stupic et al., 2006). This finding is somewhat unexpected since the surface, S, to volume, V, ratio (S/V) of the lung should decrease with increasing inhalation volume, assuming the S/V of the alevoli behave similar to an expanding balloon or sphere where V ∝ r3 and S ∝ r2. However an apparently constant surface to volume ratio observed through hp 83Kr MR could be explained by rapid recruitment of alveolar regions into the inflated state of constant surface to volume ratio without further changes during continuing inhalation. Although the surface to volume ratio of the lung should decrease with increasing inhalation (based again on the underlying assumption of an expanding sphere model), the hp 83Kr MR signal originates only from inflated alveoli that are already expanded to their final surface to volume ratio. Alveoli that are not yet inflated are still void of hp 83Kr and cannot contribute to the MR signal.
Following this assumption, the gradual process of inhalation might be a consequence of many different alveolar regions expanding rapidly but at different times rather than of a gradual, continuously ongoing alveolar expansion. The size of these regions could range from macroscopic areas of the lung lobes down to small groups of individual alveoli. Arguments based on surface tension would also support the uniform expansion of neighboring alveoli with common water / surfactant surface layers (Escolar and Escolar, 2004). Alternatively, the underlying assumption that the S/V of expanding alveoli behave similar to that of expanding (micro) spheres maybe wrong. Whatever cause will ultimately be identified to be responsible for the inhalation volume independence of the 83Kr T1 relaxation, it leads to easily reproducible 83Kr relaxation measurements that may facilitate future diagnosis of damaged lungs for which analysis of T1 times may provide a biomarker.
3.8. 83Kr T1 times in rat lungs using breathable hp 83Kr mixtures with oxygen
Molecular oxygen in breathable noble gas mixtures causes paramagnetic relaxation of the noble gas nuclei. For instance, the longitudinal relaxation time of 129Xe is reduced from hours (or even days in the case of 3He) to 10 - 20 s in the presence of 20% oxygen (Jameson et al., 1988; Saam et al., 1995; Moller et al., 2002). However, the T1 time of a nuclear spin I caused by intermolecular paramagnetic relaxation is dependent on the square of the gyromagnetic ratio γ of this nuclear spin (Abragam, 1961).
| [4] |
A 50 fold reduced paramagnetic relaxation rate, , for 83Kr compared to 129Xe (Cleveland et al., 2008b) is therefore suggested by the different gyromagnetic ratios: . However, the relaxation also follows a dependence, with r as the distance of the nuclei from the paramagnetic spins during the noble gas – oxygen interaction. The distance, r, can be estimated by the van der Waals radii of the noble gas atoms, resulting to the ratio . Further factors are the different rates for binary gas phase collision and, if present, the different lifetimes for noble gas – oxygen van der Waals complexes. However, it is unlikely that these factors will offset the dominating influence originating from the large difference in gyromagnetic ratios (note that ). Therefore, the low gyromagnetic ratio of 83Kr (4% of that of 1H) provides a distinct advantage in preserving hyperpolarization in the presence of oxygen. This advantage can of course only be utilized if the inherently low signal intensity with such low γ value is sufficiently boosted through hyperpolarization.
The effect of oxygen upon 83Kr relaxation in rat lungs was studied by inhaling 18 ml of a mixture of hp 83Kr with molecular oxygen using inhalation scheme 1. After oxygen delivery using the injection syringe VA, hp 83Kr was added and a 10 s delay allowed for the mixing of the two gases within the 27 mm inner diameter syringe. The gas mixture was then transferred into storage container VB where it was available for inhalation by the lung. The relaxation time of 83Kr in a mixture with 20% oxygen was 1.25 ± 0.01 s in three replicate measurements with a single lung specimen. Increasing the oxygen concentration to 40%, the T1 value was 1.22 ± 0.01 s from two replicate measurements with the same specimen. The T1 times obtained with both oxygen mixtures are within the error of T1 = 1.25 ± 0.07 s recorded in the absence of oxygen under otherwise identical conditions. Thus, the presence of oxygen in a breathable gas mixture has no appreciable effect on 83Kr T1 in the rat lungs. A 20% oxygen mixture leads, however, to an approximately 25% reduction in the MR signal because of the reduced hp 83Kr concentration and the relaxation during the 10 s mixing phase before inhalation.
4. Conclusions
Alkali metal vapor free hp 83Kr with 4.4 % spin polarization was generated in a mixture of 25 % krypton in helium and nitrogen. The resulting hp 83Kr MR signal intensity was sufficient despite the natural abundance of krypton gas with only 11.5 % 83Kr and the experimental 4-fold dilution in the gas mixture. A custom built hp-gas delivery system and a ventilation chamber allowed for hp 83Kr to be actively inhaled ex vivo by isolated rat lungs. The 83Kr T1 times in the rat lungs ranged from 1.0 to 2.2 s depending on the lung inhalation volume and the applied inhalation scheme.
The 83Kr T1 relaxation accelerated with increasing lung inhalation volume when the inhalation scheme did not suppress the hp 83Kr signal from the proximal airway region. This effect was attributed to the change in the relative contribution of the slower relaxing hp 83Kr in proximal airways compared to the faster relaxing hp 83Kr in distal airways. With higher inhalation volume, this ratio shifted towards the hp 83Kr signal in the alveolar region and thus the apparent relaxation time was shorter.
The hp 83Kr relaxation times were independent of the inhalation volume if the signal from the proximal airways was largely suppressed through usage of an inhalation schemes that directed hp 83Kr towards the distal airways. Depending on the degree of hp 83Kr direction towards the distal airways, the inhalation volume independent relaxation times was T1 = 1.3 s (scheme 1) and T1 = 1.0 s (scheme 3).
At least three aspects of this observation merit further consideration: (1) The observed T1 times in rat lungs were long enough for in vivo usage of hp 83Kr MRI since rats typically breathe at a rate of 1 to 5 times per second. (2) The inhalation volume independent hp 83Kr T1 relaxation in the distal airways allowed for reproducible measurements. This may be useful for diagnostic studies if pulmonary diseases affect the 83Kr T1 times. This possibility is further strengthened by the observation of very little deviation in the 83Kr T1 times between different lung specimens. (3) The inhalation volume independent hp 83Kr T1 relaxation suggests a constant, inhalation level independent surface to volume ratio in the alveolar region. This preliminary finding supports alveolar recruitment models that postulate a rapid inflation of individual alveolar regions into an expanded state rather than a slow expansion throughout the breathing process.
Finally, the quadrupolar driven T1 relaxation of 83Kr in the rat lungs was not affected by the presence of up to 40% oxygen. This finding may further facilitate future use of hp 83Kr for pulmonary studies in vivo.
Acknowledgments
The authors wish to thank Michael Olsen, Tom Frederick, and James Shorkey for construction specialized glassware and equipment used in these experiment, as well as Paul Wilson for assisting with animal care and usage, Dr. Elias Haddad, Charlene Horton-Garcia, and Theresa Denison for assisting with relaxation experiments and Dr. Michael Barlow for discussions regarding line-narrowed laser systems. This material was based upon work supported by the National Science Foundation under Grant No. CHE-0719423, NIH-RO-1 25324 (Repine), and by the Medical Research Council under Grant No. G0900785.
References
- Abragam A. The Principles of Nuclear Magnetism. Oxford, UK: Oxford University Press; 1961. [Google Scholar]
- Albert MS, Cates GD, Driehuys B, Happer W, Saam B, Springer CS, Wishnia A. Biological Magnetic-Resonance-Imaging Using Laser Polarized Xe-129. Nature. 1994;370:199–201. doi: 10.1038/370199a0. [DOI] [PubMed] [Google Scholar]
- Altes TA, Mata J, de Lange EE, Brookeman JR, Mugler JP. Assessment of lung development using hyperpolarized helium-3 diffusion MR imaging. J Magn Reson Imaging. 2006;24:1277–83. doi: 10.1002/jmri.20723. [DOI] [PubMed] [Google Scholar]
- Altes TA, Powers PL, Knight-Scott J, Rakes G, Platts-Mills TAE, de Lange EE, Alford BA, Mugler JP, Brookeman JR. Hyperpolarized He-3 MR lung ventilation imaging in asthmatics: Preliminary findings. J Magn Reson Imaging. 2001;13:378–84. doi: 10.1002/jmri.1054. [DOI] [PubMed] [Google Scholar]
- Brinkmann D, Kuhn D. Nuclear Magnetic-Relaxation of Kr-83 in Krypton Gas. Physical Review A. 1980;21:163–7. [Google Scholar]
- Cherubini A, Bifone A. Hyperpolarised xenon in biology. Progress in Nuclear Magnetic Resonance Spectroscopy. 2003;42:1–30. [Google Scholar]
- Cieslar K, Stupar V, Canet-Soulas E, Gaillard S, Cremillieux Y. Alveolar oxygen partial pressure and oxygen depletion rate mapping in rats using He-3 ventilation imaging. Magnetic Resonance in Medicine. 2007;57:423–30. doi: 10.1002/mrm.21110. [DOI] [PubMed] [Google Scholar]
- Cleveland ZI, Cofer GP, Metz G, Beaver D, Nouls J, Kaushik SS, Kraft M, Wolber J, Kelly KT, McAdams HP, Driehuys B. Hyperpolarized Xe-129 MR Imaging of Alveolar Gas Uptake in Humans. Plos One. 2010;5 doi: 10.1371/journal.pone.0012192. [DOI] [PMC free article] [PubMed] [Google Scholar]
- Cleveland ZI, Meersmann T. Binary-collision-induced longitudinal relaxation in gas-phase Kr-83. Journal of Chemical Physics. 2008a;129:244304. doi: 10.1063/1.3029663. [DOI] [PubMed] [Google Scholar]
- Cleveland ZI, Meersmann T. Density-independent contributions to longitudinal relaxation in Kr-83. Chemphyschem. 2008b;9:1375–9. doi: 10.1002/cphc.200800134. [DOI] [PubMed] [Google Scholar]
- Cleveland ZI, Moller HE, Hedlund LW, Driehuys B. Continuously Infusing Hyperpolarized Xe-129 into Flowing Aqueous Solutions Using Hydrophobic Gas Exchange Membranes. Journal of Physical Chemistry B. 2009;113:12489–99. doi: 10.1021/jp9049582. [DOI] [PMC free article] [PubMed] [Google Scholar]
- Cleveland ZI, Pavlovskaya GE, Elkins ND, Stupic KF, Repine JE, Meersmann T. Hyperpolarized Kr-83 MRI of lungs. Journal of Magnetic Resonance. 2008a;195:232–7. doi: 10.1016/j.jmr.2008.09.020. [DOI] [PubMed] [Google Scholar]
- Cleveland ZI, Pavlovskaya GE, Stupic KF, LeNoir CF, Meersmann T. Exploring hyperpolarized 83Kr by remotely detected NMR relaxometry. Journal of Chemical Physics. 2006;124:044312. doi: 10.1063/1.2159493. [DOI] [PubMed] [Google Scholar]
- Cleveland ZI, Pavlovskaya GE, Stupic KF, Wooten JB, Repine JE, Meersmann T. Detection of Tobacco Smoke Deposition by Hyperpolarized Krypton-83 MRI. Magnetic Resonance Imaging. 2008b;26:270–8. doi: 10.1016/j.mri.2007.06.009. [DOI] [PubMed] [Google Scholar]
- Cleveland ZI, Stupic KF, Pavlovskaya GE, Repine JE, Wooten JB, Meersmann T. Hyperpolarized Kr-83 and Xe-129 NMR relaxation measurements of hydrated surfaces: Implications for materials science and pulmonary diagnostics. Journal of the American Chemical Society. 2007;129:1784–92. doi: 10.1021/ja065994t. [DOI] [PubMed] [Google Scholar]
- Cowgill DF, Norberg RE. Pulsed Nmr-Studies of Self-Diffusion and Defect Structure in Liquid and Solid Krypton. Physical Review B. 1976;13:2773–81. [Google Scholar]
- de Lange EE, Mugler JP, Brookeman JR, Knight-Scott J, Truwit JD, Teates CD, Daniel TM, Bogorad PL, Cates GD. Lung air spaces: MR imaging evaluation with hyperpolarized He-3 gas. Radiology. 1999;210:851–7. doi: 10.1148/radiology.210.3.r99fe08851. [DOI] [PubMed] [Google Scholar]
- Driehuys B, Cates GD, Miron E, Sauer K, Walter DK, Happer W. High-volume production of laser-polarized Xe-129. Applied Physics Letters. 1996;69:1668–70. [Google Scholar]
- Driehuys B, Cofer GP, Pollaro J, Mackel JB, Hedlund LW, Johnson GA. Imaging alveolar-capillary gas transfer using hyperpolarized Xe-129 MRI. Proceedings of the National Academy of Sciences of the United States of America. 2006;103:18278–83. doi: 10.1073/pnas.0608458103. [DOI] [PMC free article] [PubMed] [Google Scholar]
- Driehuys B, Moller HE, Cleveland ZI, Pollaro J, Hedlund LW. Pulmonary Perfusion and Xenon Gas Exchange in Rats: MR Imaging with Intravenous Injection of Hyperpolarized Xe-129. Radiology. 2009;252:386–93. doi: 10.1148/radiol.2522081550. [DOI] [PMC free article] [PubMed] [Google Scholar]
- Escolar JD, Escolar A. Lung histeresis: a morphological view. Histol Histopath. 2004;19:159–66. doi: 10.14670/HH-19.159. [DOI] [PubMed] [Google Scholar]
- Fain SB, Altes TA, Panth SR, Evans MD, Waters B, Mugler JP, Korosec FR, Grist TM, Silverman M, Salerno M, Owers-Bradley J. Detection of age-dependent changes in healthy adult lungs with diffusion-weighted He-3 MRI. Academic Radiology. 2005;12:1385–93. doi: 10.1016/j.acra.2005.08.005. [DOI] [PubMed] [Google Scholar]
- Fischer MC, Kadlecek S, Yu JS, Ishii M, Emami K, Vahdat V, Lipson DA, Rizi RR. Measurements of regional alveolar oxygen pressure using hyperpolarized He-3 MRI. Academic Radiology. 2005;12:1430–9. doi: 10.1016/j.acra.2005.07.007. [DOI] [PubMed] [Google Scholar]
- Fowler WS. Lung Function Studies .2. the Respiratory Dead Space. Americam Journal of Physiology. 1948;154:405–16. doi: 10.1152/ajplegacy.1948.154.3.405. [DOI] [PubMed] [Google Scholar]
- Gao JH, Lemen L, Xiong JH, Patyal B, Fox PT. Magnetization and diffusion effects in NMR imaging of hyperpolarized substances. Magnetic Resonance in Medicine. 1997;37:153–8. doi: 10.1002/mrm.1910370123. [DOI] [PubMed] [Google Scholar]
- Gierada DS, Woods JC, Bierhals AJ, Bartel ST, Ritter JH, Choong CK, Das NA, Hong C, Pilgram TK, Chang YV, Jacob RE, Hogg JC, Battafarano RJ, Cooper JD, Meyers BF, Patterson GA, Yablonskiy DA, Conradi MS. Effects of Diffusion Time on Short-Range Hyperpolarized He-3 Diffusivity Measurements in Emphysema. J Magn Reson Imaging. 2009;30:801–8. doi: 10.1002/jmri.21912. [DOI] [PMC free article] [PubMed] [Google Scholar]
- Goodson BM. Nuclear magnetic resonance of laser-polarized noble gases in molecules, materials, and organisms. Journal of Magnetic Resonance. 2002;155:157–216. doi: 10.1006/jmre.2001.2341. [DOI] [PubMed] [Google Scholar]
- Heller H, Konen-Bergmann M, Schuster KD. An algebraic solution to dead space determination according to Fowler’s graphical method. Computers and Biomedical Research. 1999;32:161–7. doi: 10.1006/cbmr.1998.1504. [DOI] [PubMed] [Google Scholar]
- Hilty C, Lowery TJ, Wemmer DE, Pines A. Spectrally resolved magnetic resonance imaging of a xenon biosensor. Angewandte Chemie-International Edition. 2006;45:70–3. doi: 10.1002/anie.200502693. [DOI] [PubMed] [Google Scholar]
- Jameson CJ, Jameson AK, Hwang JK. NUCLEAR-SPIN RELAXATION BY INTERMOLECULAR MAGNETIC DIPOLE COUPLING IN THE GAS-PHASE - XE-129 IN OXYGEN. Journal of Chemical Physics. 1988;89:4074–81. [Google Scholar]
- Lide DR, editor. CRC Handbook of Chemistry and Physics. Boca Raton, FL: CRC Press; 2001. [Google Scholar]
- Lutey BA, Lefrak SS, Woods JC, Tanoli T, Quirk JD, Bashir A, Yablonskiy DA, Conradi MS, Bartel ST, Pilgram TK, Cooper JD, Gierada DS. Hyperpolarized He-3 MR imaging: Physiologic monitoring observations and safety considerations in 100 consecutive subjects. Radiology. 2008;248:655–61. doi: 10.1148/radiol.2482071838. [DOI] [PMC free article] [PubMed] [Google Scholar]
- Middleton H, Black RD, Saam B, Cates GD, Cofer GP, Guenther R, Happer W, Hedlund LW, Johnson GA, Juvan K, Swartz J. Mr-Imaging with Hyperpolarized He-3 Gas. Magnetic Resonance in Medicine. 1995;33:271–5. doi: 10.1002/mrm.1910330219. [DOI] [PubMed] [Google Scholar]
- Moller HE, Chen XJ, Saam B, Hagspiel KD, Johnson GA, Altes TA, de Lange EE, Kauczor HU. MRI of the lungs using hyperpolarized noble gases. Magnetic Resonance in Medicine. 2002;47:1029–51. doi: 10.1002/mrm.10173. [DOI] [PubMed] [Google Scholar]
- Mortuza MG, Anala S, Pavlovskaya GE, Dieken TJ, Meersmann T. Spin-exchange optical pumping of high-density xenon-129. Journal of Chemical Physics. 2003;118:1581–4. [Google Scholar]
- Pavlovskaya GE, Cleveland ZI, Stupic KF, Meersmann T. Hyperpolarized Krypton-83 as a New Contrast Agent for Magnetic Resonance Imaging. Proceedings of the National Academy of Sciences of the United States of America. 2005;102:18275–9. doi: 10.1073/pnas.0509419102. [DOI] [PMC free article] [PubMed] [Google Scholar]
- Peces-Barba G, Ruiz-Cabello J, Cremillieux Y, Rodriguez I, Dupuich D, Callot V, Ortega M, Arbo MLR, Cortijo M, Gonzalez-Mangado N. Helium-3 MRI diffusion coefficient: correlation to morphometry in a model of mild emphysema. European Respiratory Journal. 2003;22:14–9. doi: 10.1183/09031936.03.00084402. [DOI] [PubMed] [Google Scholar]
- Ruppert K, Brookeman JR, Hagspiel KD, Mugler JP. Probing lung physiology with xenon polarization transfer contrast (XTC) Magnetic Resonance in Medicine. 2000;44:349–57. doi: 10.1002/1522-2594(200009)44:3<349::aid-mrm2>3.0.co;2-j. [DOI] [PubMed] [Google Scholar]
- Ruppert K, Mata JF, Wang HTJ, Tobias WA, Cates GD, Brookeman JR, Hagspiel KD, Mugler JP. XTC MRI: Sensitivity improvement through parameter optimization. Magnetic Resonance in Medicine. 2007;57:1099–109. doi: 10.1002/mrm.21241. [DOI] [PubMed] [Google Scholar]
- Saam B, Happer W, Middleton H. Nuclear-Relaxation of He-3 in the Presence of O-2. Physical Review A. 1995;52:862–5. doi: 10.1103/physreva.52.862. [DOI] [PubMed] [Google Scholar]
- Samee S, Altes T, Powers P, de Lange EE, Knight-Scott J, Rakes G, Mugler JP, Ciambotti JM, Alford BA, Brookeman JR, Platts-Mills TAE. Imaging the lungs in asthmatic patients by using hyperpolarized helium-3 magnetic resonance: Assessment of response to methacholine and exercise challenge. Journal of Allergy and Clinical Immunology. 2003;111:1205–11. doi: 10.1067/mai.2003.1544. [DOI] [PubMed] [Google Scholar]
- Santyr GE, Lam WW, Parra-Robles JM, Taves TM, Ouriadov AV. Hyperpolarized noble gas magnetic resonance imaging of the animal lung: Approaches and applications. Journal of Applied Physics. 2009;105 [Google Scholar]
- Schroder L, Lowery TJ, Hilty C, Wemmer DE, Pines A. Molecular imaging using a targeted magnetic resonance hyperpolarized biosensor. Science. 2006;314:446–9. doi: 10.1126/science.1131847. [DOI] [PubMed] [Google Scholar]
- Stupic KF, Cleveland ZI, Pavlovskaya GE, Meersmann T. Quadrupolar Relaxation of Hyperpolarized Krypton-83 as a Probe for Surfaces. Solid State Nuclear Magnetic Resonance. 2006;29:79–84. doi: 10.1016/j.ssnmr.2005.08.008. [DOI] [PubMed] [Google Scholar]
- Stupic KF, Cleveland ZI, Pavlovskaya GE, Meersmann T. Hyperpolarized Xe-131 NMR spectroscopy. Journal of Magnetic Resonance. 2011;208:58–69. doi: 10.1016/j.jmr.2010.10.004. [DOI] [PMC free article] [PubMed] [Google Scholar]
- Tustison NJ, Altes TA, Song G, de Lange EE, Mugler JP, Gee JC. Feature Analysis of Hyperpolarized Helium-3 Pulmonary MRI: A Study of Asthmatics Versus Nonasthmatics. Magnetic Resonance in Medicine. 2010;63:1448–55. doi: 10.1002/mrm.22390. [DOI] [PubMed] [Google Scholar]
- van Beek EJR, Dahmen AM, Stavngaard T, Gast KK, Heussel CP, Krummenauer F, Schmiedeskamp J, Wild JM, Sogaard LV, Morbach AE, Schreiber LM, Kauczor HU. Hyperpolarised He-3 MRI versus HRCT in COPD and normal volunteers: PHIL trial. European Respiratory Journal. 2009;34:1311–21. doi: 10.1183/09031936.00138508. [DOI] [PubMed] [Google Scholar]
- Walker TG, Happer W. Spin-exchange optical pumping of noble-gas nuclei. Review of Modern Physics. 1997;69:629–42. [Google Scholar]
- Weibel ER. What makes a good lung? The morphometric basis of lung function. Swiss Med Wkly. 2009;139:375–86. doi: 10.4414/smw.2009.12270. [DOI] [PubMed] [Google Scholar]
- Woods JC, Choong CK, Yablonskiy DA, Bentley J, Wong J, Pierce JA, Cooper JD, Macklem PT, Conradi MS, Hogg JC. Hyperpolarized He-3 diffusion MRI and histology in pulmonary emphysema. Magnetic Resonance in Medicine. 2006;56:1293–300. doi: 10.1002/mrm.21076. [DOI] [PMC free article] [PubMed] [Google Scholar]
- Wu Z, Happer W, Kitano M, Daniels J. Experimental Studies of Wall Interactions of Adsorbed Spin-Polarized Xe-131 Nuclei. Physical Review A. 1990;42:2774–84. doi: 10.1103/physreva.42.2774. [DOI] [PubMed] [Google Scholar]
- Yablonskiy DA, Sukstanskii AL, Leawoods JC, Gierada DS, Bretthorst GL, Lefrak SS, Cooper JD, Conradi MS. Quantitative in vivo assessment of lung microstructure at the alveolar level with hyperpolarized He-3 diffusion MRI. Proceeding of the National Academy of Sciences of the United States of America. 2002;99 doi: 10.1073/pnas.052594699. [DOI] [PMC free article] [PubMed] [Google Scholar]
- Yu J, Ishii M, Law M, Woodburn JM, Emami K, Kadlecek S, Vahdat V, Guyer RA, Rizi RR. Optimization of scan parameters in pulmonary partial pressure oxygen measurement by hyperpolarized He-3 MRI. Magnetic Resonance in Medicine. 2008;59:124–31. doi: 10.1002/mrm.21416. [DOI] [PubMed] [Google Scholar]