Abstract
The combination of lopinavir (LPV) and ritonavir (RTV) is one of the preferred regimens for the treatment of HIV infection with confirmed efficacy and relatively low toxicity. LPV alone suffers the poor bioavailability due to its rapid and extensive metabolism. RTV boosts the plasma concentration of LPV by suppressing its metabolism and thus increasing LPV efficacy. In the current study, we found that RTV also inhibits LPV bioactivation. LPV bioactivation was investigated in human liver microsomes and cDNA-expressed human cytochromes P450. Twelve GSH-trapped reactive metabolites of LPV were identified by using a metabolomic approach. Semicarbazide-trapped reactive metabolites of LPV were also detected. RTV effectively suppressed all pathways of LPV bioactivation via CYP3A4 inhibition. Our data together with previous reports suggest that LPV plus RTV is an ideal combination because RTV not only boosts LPV plasma concentration, but it decreases LPV bioactivation.
Introduction
Lopinavir (LPV) is an HIV protease inhibitor (PI) (Sham et al., 1998; Hurst and Faulds, 2000). Because of the rapid metabolism of LPV by cytochrome P450 3A (CYP3A), LPV bioavailability is very low (Kumar et al., 1999a; ter Heine et al., 2011). In clinical practice, LPV is coadministered with ritonavir (RTV), a PI that strongly inhibits CYP3A4 activity, to increase LPV plasma concentration and efficacy (Cvetkovic and Goa, 2003; Kumar et al., 2004; Oldfield and Plosker, 2006). In healthy volunteers, the maximum plasma concentration of LPV was shown to be ∼0.1 mg/ml after a single dose of 400 mg of LPV. In contrast, coadministration of 400 mg of LPV with 50 mg of RTV increased the maximum plasma concentration of LPV to 5.5 mg/ml (Sham et al., 1998). At present, the RTV-boosted LPV (LPV/r) regimen is the only coformulated PI available that is approved by the U.S. Food and Drug Administration for the treatment of HIV infection in both adults and children (Croxtall and Perry, 2010).
The LPV/r regimen is generally well tolerated (Murphy et al., 2008; Gathe et al., 2009). For example, the incidence of severe liver events was relatively low in HIV patients receiving LPV/r (Bonfanti et al., 2005; Palacios et al., 2006). However, lead-in treatment with rifampicin significantly increased hepatotoxicity associated with LPV/r (Nijland et al., 2008). Rifampicin is a potent CYP3A inducer (Kolars et al., 1992), which may accelerate LPV and/or RTV bioactivation and result in liver injury. LPV is known to be metabolized by CYP3A (Kumar et al., 1999b, 2004). Nevertheless, no information of LPV bioactivation is available. In a previous study, a mechanism-based inactivation of CYP3A4 by LPV has been reported (Ernest et al., 2005). Mechanism-based P450 inactivation usually involves bioactivation of the drug to reactive intermediate(s), which covalently modify active site(s) of the cytochrome P450 (P450) (Kalgutkar et al., 2007). These previous reports suggest that LPV bioactivation is likely occurring.
The current study was designed to investigate LPV bioactivation and examine the effect of RTV on LPV bioactivation. We identified GSH-trapped and semicarbazide-trapped reactive metabolites of LPV. RTV effectively inhibited all pathways of LPV bioactivation that are primarily mediated by CYP3A4.
Materials and Methods
Materials.
LPV [(2S)-N-[(2S,4S,5S)-5-[2-(2,6-dimethylphenoxy)acetamido]-4-hydroxy-1,6 diphenylhexan-2-yl]-3-methyl-2-(2-oxo-1,3-diazinan-1-yl)butanamide)] and RTV (1,3-thiazol-5-ylmethyl N-[(2S,3S,5S)-3-hydroxy-5-[(2S)-3-methyl-2-{[methyl({[2-(propan-2-yl)-1,3-thiazol-4-yl]methyl})carbamoyl]amino}butanamido]-1,6-diphenylhexan-2-yl]carbamate) were supplied by the National Institutes of Health AIDS Research and Reference Reagent Program (Bethesda, MD). The recombinant human P450s and human liver microsomes (HLM) were purchased from XenoTech, LLC (Lenexa, KS). GSH, 2,6-dimethylphenol (DMP), semicarbazide, and NADPH were obtained from Sigma-Aldrich (St. Louis, MO). All of the solvents for liquid chromatography and mass spectrometry were of the highest grade commercially available.
LPV Bioactivation.
LPV bioactivation was investigated in HLM and cDNA-expressed human P450s. GSH and semicarbazide were used as trapping reagents to confirm the existence of reactive metabolites of LPV. The incubation was conducted in 100 mM phosphate-buffered saline (PBS), containing 30 μM LPV, 2.5 mM GSH, 1.0 mg/ml HLM, and 1.0 mM NADPH in a final volume of 400 μl. The final volume of the incubation with semicarbazide (2.5 mM) was 1.5 ml. After 5 min of preincubation at 37°C, the reaction was initiated by the addition of NADPH and continued for 50 min with gentle shaking. Incubations in the absence of NADPH or trapping reagent were used as controls. The reaction mixtures were quenched by adding 100 μl of formic acid (10% in water) for GSH-containing incubations and 350 μl for the semicarbazide-containing incubations. After centrifugation at 18,000 relative centrifugal force (rcf) for 10 min, the resulting supernatants were loaded onto Oasis HLB solid-phase extraction cartridges (Waters, Milford, MA). The cartridges were washed with 1.0 ml of water, followed by 1.0 ml of methanol. The methanol fractions were dried using nitrogen and reconstituted with 100 μl of acetonitrile/water (v/v, 50:50). Aliquots (5.0 μl) of the reconstituted solutions were injected into a system combining ultraperformance liquid chromatography (UPLC) and time-of-flight mass spectrometry (TOFMS) (SYNAPT G1; Waters).
Effect of RTV on LPV Bioactivation.
Because LPV is coadministered with RTV in clinical practice, RTV was coincubated with LPV to examine the effect of RTV on LPV bioactivation. The incubation was conducted in PBS (100 mM, pH 7.4) containing 30 μM LPV, 2.0 μM RTV, 2.5 mM GSH or semicarbazide, and 1.0 mg/ml HLM. The reaction was initiated by the addition of NADPH and continued for 50 min with gentle shaking. The reaction mixtures were quenched by the addition of 10% formic acid. After centrifugation at 18,000 rcf for 10 min, the resulting supernatants were extracted using solid-phase extraction cartridges and analyzed by UPLC-TOFMS.
Role of P450s in LPV Bioactivation.
cDNA-expressed P450s (CYP1A2, -2C8, -2C9, -2C19, -2D6, -2E1, and -3A4) were used to determine the role of individual CYP450 in LPV bioactivation. The incubation was conducted in PBS (100 mM, pH 7.4) containing 30 μM LPV, 2.5 mM GSH, and 10 pmol of each cDNA-expressed CYP450. The reaction was initiated by the addition of NADPH and continued for 50 min with gentle shaking. The reaction mixtures were quenched by the addition of 10% formic acid. After centrifugation at 18,000 rcf for 10 min, the resulting supernatants were extracted using solid-phase extraction cartridges and analyzed by UPLC-TOFMS. The incubations were conducted in duplicate.
Role of P450s in DMP Bioactivation.
DMP was identified as a novel metabolite of LPV in the current study. cDNA-expressed P450s were used to determine the role of individual CYP450 in DMP bioactivation. The incubation was conducted in PBS (100 mM, pH 7.4) containing 30 μM DMP, 2.5 mM GSH, and 20 pmol of each cDNA-expressed CYP450 in a final volume of 200 μl. The reaction was initiated by adding of NADPH and continued for 30 min with gentle shaking. The reaction mixtures were terminated by the addition of ice-cold acetonitrile (200 μl). After centrifugation at 18,000 rcf for 10 min, the resulting supernatants were analyzed by UPLC-TOFMS. The incubations were conducted in duplicate.
UPLC-TOFMS Analyses.
Chromatographic separation of trapped reactive metabolites of LPV was achieved using a 100 × 2.1 mm (Acquity, 1.7 μm) UPLC BEH C18 column (Waters). The flow rate of the mobile phase was 0.3 ml/min, with a gradient ranging from 2 to 98% aqueous acetonitrile containing 0.1% formic acid in a 10-min run. TOFMS was operated in a positive mode with electrospray ionization. The source temperature and desolvation temperature were set at 120 and 350°C, respectively. Nitrogen was applied as the cone gas (10 l/h) and desolvation gas (700 l/h). Argon was applied as the collision gas. TOFMS was calibrated with sodium formate and monitored by the intermittent injection of lock mass leucine enkephalin in real time, generating a reference ion at m/z 556.2771. The capillary voltage and the cone voltage were set at 3.5 kV and 35 V, respectively. The structures of trapped reactive metabolites of LPV were elucidated by tandem mass spectrometry (MS/MS) fragmentation with collision energy ramp ranging from 10 to 40 eV.
Data Analysis.
The implication of a metabolomic approach in studying xenobiotics bioactivation was recently developed and verified by examining bioactivation of pulegone, acetaminophen, and clozapine (Li et al., 2011). In brief, mass chromatograms and mass spectra were acquired by MassLynx software (Waters) in centroid format from m/z 50 to 1000. Centroid and integrated mass chromatographic data were processed by MarkerLynx software (Waters) to generate a multivariate data matrix. The corresponding data matrices were then exported into SIMCA-P (Umetrics, Kinnelon, NJ) for multivariate data analysis. Principal component analysis and orthogonal projection to latent structures-discriminant analysis (OPLS-DA) were conducted on Pareto-scaled data. For chemometric analysis, the matrix data were processed from m/z 700 to 1000.
Results
Profiling Trapped Reactive Metabolites of LPV Using a Metabolomic Approach.
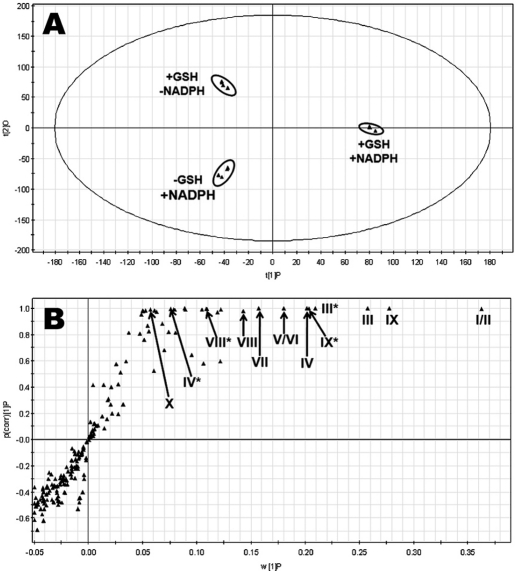
Overall, 12 GSH-trapped and 3 semicarbazide-trapped reactive metabolites of LPV were identified (Table 1). The results of chemometric analysis of the incubations of LPV in HLM are shown in Fig. 1. The supervised OPLS-DA analysis separated samples corresponding to two controls (without GSH or NADPH) and the analyte (with GSH and NADPH) (Fig. 1A). The S-plot generated from OPLS-DA analysis revealed that LPV_GSH adducts highly contributed to the group separation (Fig. 1B). Ten LPV_GSH adducts (I–X) were readily uncovered, including two GSH-conjugated LPV adducts (I and II), four GSH-conjugated monohydroxylated LPV adducts (III, IV, V, and VI), one GSH-conjugated dihydroxylated + dehydrogenated LPV adduct (VII), one GSH-conjugated dihydroxylated LPV adduct (VIII), and two GSH-conjugated trihydroxylated + dehydrogenated LPV adducts (IX and X). In addition, two GSH-conjugated hydroxylated DMP adducts (XI and XII) and three LPV_semicarbazide adducts (LPV_hydrazones 1, 2, and 3) were screened out from the biological matrix as expected metabolites.
TABLE 1.
Summary of trapped reactive metabolites of LPV
The incubation conditions of LPV were detailed in experimental procedures. All samples were analyzed by UPLC-TOFMS.
| Mass | Predicted Formula | RT (min) | Mass Error (ppm) | Identification | Code |
|---|---|---|---|---|---|
| 934.4430 | C47H64N7O11S | 5.73 | 4.8 | LPV_GSH | I |
| 934.4443 | C47H64N7O11S | 5.68 | 6.2 | LPV_GSH | II |
| 950.4378 | C47H64N7O12S | 5.81 | 4.6 | O_LPV_GSH | III |
| 950.4404 | C47H64N7O12S | 5.65 | 7.4 | O_LPV_GSH | IV |
| 950.4346 | C47H64N7O12S | 5.11 | 1.3 | O_LPV_GSH | V |
| 950.4398 | C47H64N7O12S | 5.00 | 5.2 | O_LPV_GSH | VI |
| 964.4189 | C47H62N7O13S | 4.66 | 6.5 | 2O_LPV_GSH (−2H) | VII |
| 966.4221 | C47H64N7O13S | 5.03 | −6.3 | 2O_LPV_GSH | VIII |
| 980.4088 | C47H62N7O14S | 4.70 | 1.3 | 3O_LPV_GSH (−2H) | IX |
| 980.4104 | C47H62N7O14S | 4.78 | 3.0 | 3O_LPV_GSH (−2H) | X |
| 444.1468 | C18H26N3O8S | 3.22 | 6.1 | O_DMP_GSH | XI |
| 444.1460 | C18H26N3O8S | 2.98 | 4.3 | O_DMP_GSH | XII |
| 580.3259 | C30H42N7O5 | 4.99 | 2.1 | LPV_aldehyde_semicarbazide | LPV_hydrazone_1 |
| 578.3099 | C30H40N7O5 | 4.58 | 1.4 | LPV_aldehyde_semicarbazide (−2H) | LPV_hydrazone_2 |
| 594.3040 | C30H4N7O6 | 4.74 | 0.5 | O_LPV_aldehyde_semicarbazide (−2H) | LPV_hydrazone_3 |
RT, retention time; O, monohydroxylated; 2O, dihydroxylated; 3O, trihydroxylated; −2H, dehydrogenated.
Fig. 1.
Metabolomic analysis of control groups and GSH-trapped group of LPV in the incubations with HLM. The incubation conditions of LPV were detailed in experimental procedures. All samples were analyzed by UPLC-TOFMS. A, separation of each incubation group in OPLS-DA score plot. The t[1]P and t[2]O values represent the score of each sample in principal component 1 and 2, respectively. B, loading S-plot generated by OPLS-DA analysis. The x-axis is a measure of the relative abundance of ions, and the y-axis is a measure of the correlation of each ion to the model. The top ranking ions are labeled. *, in-source fragment.
Identification of GSH-Trapped Reactive Metabolites of LPV.
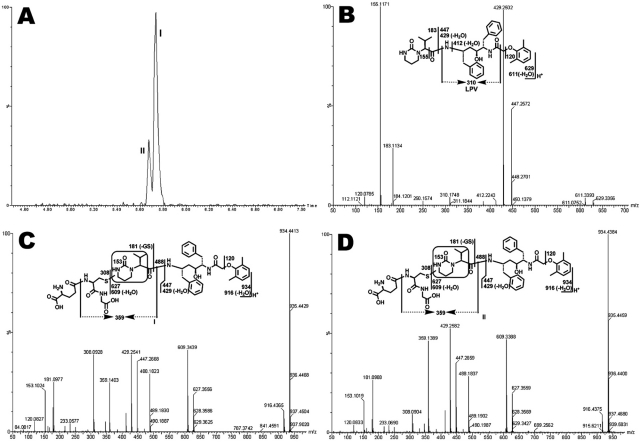
Structural elucidations were performed on the basis of accurate mass measurement and MS/MS fragmentations. LPV adduct I, eluted at 5.73 min (Fig. 2A), had a protonated molecule [M+H]+ at m/z 934.4413, 305 Da higher than that of LPV. Compared with the MS/MS of LPV (Fig. 2B), adduct I had the same fragments at m/z 447.2668 and 429.2541, suggesting that GSH conjugated at the right moiety. The fragment ion at m/z 488.1823 in Fig. 2C is 305 Da higher than that of ion at 183 in Fig. 2B, indicating that the GSH moiety was attached to the encircled unit (Fig. 2C). Other fragments were interpreted in the inlaid structural diagram. Adduct II was eluted at 5.68 min (Fig. 2A), having a protonated molecule [M+H]+ at m/z 934.4384 (Fig. 2D). Adduct II had similar mass spectra patterns to that of adduct I, indicating that GSH was linked to the same unit as with adduct I, but at a different position. The chromatograms and MS/MS spectra of LPV_GSH adducts III to X are provided in the supplemental data (Supplemental Figs. 1–4).
Fig. 2.
Identification of GSH-conjugated LPV adducts I and II. LPV was incubated in HLM containing GSH and analyzed by UPLC-TOFMS. Major daughter ions from fragmentation were interpreted in the inlaid structural diagrams. A, extracted ion chromatograms of LPV adducts I and II; B, MS/MS of LPV; C, MS/MS of LPV adduct I; D, MS/MS of LPV adduct II.
Identification of Semicarbazide-Trapped Reactive Metabolites of LPV.
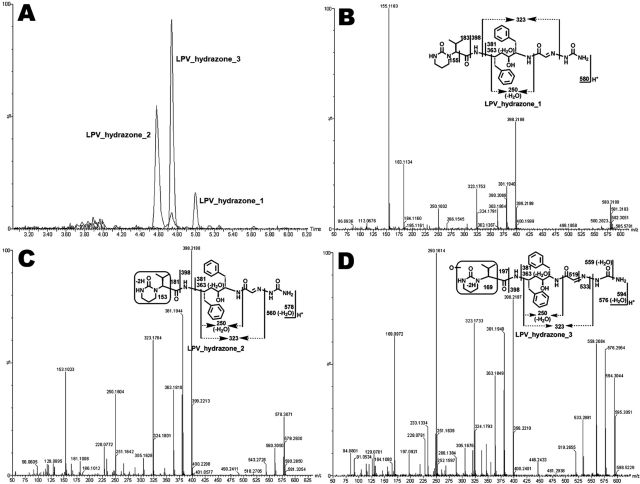
Three LPV hydrazones (LPV_hydrazone_1, 2, and 3) were detected in the incubation of LPV with semicarbazide in HLM (Fig. 3). LPV_hydrazone_1, eluted at 4.99 min (Fig. 3A), had a protonated molecule [M+H]+ at m/z 580.3199. MS/MS analysis of LPV_hydrazone_1 produced daughter ions at m/z 398.2188, 323.1753, 183.1134, and 155.1183 (Fig. 3B). The mass difference between the ions at m/z 398.2188 and 323.1753 is 75 Da, which equals the mass of semicarbazide, suggesting that hydrazone formed. LPV_hydrazone_2 (Fig. 3, A and C), eluted at 4.58 min, had a protonated molecule [M+H]+ at m/z 578.3071. MS/MS analysis of LPV_hydrazone_2 produced daughter ions at m/z 560.3050 (loss of H2O), 398.2188, 323.1764, 181.1008, and 153.1023. Compared with the ions at m/z 183.1134 and 155.1183 generated from LPV_hydrazone_1, the ions at 181.1008 and 153.1023 from LPV_hydrazone_2 indicate that the dehydrogenation occurred in the encircled unit (Fig. 3C). LPV_hydrazone_3 had a protonated molecule [M+H]+ at m/z 594.3044, 16 Da higher than that of LPV_hydrazone_2. MS/MS analysis of LPV_hydrazone_3 produced daughter ions at m/z 576.2954 (loss of H2O), 398.2197, 381.1949, 323.1733, and 250.1614. Compared with the ions at m/z 181.1008 and 153.1023 produced from LPV_hydrazone_ 2, the ions at 197.0921 and 169.0972 from LPV_hydrazone_3 suggest that the dehydrogenation and hydroxylation occurred in the encircled unit (Fig. 3D).
Fig. 3.
The extracted ion chromatograms (A) and MS/MS spectra of LPV_hydrazone_1 (B), 2 (C), and 3 (D). Three LPV hydrazones (LPV_hydrazone_1, 2, and 3) were detected in the incubation of LPV in HLM containing semicarbazide. All samples were analyzed by UPLC-TOFMS. Major daughter ions from fragmentation were interpreted in the inlaid structural diagrams.
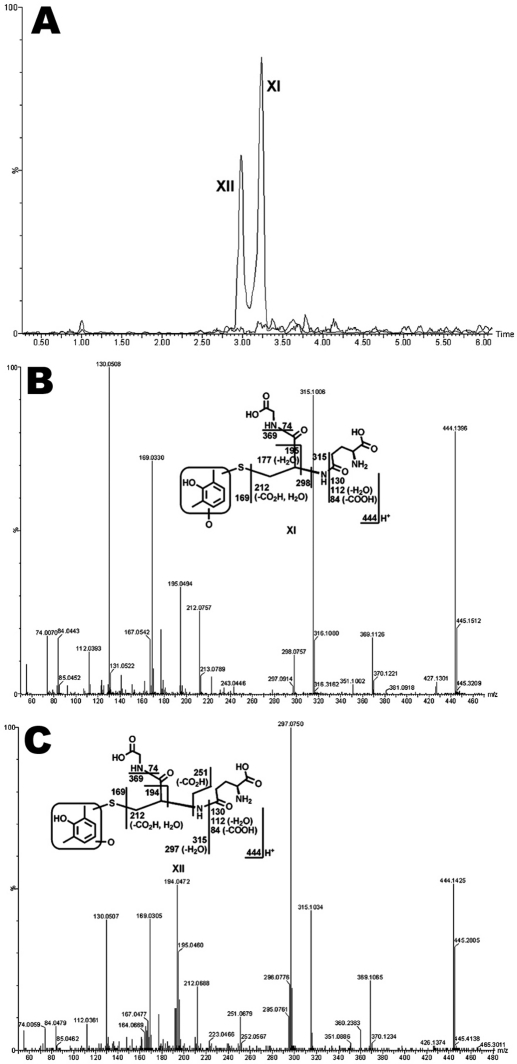
Coupled with the generation of LPV aldehydes, DMP is produced (Fig. 4). DMP is further oxidized to form O_DMP, which can be transformed into reactive intermediates, such as quinone and/or quinone methide, and then be trapped by GSH (Evans et al., 2004; Ma and Subramanian, 2006). In the incubation of LPV in HLM containing GSH, two GSH-conjugated DMP adducts were identified (Fig. 5). Adduct XI was detected at 3.22 min (Fig. 5A), having a protonated molecule [M+H]+ at m/z 444.1396. The MS/MS of adduct XI produced fragment ions at m/z 315.1006, 195.0494, 169.0330, and 130.0508. The formation of ions 315.1006 and 169.0330 suggests that the GSH was connected to monooxidized DMP (Fig. 5B). Adduct XII, eluted at 2.98 min (Fig. 5A), had a protonated molecule [M+H]+ at m/z 444.1425. Adduct XII had a similar fragmentation pattern to that of XI, except for the ions at m/z 297.0750 and 251.0679. The slight difference in MS/MS between XI and XII suggests that the hydroxylated or GSH-coupled position varied (Fig. 5C). The existence of adducts XI and XII was confirmed in the incubation of authentic DMP in HLM containing GSH (data not shown).
Fig. 4.
Proposed mechanism of the formation of aldehydes and DMP in LPV metabolism, and the strategies to trap these metabolites.
Fig. 5.
Identification of GSH-conjugated DMP adducts XI and XII. The incubation conditions of LPV were detailed in experimental procedures. All samples were analyzed by UPLC-TOFMS. Major daughter ions from fragmentation were interpreted in the inlaid structural diagrams. A, extracted ion chromatograms of adducts XI and XII; B, MS/MS of adduct XI; C, MS/MS of adduct XII.
Effect of RTV on LPV Bioactivation.
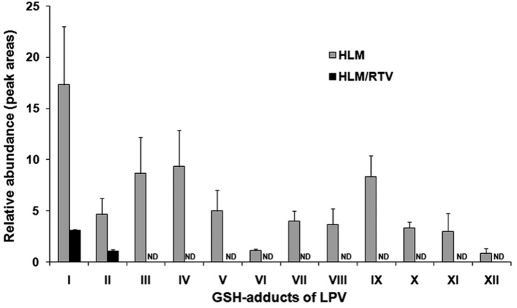
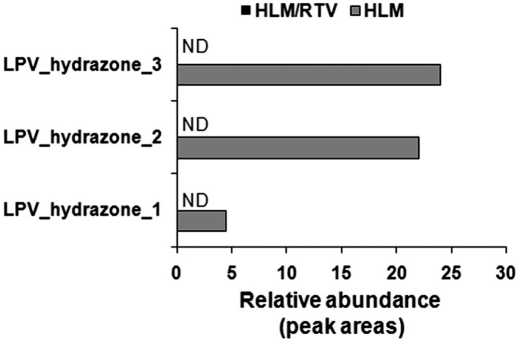
Twelve GSH-conjugated LPV adducts were identified in the incubation with HLM (Fig. 6). RTV significantly suppressed all pathways of LPV bioactivation. The formation of LPV adducts I and II was suppressed ∼80% by RTV in the incubation with HLM (Fig. 6). The formations of LPV_GSH adducts III to XII were completely inhibited by RTV (Fig. 6). The formations of semicarbazide-conjugated LPV adducts (LPV_hydrazone_1, 2, and 3) were also entirely inhibited by RTV (Fig. 7). These data suggest that CYP3A4 plays an important role in the LPV bioactivation and RTV suppresses LPV bioactivation via CYP3A4 inhibition.
Fig. 6.
Effect of RTV on the formation of GSH-conjugated LPV adducts. Quadruplicate incubations were conducted in PBS (pH 7.4) containing LPV (30 μM), GSH (2.5 mM), NADPH (1.0 mM), and HLM (1.0 mg/ml). RTV (2.0 μM) was used in the inhibitory test. All samples were analyzed by UPLC-TOFMS. The abundance of each adduct was relatively quantified using peak areas and presented as mean ± S.D. ND, not detected.
Fig. 7.
Effect of RTV on the formation of semicarbazide conjugated LPV adducts. Duplicate incubations were conducted in PBS (pH 7.4) containing LPV (30 μM), semicarbazide (2.5 mM), NADPH (1.0 mM), and HLM (1.0 mg/ml). RTV (2.0 μM) was used in the inhibitory test. All samples were analyzed by UPLC-TOFMS. The abundance of each adduct was relatively quantified using peak areas and presented as mean. ND, not detected.
Role of P450s in LPV Bioactivation.
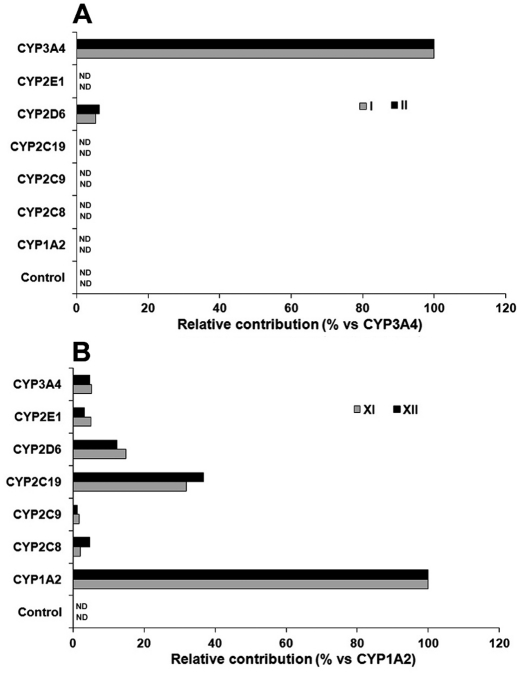
From the inhibitory test of RTV on LPV bioactivation, we observed that RTV cannot entirely suppress the formation of LPV adducts I and II in HLM (Fig. 6), suggesting that some other enzymes are involved in LPV bioactivation. We examined LPV bioactivation in a panel of P450s, including CYP1A2, -2C8, -2C9, -2C19, -2D6, -2E1, and -3A4. CYP3A4 was identified as the dominant enzyme in the formation of LPV adducts I and II. In addition, ∼8% of the formation of LPV adducts I and II was mediated by CYP2D6 (Fig. 8A). These data suggest that CYP2D6 may be involved in LPV bioactivation. We found that multiple enzymes, especially CYP1A2, are involved in DMP bioactivation (Fig. 8B). These data suggest that the formation of adducts XI and XII need two metabolic steps (Fig. 4): step 1 is primarily mediated by CYP3A4 and step 2 is primarily mediated by CYP1A2.
Fig. 8.
Role of P450s in LPV bioactivation. cDNA-expressed P450s were used to determine the role of individual CYP450 in LPV bioactivation. The incubation conditions of LPV were detailed in experimental procedures. All samples were analyzed by UPLC-TOFMS. A, enzymes contributing to the formation of LPV adducts I and II. The substrate was LPV. The peak area of each adduct from the incubation with CYP3A4 was set as 100%. B, enzymes contributing to the formation of adducts XI and XII. The substrate was DMP. The peak area of each adduct from the incubation with CYP1A2 was set as 100%. All data are expressed as mean (n = 2). ND, not detected.
Discussion
Characterizing reactive intermediates can provide information on the structure of the reactive species, thereby defining a potential bioactivation mechanism. In addition, information on adducts of reactive metabolites can be used to predict the potential bindings of reactive metabolites with cellular proteins and/or some other molecules. Most reactive metabolites are not stable, so it is difficult to detect them directly. Reactive metabolites can form adducts with trapping reagents that make the reactive metabolites detectable (Evans et al., 2004; Li et al., 2011). GSH is commonly used to trap soft electrophiles, such as epoxides, α,β-unsaturated carbonyls, quinones, quinone imines, quinone methides, imine methide, isocyanate, isothiocyanates, aziridinium, and episulfonium (Evans et al., 2004; Ma and Subramanian, 2006). Semicarbazide is used to trap hard electrophiles, such as aldehydes (Evans et al., 2004; Li et al., 2011). In the current study, GSH and semicarbazide were used as trapping reagents. We identified 12 GSH-trapped and 3 semicarbazide-trapped reactive metabolites of LPV.
Our study showed that CYP3A4 is the primary enzyme involved in LPV bioactivation (Figs. 6 and 7). CYP3A4 is one of the most important metabolic enzymes expressed in liver and intestine (Guengerich, 1999). Induction or inhibition of CYP3A4 has been known to cause significant drug-drug interactions (Guengerich, 1997; Tanaka, 1998). Because of the importance of CYP3A4 in LPV bioactivation, the effects of CYP3A4 inhibitors and inducers on LPV bioactivation are expected. RTV is a potent CYP3A4 inhibitor that is routinely coadministered with LPV. We found that RTV effectively suppressed LPV bioactivation (Figs. 6 and 7). To our knowledge, no clinical studies have been done to compare the safety profile of LPV/r to LPV alone. However, there is a case report in which LPV alone caused serious multiorgan hypersensitivity (Manfredi and Sabbatani, 2006). These data suggest that RTV may reduce the toxic risk resulting from LPV bioactivation.
On the contrary, coadministering a CYP3A4 inducer, such as rifampicin, with LPV may increase LPV bioactivation and augment LPV side effects. Previous clinical studies have demonstrated that rifampicin decreases the plasma concentration of LPV (la Porte et al., 2004; Ren et al., 2008) and increases the incidence of LPV/r hepatotoxicity (Nijland et al., 2008; L'homme et al., 2009). Further studies are suggested to determine the role of rifampicin-mediated CYP3A4 induction in LPV/r bioactivation and hepatotoxicity.
In addition to CYP3A4, we noted that CYP2D6 and CYP1A2 also contribute to LPV bioactivation. CYP2D6 is involved in the formation of adducts I, II, XI, and XII (Fig. 8). Although CYP2D6 plays a minor role in these pathways of LPV bioactivation, CYP2D6 cannot be neglected because of the extremely high polymorphism of this enzyme (Ingelman-Sundberg, 2005). DMP is a metabolite of LPV that can be further metabolized to form quinone and/or quinone methide intermediates that are known to be toxic mediators in drug-induced toxicity (Bolton et al., 2000; Evans et al., 2004). We trapped these intermediates by using GSH. CYP1A2 is determined to be the primary enzyme contributing to DMP bioactivation (Figs. 8B). CYP1A2 expression is highly inducible by a number of dietary components and some polycyclic aromatic hydrocarbons, some of which are found in cigarette smoke (Kalow and Tang, 1991; Sachse et al., 2003). Therefore, smoking and CYP1A2 inducers should be avoided in patients treated with LPV/r, especially in the condition of CYP3A4 induction.
In summary, LPV bioactivation was investigated using a metabolomic approach. Twelve GSH-trapped and three semicarbazide-trapped reactive metabolites of LPV were identified. RTV effectively suppressed LPV bioactivation via CYP3A4 inhibition. Our data together with previous reports suggest that LPV/r is an ideal combination because RTV not only boosts LPV plasma concentration but decreases LPV bioactivation.
Supplementary Material
Acknowledgments
We thank the National Institutes of Health AIDS Research and Reference Reagent Program for providing the HIV protease inhibitors. We also thank Dr. Martha Montello for editing the manuscript.
This work was supported by the National Institutes of Health National Center for Research Resources [Grant COBRE 5P20-RR021940].
Article, publication date, and citation information can be found at http://dmd.aspetjournals.org.
The online version of this article (available at http://dmd.aspetjournals.org) contains supplemental material.
- LPV
- lopinavir
- RTV
- ritonavir
- PI
- protease inhibitor
- LPV/r
- ritonavir-boosted lopinavir regimen
- DMP
- 2,6-dimethylphenol
- HLM
- human liver microsomes
- PBS
- phosphate-buffered saline
- OPLS-DA
- orthogonal projection to latent structures-discriminant analysis
- TOFMS
- time-of-flight mass spectrometry
- UPLC
- ultraperformance liquid chromatography
- P450
- cytochrome P450
- rcf
- relative centrifugal force
- MS/MS
- tandem mass spectrometry.
Authorship Contributions
Participated in research design: Li and Ma.
Conducted experiments: Li and Lu.
Contributed new reagents or analytic tools: Li.
Performed data analysis: Li and Ma.
Wrote or contributed to the writing of the manuscript: Li and Ma.
References
- Bolton JL, Trush MA, Penning TM, Dryhurst G, Monks TJ. (2000) Role of quinones in toxicology. Chem Res Toxicol 13:135–160 [DOI] [PubMed] [Google Scholar]
- Bonfanti P, Ricci E, Penco G, Orofino G, Bini T, Sfara C, Miccolis S, Cristina G, Quirino T. and CISAI Study Group (2005) Low incidence of hepatotoxicity in a cohort of HIV patients treated with lopinavir/ritonavir. AIDS 19:1433–1434 [DOI] [PubMed] [Google Scholar]
- Croxtall JD, Perry CM. (2010) Lopinavir/ritonavir: a review of its use in the management of HIV-1 infection. Drugs 70:1885–1915 [DOI] [PubMed] [Google Scholar]
- Cvetkovic RS, Goa KL. (2003) Lopinavir/ritonavir: a review of its use in the management of HIV infection. Drugs 63:769–802 [DOI] [PubMed] [Google Scholar]
- Ernest CS, 2nd, Hall SD, Jones DR. (2005) Mechanism-based inactivation of CYP3A by HIV protease inhibitors. J Pharmacol Exp Ther 312:583–591 [DOI] [PubMed] [Google Scholar]
- Evans DC, Watt AP, Nicoll-Griffith DA, Baillie TA. (2004) Drug-protein adducts: an industry perspective on minimizing the potential for drug bioactivation in drug discovery and development. Chem Res Toxicol 17:3–16 [DOI] [PubMed] [Google Scholar]
- Gathe J, da Silva BA, Cohen DE, Loutfy MR, Podzamczer D, Rubio R, Gibbs S, Marsh T, Naylor C, Fredrick L, et al. (2009) A once-daily lopinavir/ritonavir-based regimen is noninferior to twice-daily dosing and results in similar safety and tolerability in antiretroviral-naive subjects through 48 weeks. J Acquir Immune Defic Syndr 50:474–481 [DOI] [PubMed] [Google Scholar]
- Guengerich FP. (1997) Role of cytochrome P450 enzymes in drug-drug interactions. Adv Pharmacol 43:7–35 [DOI] [PubMed] [Google Scholar]
- Guengerich FP. (1999) Cytochrome P-450 3A4: regulation and role in drug metabolism. Annu Rev Pharmacol Toxicol 39:1–17 [DOI] [PubMed] [Google Scholar]
- Hurst M, Faulds D. (2000) Lopinavir. Drugs 60:1371–1379; discussion 1380–1371 [DOI] [PubMed] [Google Scholar]
- Ingelman-Sundberg M. (2005) Genetic polymorphisms of cytochrome P450 2D6 (CYP2D6): clinical consequences, evolutionary aspects and functional diversity. Pharmacogenomics J 5:6–13 [DOI] [PubMed] [Google Scholar]
- Kalgutkar AS, Obach RS, Maurer TS. (2007) Mechanism-based inactivation of cytochrome P450 enzymes: chemical mechanisms, structure-activity relationships and relationship to clinical drug-drug interactions and idiosyncratic adverse drug reactions. Curr Drug Metab 8:407–447 [DOI] [PubMed] [Google Scholar]
- Kalow W, Tang BK. (1991) Caffeine as a metabolic probe: exploration of the enzyme-inducing effect of cigarette smoking. Clin Pharmacol Ther 49:44–48 [DOI] [PubMed] [Google Scholar]
- Kolars JC, Schmiedlin-Ren P, Schuetz JD, Fang C, Watkins PB. (1992) Identification of rifampin-inducible P450IIIA4 (CYP3A4) in human small bowel enterocytes. J Clin Invest 90:1871–1878 [DOI] [PMC free article] [PubMed] [Google Scholar]
- Kumar GN, Dykstra J, Roberts EM, Jayanti VK, Hickman D, Uchic J, Yao Y, Surber B, Thomas S, Granneman GR. (1999a) Potent inhibition of the cytochrome P-450 3A-mediated human liver microsomal metabolism of a novel HIV protease inhibitor by ritonavir: a positive drug-drug interaction. Drug Metab Dispos 27:902–908 [PubMed] [Google Scholar]
- Kumar GN, Jayanti V, Lee RD, Whittern DN, Uchic J, Thomas S, Johnson P, Grabowski B, Sham H, Betebenner D, et al. (1999b) In vitro metabolism of the HIV-1 protease inhibitor ABT-378: species comparison and metabolite identification. Drug Metab Dispos 27:86–91 [PubMed] [Google Scholar]
- Kumar GN, Jayanti VK, Johnson MK, Uchic J, Thomas S, Lee RD, Grabowski BA, Sham HL, Kempf DJ, Denissen JF, et al. (2004) Metabolism and disposition of the HIV-1 protease inhibitor lopinavir (ABT-378) given in combination with ritonavir in rats, dogs, and humans. Pharm Res 21:1622–1630 [DOI] [PubMed] [Google Scholar]
- L'homme RF, Nijland HM, Gras L, Aarnoutse RE, van Crevel R, Boeree M, Brinkman K, Prins JM, Juttmann JR, Burger DM. (2009) Clinical experience with the combined use of lopinavir/ritonavir and rifampicin. AIDS 23:863–865 [DOI] [PubMed] [Google Scholar]
- la Porte CJ, Colbers EP, Bertz R, Voncken DS, Wikstrom K, Boeree MJ, Koopmans PP, Hekster YA, Burger DM. (2004) Pharmacokinetics of adjusted-dose lopinavir-ritonavir combined with rifampin in healthy volunteers. Antimicrob Agents Chemother 48:1553–1560 [DOI] [PMC free article] [PubMed] [Google Scholar]
- Li F, Lu J, Ma X. (2011) Profiling the reactive metabolites of xenobiotics using metabolomic technologies. Chem Res Toxicol 24:744–751 [DOI] [PMC free article] [PubMed] [Google Scholar]
- Ma S, Subramanian R. (2006) Detecting and characterizing reactive metabolites by liquid chromatography/tandem mass spectrometry. J Mass Spectrom 41:1121–1139 [DOI] [PubMed] [Google Scholar]
- Manfredi R, Sabbatani S. (2006) Serious, multi-organ hypersensitivity to lopinavir alone, involving cutaneous-mucous rash, and myeloid, liver, and kidney function. AIDS 20:2399–2400 [DOI] [PubMed] [Google Scholar]
- Murphy RL, da Silva BA, Hicks CB, Eron JJ, Gulick RM, Thompson MA, McMillan F, King MS, Hanna GJ, Brun SC. (2008) Seven-year efficacy of a lopinavir/ritonavir-based regimen in antiretroviral-naive HIV-1-infected patients. HIV Clin Trials 9:1–10 [DOI] [PubMed] [Google Scholar]
- Nijland HM, L'homme RF, Rongen GA, van Uden P, van Crevel R, Boeree MJ, Aarnoutse RE, Koopmans PP, Burger DM. (2008) High incidence of adverse events in healthy volunteers receiving rifampicin and adjusted doses of lopinavir/ritonavir tablets. AIDS 22:931–935 [DOI] [PubMed] [Google Scholar]
- Oldfield V, Plosker GL. (2006) Lopinavir/ritonavir: a review of its use in the management of HIV infection. Drugs 66:1275–1299 [DOI] [PubMed] [Google Scholar]
- Palacios R, Vergara S, Rivero A, Aguilar I, Macías J, Camacho A, Lozano F, García-Lázaro M, Pineda JA, Torre-Cisneros J, et al. (2006) Low incidence of severe liver events in HIV patients with and without hepatitis C or B coinfection receiving lopinavir/ritonavir. HIV Clin Trials 7:319–323 [DOI] [PubMed] [Google Scholar]
- Ren Y, Nuttall JJ, Egbers C, Eley BS, Meyers TM, Smith PJ, Maartens G, McIlleron HM. (2008) Effect of rifampicin on lopinavir pharmacokinetics in HIV-infected children with tuberculosis. J Acquir Immune Defic Syndr 47:566–569 [DOI] [PubMed] [Google Scholar]
- Sachse C, Bhambra U, Smith G, Lightfoot TJ, Barrett JH, Scollay J, Garner RC, Boobis AR, Wolf CR, Gooderham NJ, et al. (2003) Polymorphisms in the cytochrome P450 CYP1A2 gene (CYP1A2) in colorectal cancer patients and controls: allele frequencies, linkage disequilibrium and influence on caffeine metabolism. Br J Clin Pharmacol 55:68–76 [DOI] [PMC free article] [PubMed] [Google Scholar]
- Sham HL, Kempf DJ, Molla A, Marsh KC, Kumar GN, Chen CM, Kati W, Stewart K, Lal R, Hsu A, et al. (1998) ABT-378, a highly potent inhibitor of the human immunodeficiency virus protease. Antimicrob Agents Chemother 42:3218–3224 [DOI] [PMC free article] [PubMed] [Google Scholar]
- Tanaka E. (1998) Clinically important pharmacokinetic drug-drug interactions: role of cytochrome P450 enzymes. J Clin Pharm Ther 23:403–416 [DOI] [PubMed] [Google Scholar]
- ter Heine R, Van Waterschoot RA, Keizer RJ, Beijnen JH, Schinkel AH, Huitema AD. (2011) An integrated pharmacokinetic model for the influence of CYP3A4 expression on the in vivo disposition of lopinavir and its modulation by ritonavir. J Pharm Sci 100:2508–2515 [DOI] [PubMed] [Google Scholar]
Associated Data
This section collects any data citations, data availability statements, or supplementary materials included in this article.


