Abstract
Obesity is among the leading causes of elevated cardiovascular disease (CVD) mortality and morbidity. In the present study, the associations between the increase in body mass index (BMI) and the increase rates of CVD and high blood pressure (HBP) in the states of Mississippi, Alabama, Louisiana, Tennessee, and Colorado are examined using regression analysis and by means of neural network models for obesity and HBP. Data from Behavioral Risk Factor Surveillance System were obtained and analyzed for obesity rates, percent of myocardial infarction, stroke, and HBP from 2005–2009. Results of this study showed a low association between obesity and myocardial infarction rates (R2=0.067); a moderate association with stroke rates (R2=0.462); and a strong association with HBP rates (R2=0.811). The highest rates of obesity, CVD, and HBP were found in Mississippi, while Colorado had the lowest rates. Maintaining healthy weight helps reduce the risks of developing CVD.
Keywords: Obesity, high blood pressure, stroke, myocardial infarction, cardiovascular diseases, regression, neural network
Overweight and obesity are defined by the World Health Organization as abnormal or excessive fat that accumulate and present a risk to health.1 Obesity is measured in body mass index (BMI), which is a person’s weight (in kilograms) divided by the square of his or her height (in meters). A person with a BMI of 30 or more is generally considered obese. A person with a BMI equal to or more than 25 is considered overweight.1,2
The degree and incidence of obesity in the U.S. has been increasing in both adults and children.3 In the United States, nearly 70% of adults are classified as overweight or obese.3 An estimate of 2.6 million deaths worldwide and 2.3% of the global burden of disease are caused by obesity.4,5 Obesity was found to be a major risk factor for the development of type-2 diabetes, asthma, hypertension, stroke, coronary artery disease, cancer and cancer-related mortality, liver and gallbladder diseases, sleep apnea, osteoarthritis, and gynecological complications.2,6 Obesity also adds to risk once the levels of coexisting risk factors are taken into account. Obesity is associated with elevated blood pressure, blood lipids, and blood glucose; changes in body weight are coincident with changes in these risk factors for disease.7,8
Cardiovascular disease (CVD) mortality and morbidity has been shown to be elevated in individuals who are overweight, particularly with central deposition of adipose tissues.4 Abdominal obesity has been shown to be a risk factor for CVD worldwide.8 Obesity may be associated with hypertension, dyslipidemia, diabetes, or insulin resistance, and elevated levels of fibrinogen and C-reactive protein, all of which increase the risk of CVD events.9
In addition to CVD, obesity has been shown to increase the risk of high blood pressure (HBP).2,8 Persistent hypertension is one of the risk factors for stroke, myocardial infarction (MI), heart failure, and arterial aneurysm, and is a leading cause of chronic kidney failure. Moderate elevation of arterial blood pressure leads to shortened life expectancy, which also increases the risk of heart diseases.2
The highest rates of obesity are usually found among African American and Latino, especially the youth.10,11 For the past three years Mississippi was named the most obese state in the country.12 Racial and ethnic disparities of obesity, in addition to regional and income disparities, are major public health concerns in Mississippi.
The objectives of this study are:
to examine the associations between increased rates of BMI, CVD, and HBP in the state of Mississippi (with highest obesity rate) and three neighboring states (Alabama, Louisiana, and Tennessee) and Colorado;
to analyze further obesity and HBP association in Mississippi through modeling approaches, such as regression, simulation, and neural network.
Methods
Data collection
Body mass index (weight in kg divided by height2) data were obtained from the Centers for Disease Control and Prevention’s (CDC) Behavioral Risk Factor Surveillance System (BRFSS) [see: http://apps.nccd.cdc.gov/BRFSS]. Data of individuals with BMI >30 (grouped by gender and race) were collected for the U.S., Mississippi, Alabama, Louisiana, Tennessee, and Colorado from 2005–2009. The data for cardiovascular diseases were also obtained from the BRFSS. The proportion of respondents with MI was the percentage of people who answered yes when asked if they had ever been told they “had a heart attack (myocardial infarction)”; and the proportion with stroke was the percentage who answered yes when asked if they had ever been told they had “a stroke.” High blood pressure rates were determined using the proportion of respondents who had been told that they had high blood pressure. All variables were grouped by gender and race.
Statistics
Data were analyzed using PROC REG (regression analysis) procedure of SAS software13 with MI, stroke, and HBP rates as response (dependent) variables and obesity (BMI >30) rate as explanatory (independent) variable. PROC GLM (General Linear Model) was used to determine the significant difference in obesity, MI, stroke, and HBP among states, genders, and races; followed by TUKEY standardized test for further classifications.
Mississippi regression analysis
To understand further the association between obesity and HBP in Mississippi, data of obesity and HBP were obtained from BRFSS from 2000–2009. Regression analysis was performed using PROC REG of SAS13 with obesity as explanatory (independent) variable and HBP rates as response (dependent) variable.
Neural network models
In addition to regression analysis, various neural network models were developed for obesity and HBP in Mississippi as an alternative to regression analysis and to understand better the interaction when limited data are available. BRFSS data, from 2000–2009, for obesity and HBP were used to calculate means and standard deviation, which were then used to generate 200 simulated data points using @RISK 5.5 software.14 The simulated data of obesity and HBP were used to train several neural networks with NeuroShell2 software.15 In these training of neural network models obesity was used as an input and HBP as an output, besides other approaches. Then the original data of obesity and HBP were used to create test examples for neural network predictions. After several iterations, best fitted neural network models were produced with corresponding statistical results and predicted values. A brief description about the functioning of neural networks is given below; further information may be found elsewhere.16
Neural network
A neural network is a computer program (series of instructions) that loosely behaves like a biological brain. Millions of neurons in the biological brain work together in parallel, each trying to solve a tiny bit of a complex problem. This type of problem-solving, (which might be thought of as dividing and conquering) seems very efficient with fuzzy data, allowing the system to make decisions based on past experiences, and to associate and apply the acquired knowledge to new situations.
Neural networks learn by example. To train a neural network under supervision for a specific problem, it needs to be shown good examples, in which the inputs and outputs are already known. Based on these examples, the network builds a model for the problem. Training data can be obtained from historical problem data in which the outcomes are already known, or by creating sample problems and solutions with the help of experts, or through empirical research (where feasible).
A typical neural network has three layers of neurons, each of which is connected to the neurons in the next layer. Each connection has a weight associated with it. Input values in the first layer are weighted and passed on to the hidden layer. Neurons in the hidden layer produce outputs by applying an activation function to the sum of the weighted input values. These outputs are then weighted by the connections between the hidden and output layer. The output layer produces the desired results.
The network adjusts its interconnection weights repeatedly so that the output neurons produce results close to the correct outputs in the training data. Eventually, if the network (as it were) learns the problem in this way, the weights become stable. The real power of the trained network lies in producing good results for data that it has never encoutnered before. When a network with back-propagation architecture is presented with the training set, the neuron transforms sums of inputs into weights that are transferred to other neurons. The difference between the predicted output and the actual training output is computed. The error is propagated backwards through the hidden layer to the input layers. The connection weights between neurons and layers are adjusted until the output error is minimized. All of the training set data are presented until the network is able to duplicate the training set with success. This trained neural network can then be used to predict outputs when given inputs upon which it has not been trained.
Results
Results of this study are summarized in Table 1. Analysis of variance showed a significant increase in obesity rates over the past five years in all states and in the U.S. (p<.001). During the examined years, Mississippi had the highest rate of obesity (31.75 ± 1.20%); followed by Louisiana (30.75 ± 0.07%), Alabama (29.9 ± 1.41%), and Tennessee (29.05 ± 2.33%). All four Southern states differed significantly from Colorado (p<.001), which had the lowest rate of obesity (18.55 ± 1.06). The national obesity rate was highest among African Americans (35.90 ± 1.27%) of all racial/ethnic groups.
Table 1.
MEAN AND STANDARD DEVIATION FOR ALL VARIABLES (OBESITY, MI: MYOCARDIAL INFARCTION, STROKE, AND HBP: HIGH BLOOD PRESSURE), GROUPED BY GENDER (MALES AND FEMALES) AND BY RACE (WHITES AND AF AM: AFRICAN AMERICANS) FOR THE US, MISSISSIPPI, ALABAMA, LOUISIANA, TENESSEE AND COLORADO FROM 2005–2009
| USA Mean ± Std Dev |
MS Mean ± Std Dev |
AL Mean ± Std Dev |
LA Mean ± Std Dev |
TN Mean ± Std Dev |
CO Mean ± Std Dev |
|
|---|---|---|---|---|---|---|
| Obesity rate | 25.35 ±1.34 | 31.75 ±1.20 | 29.9 ± 1.41 | 30.75 ± 0.07 | 29.05 ± 2.33 | 18.55 ± 1.06 |
| Obesity males | 26.0 ± 1.69 | 30.85 ± 0.77 | 28.95 ± 1.34 | 32.00 ± 0.14 | 30.20 ± 3.53 | 18.65 ± 1.34 |
| Obesity females | 24.95 ± 1.34 | 32.60 ± 1.55 | 30.30 ± 2.12 | 29.55 ± 0.35 | 27.95 ±1.20 | 18.45 ± 0.63 |
| Obesity Whites | 24.6 ± 1.55 | 26.95 ± 0.91 | 26.20 ± 1.31 | 27.20 ± 0.56 | 27.25 ± 2.33 | 17.00 ± 0.84 |
| Obesity Af Am | 35.9 ± 1.27 | 41.05 ± 2.47 | 41.15 ± 2.19 | 39.95 ± 0.35 | 42.25 ± 0.21 | 23.40 ± 4.24 |
| MI rate | 4.10 ± 0.14 | 4.90 ±0.42 | 5.15 ± 0.35 | 4.75 ± 0.21 | 5.30 ± 0.28 | 2.95 ± 0.07 |
| MI males | 6.45 ± 0.07 | 6.10 ± 0.42 | 6.90 ± 0.70 | 5.85 ± 0.21 | 6.40 ± 0.42 | 3.65 ± 0.07 |
| MI females | 3.00 ± 0.14 | 3.80 ± 0.42 | 4.08 ± 0.80 | 3.80 ± 0.28 | 4.20 ± 0.14 | 2.16 ± 0.16 |
| MI Whites | 4.35 ± 0.07 | 5.10 ± 0.28 | 5.90 ± 0.42 | 4.70 ± 0.14 | 5.55 ± 0.21 | 3.10 ± 0.07 |
| MI Af Am | 3.80 ± 0.14 | 4.30 ± 0.98 | 2.60 ± 0.42 | 4.05 ± 0.21 | 3.75 ± 2.19 | 1.60 ± 0.56 |
| Stroke rate | 2.56 ± 0.08 | 3.80 ± 0.56 | 3.50 ± 0.14 | 3.36 ± 0.25 | 3.40 ± 0.28 | 1.60 ± 0.28 |
| Stroke males | 2.55 ± 0.07 | 3.70 ± 0.42 | 3.30 ± 0.14 | 2.95 ± 0.49 | 3.50 ± 0.98 | 1.40 ± 0.42 |
| Stroke females | 2.62 ± 0.08 | 4.00 ± 0.70 | 3.75 ± 0.07 | 3.35 ± 0.35 | 3.30 ± 0.28 | 1.80 ± 0.14 |
| Stroke Whites | 2.52 ± 0.08 | 3.70 ± 0.56 | 3.82 ± 0.45 | 3.00 ± 0.84 | 3.40 ± 0.28 | 1.60 ± 0.28 |
| Stroke Af Am | 3.50 ± 0.14 | 4.00 ± 0.28 | 3.35 ± 1.20 | 4.20 ± 0.28 | 2.90 ± 0.14 | 2.50 ± 2.54 |
| HBP rate | 26.65 ± 1.62 | 33.50 ± 0.28 | 32.15 ± 1.34 | 30.75 ± 1.90 | 32.00 ± 2.54 | 20.65 ± 0.77 |
| HBP males | 26.75 ± 1.90 | 32.35 ± 0.49 | 31.50 ± 1.97 | 30.75 ± 1.34 | 32.05 ± 5.16 | 21.70 ± 1.13 |
| HBP females | 25.65 ± 1.06 | 34.50 ± 0.14 | 32.75 ± 0.77 | 30.70 ± 2.40 | 31.90 ± 0.14 | 19.60 ± 0.56 |
| HBP Whites | 26.95 ± 1.34 | 30.70 ± 1.31 | 31.50 ± 0.70 | 28.90 ± 2.97 | 31.75 ± 3.18 | 21.60 ± 0.28 |
| HBP Af Am | 35.50 ± 1.97 | 39.25 ± 0.77 | 35.10 ± 3.53 | 35.45 ± 0.63 | 36.25 ± 0.91 | 30.10 ± 3.39 |
Cardiovascular diseases besides HBP (including MI and stroke) were significantly higher in the Southern states than elsewhere (p<.05). Highest rates of MI were found in Tennessee and Alabama (5.30 ± 0.28%; 5.15 ± 0.35%, respectively). Males had the highest national average of MI with 6.45%. The lowest rates of MI were found in Colorado (2.95 ± 0.07%). Stroke rates were the highest in Mississippi and Alabama (3.80 ± 0.56% and 3.50 ± 0.14%); while the lowest rates were found in Colorado (1.60 ± 0.28%). African American, especially in Louisiana (4.20 ± 0.28%) and Mississippi (4.0 ± 0.28%) had higher stroke rates than non-Hispanic Whites. In addition, there was a significant increase over time in HBP rates in all states (p<.05). Highest rates of HBP were found in Mississippi (33.50 ± 0.28%) and Alabama (32.15 ± 1.97%); while Colorado had the lowest rates (20.65 ± 0.77%). African Americans in the United States had higher rates of HBP (35.5 ± 1.97%) with Mississippi at the top (39.25 ± 0.77%).
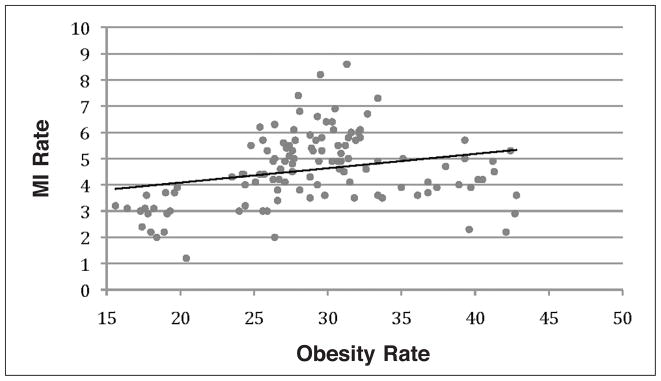
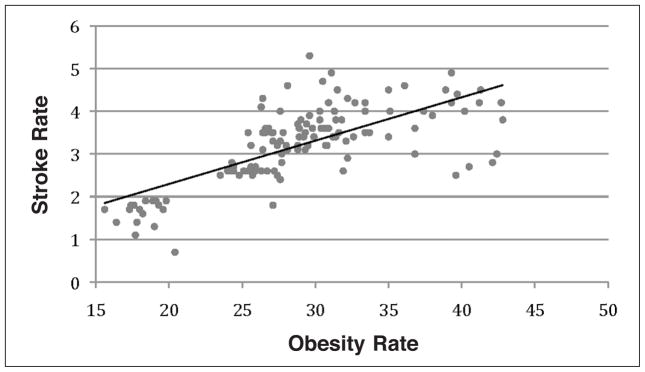
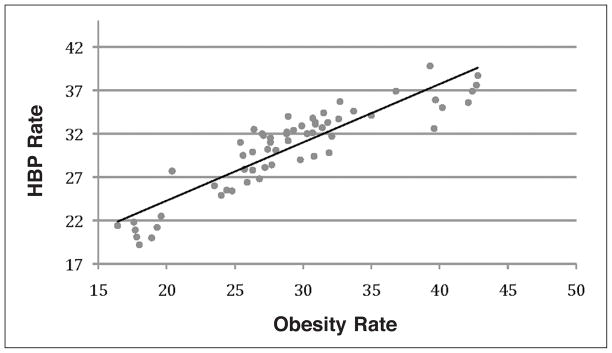
Regression analysis was performed to test the association between CVD and obesity in the selected states. Rates of CVD, including MI and stroke, and HBP were used as response variables and obesity rates (BMI>30) as an explanatory variable. Results from the regression analysis showed a low association between obesity and MI rates (R2=0.067, Figure 1); a moderate association between obesity and stroke rates (R2=0.462, Figure 2); and strong association between obesity and HBP rates (R2=0.811, Figure 3).
Figure 1.
Regression analysis of Myocardial infarction and obesity rates shows a low association (R2=0.067).
Figure 2.
Regression analysis between the stroke rates and obesity (BMI>30). This analysis shows a coefficient of determination R2=0.462.
Figure 3.
A strong association (R2=0.811) between high blood pressure and obesity rates was found with regression analysis.
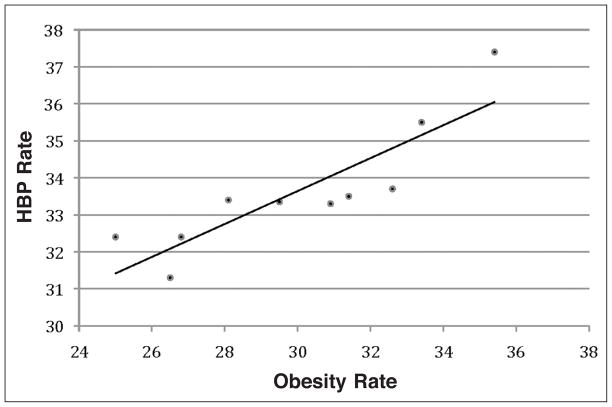
Regression analysis for MS is shown in Figure 4. The relationship between obesity and HBP showed a strong association (R2=0.7622). The strong association between the variables may suggest that 76% of the HBP rates in this study could be explained by obesity rates.
Figure 4.
Regression analysis for obesity rates and high blood pressure rates in MS from 2000–2009 shows a strong association (R2=0.7622), y=0.4453x+20.284.
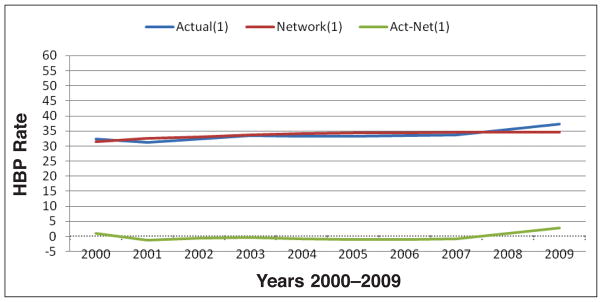
Mississippi had the highest rates of obesity and HBP among the examined states (mean = 30.08 ± 4.9 and 33.90 ± 0.41, respectively). To further analyze the association and to develop novel prediction models, several neural network models, using NeuroShell2 software15 were developed. Neural networks models were developed to predict HBP as output by using obesity rates as input. Simulated data were generated to develop a model using @RISK software.14 A sample of the simulated data for obesity and HBP that were used for the neural network training is shown in Table 2. One of the neural network models for obesity and HBP is shown in Figure 5. The R2 value for this prediction, that measures the degree of fit between the actual and the predicted valued, is 0.41. This model shows a moderate fit with 41% relations between the predicted and actual values. A perfect fit would have resulted in R2 value of close to one; while a poor fit close to zero. Detailed neural network results are shown in Table 3.
Table 2.
SAMPLE OF SIMULATED DATA USED FOR NN (NEURAL NETWORK) TRAINING; MEAN, STANDARD DEVIATION AND RISK NORMAL VALUE FOR OBESITY AND HIGH BLOOD PRESSURE
| Sample | Obesity Input | HBP Output |
|---|---|---|
| 1 | 31.378415 | 32.92848 |
| 2 | 28.49519 | 33.3682 |
| 3 | 32.656952 | 32.03656 |
| 4 | 22.870368 | 34.24982 |
| 5 | 31.981525 | 37.42984 |
| 6 | 27.451025 | 34.16271 |
| 7 | 19.226521 | 33.35962 |
| 8 | 29.187303 | 33.2364 |
| 9 | 28.598695 | 33.60046 |
| 10 | 31.941129 | 33.89166 |
| 11 | 28.143317 | 33.58107 |
| 12 | 24.002756 | 35.26133 |
| 13 | 21.706451 | 34.82364 |
| 14 | 21.319447 | 31.96378 |
| 15 | 38.119348 | 35.72525 |
| 16 | 31.910395 | 32.75034 |
| 17 | 27.040491 | 34.58372 |
| 18 | 26.359545 | 34.06848 |
| 19 | 31.504373 | 36.58249 |
| 20 | 25.508133 | 34.27446 |
| 21 | 31.851626 | 33.96903 |
| 22 | 33.113502 | 33.32777 |
| 23 | 34.098059 | 31.73045 |
| Mean | 30.082492 | 33.89758 |
| SD | 4.9354215 | 1.537426 |
| RISK | 30.082492 | 33.89758 |
Figure 5.
Obesity and high blood pressure predicted model. Neural network model that shows the actual and the predicted model of obesity (percent of individuals with BMI>30) as an input and the percent of HBP as an output for the MS data from 2000–2009 (R2: 0.4044).
Table 3.
NEURAL NETWORK RESULTS
| R squared: | 0.4044 |
| Mean squared error: | 1.574 |
| Mean absolute error: | 1.081 |
| Min. absolute error: | 0.342 |
| Max. absolute error: | 2.799 |
| Correlation coefficient r: | 0.6404 |
Discussion
Obesity prevalence has been increasing worldwide in adults and children.17,18 It is a fast-growing problem that is associated with an increased risk of premature death and causes many adverse health effects, including CVD and HBP.4 Obesity is a critical problem that is increasing in the United States. Nearly 70% of adults are classified as overweight or obese compared with 25% four decades ago.3 If the current trends continue, obesity may overtake cigarette abuse as the leading cause of preventable diseases.3
Moderate-to-severe obesity is an important risk factor for heart diseases, directly or indirectly through intervening risk factors, such as hypertension, dyslipidemia, and diabetes. Obesity constitutes one of the most important independent CVD risk factor, and positive relationships between CVD mortality and BMI has been shown in many large-scale studies.19 Obesity has many adverse effects on cardiovascular function and structure. The total blood volume and cardiac output are increased in obesity and cardiac workload is usually greater.3
Results of this study however, showed a lower association between obesity and MI than other studies showed when obesity was calculated based on waist-to-hip ratio instead of BMI in African Americans.17 Waist circumference or waist to hip ratio had shown better association with MI especially in African Americans. In addition, our study mainly examined the Southeastern states, which have relatively large African American populations; we found that in our sample, African Americans had lower rates of MI than non-Hispanic White counterparts. Although the data are not shown here, our results also indicate a low association between MI and HBP rates.
A moderate association was found between the increase in BMI and stroke in this study. Other studies have reported an association between BMI and waist to hip ratio and stroke.17 BMI and stroke were shown to have a strong association; for each one-unit increase in BMI, there was a 4% increase in the risk of ischemic stroke and 6% increase for hemorrhagic stroke.3,8 The increased stroke rate in obesity may be predicted by the prothrombotic/proinflammatory state that often accompanies excessive adipose tissue accumulation.8 Our study indicated that African Americans suffer from higher rates of stroke than non-Hispanic Whites; these results were shown in all the examined states. High blood pressure is usually more frequent in obese people.2 A 10 kg higher body weight is associated with a 3.0 mm Hg higher systolic and 2.3 mm higher diastolic blood pressure; this increase estimates a 12% increase in coronary heart disease and 24% increased risk for stroke.8
Our study found a strong association between obesity and HBP in all states using regression analysis. The rates of obesity and HBP were higher among African Americans, with Mississippi having the highest rates. Twenty percent of the African American deaths in the United States are caused by HBP.2 Compared with non-Hispanic Whites, African Americans develop HBP earlier in life and have much higher average blood pressures. African Americans with HBP have an 80% higher chance of dying from a stroke than people in the general population. They also have higher chance of developing heart diseases than in the general population and a four times greater risk of developing hypertension related end stage kidney disease than the general population.2,3
The association between obesity and HBP was found to be strong in our study for the selected states. However, to understand better and to highlight this important health concern in Mississippi, a separate regression model was developed, which showed a strong association between obesity and HBP. Thirty eight percent of Mississippi’s population is African American. In 2009, 37% of the African Americans suffered from HBP and 40% were considered obese. Environmental, genetic, lifestyles, socioeconomic, and many other factors may contribute to this problem.2,12,20 Intentional weight loss in obese patients can improve or prevent many of the obesity related risk factors for CVD and HBP.8 Weight loss therapies include dietary intervention, physical activity, pharmacotherapy and surgery.3,8 For example, weight loss in obese individuals was found to be associated with decrease in blood pressure. In 50% or more of the individuals, the average decrease in diastolic blood pressure is 1 to 4 mm Hg systolic and 1 to 2 mm Hg diastolic per kilogram of weight reduction.8
To analyze this association further, neural network models were developed. Neural networking has been used previously for prediction of T-Cell epitopes,21 prediction of cancer using gene expression profiling,22 temperature prediction,23 poultry growth modeling,24 egg price forcasting,25 and other such physiological predictions. A moderate fit between the actual and predicted values of the neural network was found in our study. In this study, modeling the relationship of obesity and high blood pressure HBP with neural network may provide a reliable alternative for predicting the rates of obesity and its effect on HBP. In addition, neural network model requires small number of variables and it allows testing for the variation within each variable, which can be more effective and resource efficient.25
In conclusion, obesity is a chronic metabolic disorder associated with CVD and the increased mortality and morbidity. Our results have indicated a low association between obesity and MI rates and a moderate association with stroke rates when BMI was used as obesity indicator. However, a strong association was found with HBP when BMI rates were used as obesity indicator. Obesity and HBP modeling with regression and neural network may provide a reliable understanding of the problem, which may aid in the design of new and better interventions to slow and reverse the epidemic.
Acknowledgments
The project described was supported by Grants Number G12RR013459 from the National Center of Research Resources, and S-LMAQM-08GR-071 from the National Academies/U.S. State Department. The content is solely the responsibility of the author and does not necessarily represent the official views of the National Center of Research Resources or the National Institutes of Health.
Contributor Information
Luma Akil, Environmental Science, College of Science, Engineering and Technology at Jackson State University.
H. Anwar Ahmad, Email: hafiz.a.ahmad@jsums.edu, Jackson State University in the College of Science, Engineering and Technology, where he can be reached at JSU Box 18540, 1400 JR Lynch Street, Jackson, MS 39217; (601) 979-4048.
Notes
- 1.World Health Organization. Health topics: obesity. Geneva, Switzerland: World Health Organization; 2011. Available at: http://www.who.int/topics/obesity/en/ [Google Scholar]
- 2.Centers for Disease Control and Prevention. Overweight and obesity. Atlanta, GA: Centers for Disease Control and Prevention; 2011. Available at: www.cdc.gov/obesity. [Google Scholar]
- 3.Lavie CJ, Milani RV, Ventura HO. Obesity and cardiovascular disease: risk factor, paradox and impact of weight loss. J Am Coll Cardiol. 2009 May;53(21):1925–32. doi: 10.1016/j.jacc.2008.12.068. [DOI] [PubMed] [Google Scholar]
- 4.Van Gaal LF, Mertens IL, De Block CE. Mechanisms linking obesity with cardiovascular disease. Nature. 2006 Dec;444:875–80. doi: 10.1038/nature05487. [DOI] [PubMed] [Google Scholar]
- 5.Klein S, Allison DB, Heymsfield SB, et al. Waist circumference and cardiometabolic risk: a consensus statement from shaping America’s health: association for weight management and obesity prevention. Am J Clin Nutr. 2007 May;85(5):1197–202. doi: 10.1093/ajcn/85.5.1197. [DOI] [PubMed] [Google Scholar]
- 6.Poirier P, Giles TD, Bray GA, et al. Obesity and cardiovascular disease: pathophysiology, evaluation and effect of weight loss. Arterioscler Thromb Vasc Biol. 2006 May;26(5):968–76. doi: 10.1161/01.ATV.0000216787.85457.f3. [DOI] [PubMed] [Google Scholar]
- 7.Hubert HB, Feinleib M, McNamara PM, et al. Obesity as an independent risk factor for cardiovascular disease: a 26-year follow-up of participant in the Framingham heart study. Circulation. 1983;67:968–77. doi: 10.1161/01.cir.67.5.968. [DOI] [PubMed] [Google Scholar]
- 8.Din-Dzietham R, Liu Y, Bielo MV, et al. High blood pressure trends in children and adolescents in national Surveys, 1963 to 2002. Circulation. 2007 Sep;116(13):1488–96. doi: 10.1161/CIRCULATIONAHA.106.683243. [DOI] [PubMed] [Google Scholar]
- 9.Ritchie SA, Connell JM. The link between abdominal obesity, metabolic syndrome and cardiovascular disease. Nutr Metab Cadiovasc Dis. 2007 May;17(4):319–26. doi: 10.1016/j.numecd.2006.07.005. [DOI] [PubMed] [Google Scholar]
- 10.Williams CL, Hayman LL, Daniels SR, et al. Cardiovascular health in childhood: a statement for health professionals from the committee on atherosclerosis, hypertension, and obesity in the young (AHOY) of the council on cardiovascular disease in the young, American Heart Association. Circulation. 2002 Jul;106(1):143–60. doi: 10.1161/01.cir.0000019555.61092.9e. [DOI] [PubMed] [Google Scholar]
- 11.Reinehr T, de Sousa G, Toschke AM, et al. Long-term follow-up of cardiovascular disease risk factor in children after an obesity intervention. Am J Clin Nutr. 2006 Sep;84(3):490–6. doi: 10.1093/ajcn/84.3.490. [DOI] [PubMed] [Google Scholar]
- 12.Mississippi State Department of Health. Obesity and obesity prevention. Jackson, MS: Mississippi State Department of Health; 2011. Available at: http://msdh.ms.gov/msdhsite/_static/43,0,289.html. [Google Scholar]
- 13.SAS Institute Inc. SAS user’s guide: statistics Version. 9.1. Cary, NC: SAS Institute Inc; 2004. [Google Scholar]
- 14.Palisade Corporation. @Risk 4.0: a new standard in risk analysis. Ithaca, NY: Palisade Corporation; 2011. Available at: http://www.palisade.com/risk. [Google Scholar]
- 15.Ward Systems Group. 1993 neuroshell 2 user’s manual. Frederick, MD: Ward Systems Group, Inc; 1993. [Google Scholar]
- 16.Fausett LV. Fundamentals of neural networks: architectures, algorithms, and applications. Upper Saddle River, NJ: Prentice-Hall; 1993. [Google Scholar]
- 17.Yusuf S, Hawken S, Ounopuu S, et al. Obesity and the risk of myocardial infarction in 27,000 participants from 52 countries: a case-control study. Lancet. 2005 Nov;366(9497):1640–9. doi: 10.1016/S0140-6736(05)67663-5. [DOI] [PubMed] [Google Scholar]
- 18.Gungor N, Thompson T, Sutton-Tyrell K, et al. Early signs of cardiovascular disease in youth with obesity and type 2 diabetes. Diabetes Care. 2005 May;28(5):1219–21. doi: 10.2337/diacare.28.5.1219. [DOI] [PMC free article] [PubMed] [Google Scholar]
- 19.Valavanis IK, Mougiakakou SG, Grimaldi KA, et al. A multifactorial analysis of obesity as CVD risk factor: use of neural network based methods in a nutrigenetics context. BMC Bioinformatics. 2010 Sep;11:453. doi: 10.1186/1471-2105-11-453. [DOI] [PMC free article] [PubMed] [Google Scholar]
- 20.U.S. Census Bureau. Censtats database. Washington, DC: U.S. Census Bureau; 2010. Jul, Available at: http://censtats.census.gov/ [Google Scholar]
- 21.Nielsen M, Lundegaard C, Worning P, et al. Reliable prediction of T-cell epitopes using neural network with novel sequence representations. Protein Sci. 2003 May;12(5):1007–17. doi: 10.1110/ps.0239403. [DOI] [PMC free article] [PubMed] [Google Scholar]
- 22.Khan J, Wei JS, Ringner M, et al. Classification and diagnostic prediction of cancers using gene expression profiling and artificial neural networks. Nat Med. 2001 Jun;7(6):673–9. doi: 10.1038/89044. [DOI] [PMC free article] [PubMed] [Google Scholar]
- 23.Smith BA, Hougenboom G, McClendon RW. Artificial neural network for automated year-round temperature prediction. Comp Electron Agric. 2009 Aug;68(1):52–61. [Google Scholar]
- 24.Ahmad HA. Poultry growth modeling using neural networks and simulated data. J Appl Poult Res. 2009;18:440–6. doi: 10.3382/japr.2008-00064. [DOI] [PMC free article] [PubMed] [Google Scholar]
- 25.Ahmad HA, Mariano M. Comparison of forecasting methodologies using egg price as a test case. Poultry Science. 2006;85(4):798–807. doi: 10.1093/ps/85.4.789. [DOI] [PubMed] [Google Scholar]


