

Abstract
Voltage-gated ion channels are crucial for electrical activity and chemical signaling in a variety of cell types. Structure-activity studies involving electrophysiological characterization of mutants are widely used and allow us to quickly realize the energetic effects of a mutation by measuring macroscopic currents and fitting the observed voltage dependence of conductance to a Boltzmann equation. However, such an approach is somewhat limiting, principally because of the inherent assumption that the channel activation is a two-state process. In this analysis, we show that the area delineated by the gating charge displacement curve and its ordinate axis is related to the free energy of activation of a voltage-gated ion channel. We derive a parameter, the median voltage of charge transfer (Vm), which is proportional to this area, and prove that the chemical component of free energy change of a system can be obtained from the knowledge of Vm and the maximum number of charges transferred. Our method is not constrained by the number or connectivity of intermediate states and is applicable to instances in which the observed responses show a multiphasic behavior. We consider various models of ion channel gating with voltage-dependent steps, latent charge movement, inactivation, etc. and discuss the applicability of this approach in each case. Notably, our method estimates a net free energy change of approximately −14 kcal/mol associated with the full-scale activation of the Shaker potassium channel, in contrast to −2 to −3 kcal/mol estimated from a single Boltzmann fit. Our estimate of the net free energy change in the system is consistent with those derived from detailed kinetic models (Zagotta et al. 1994. J. Gen. Physiol. doi:10.1085/jgp.103.2.321). The median voltage method can reliably quantify the magnitude of free energy change associated with activation of a voltage-dependent system from macroscopic equilibrium measurements. This will be particularly useful in scanning mutagenesis experiments.
INTRODUCTION
Voltage-gated ion channels are integral membrane proteins that, upon sensing a change in the membrane electric field, open a passage for ions to flux through the membrane. They are represented in all major kingdoms of life and are crucial for both electrical and chemical signaling pathways in higher organisms (Hille, 2001). Several inherited diseases such as arrhythmias and epilepsies have been shown to be correlated to mutations in these proteins, thereby underscoring their physiological importance (Lehmann-Horn and Jurkat-Rott, 1999). To understand the mechanisms of ion channel gating and function, it is necessary to obtain accurate estimates of energetic effects of site-specific mutations. One widely used approach involves measurements of macroscopic ionic currents for a series of voltage steps from which one can derive the relative fraction of open channel at various potentials (PO-V). These responses show a sigmoidal voltage dependence and are typically characterized by fitting to a single Boltzmann equation. For such a curve, the chemical free energy difference between the open and the closed state is defined by which is characterized by two parameters, z, the Boltzmann slope, and V1/2, which is the voltage that elicits the half-maximal response. This free energy difference is also referred to as the free energy of channel opening at zero voltage.
However, the voltage-gated ion channels are known to transit through several intermediates to reach their final open states (Cole and Moore, 1960; Vandenberg and Bezanilla, 1991; Bezanilla et al., 1994; Zagotta et al., 1994a; Schoppa and Sigworth, 1998). The slope factor, which for a two-state process is the charge translocated, in the case of a multistate process depends not only on the charge displaced during activation but also on stabilities of the intermediate states (McCormack et al., 1991; Sigworth, 1994; Bezanilla, 2000; Villalba-Galea et al., 2008). Thus, mutations that affect only the energies of the intermediate states would generate erroneous values of the net free energy difference between the initial closed and the final open states when derived from Boltzmann fits.
Furthermore, when the central pore opens, the channel molecule has already undergone significant conformational transitions as indicated by separation in the charge-voltage (QV) and conductance-voltage (GV) curves (Armstrong and Bezanilla, 1973; Perozo et al., 1993). Therefore, the free energy associated with the activation process cannot be fully captured from conductance-voltage relationships. Single Boltzmann fits of GV curves for Shaker potassium ion channel give an estimate of −2 to −3 kcal/mol in the chemical free energy difference between the open and closed state (Monks et al., 1999; Li-Smerin et al., 2000a; DeCaen et al., 2008). This estimate, which corresponds to a single hydrogen bond or salt bridge interaction, is surprising and seems to suggest that a single interaction site could tip the balance between the two states.
Finally, calculating the free energy change using single Boltzmann fits becomes even more problematic when mutations result in discernibly multiphasic PO-V curves (Li-Smerin et al., 2000b; Yifrach and MacKinnon, 2002). Boltzmann fits to the PO-V curve also neglect the energetic effect of nonunity values of the maximum open probability, which has been observed in voltage-dependent ion channels (Schoppa et al., 1992). These observations prompted us to carefully analyze the free energy principles associated with a voltage-dependent process at a theoretical level. Our objective was to derive a more general, physically consistent measure of free energy change that is easily obtainable from experimental observables.
In this paper, we analyzed the fundamental basis of free energy change in a voltage-dependent system from the standpoint of classical statistical mechanics. The pioneering work of Wyman and Gill (1990) on theoretical thermodynamics has greatly furthered our understanding of ligand binding equilibria. Of specific interest to us was the concept of median ligand activity. The elegant derivation of Wyman (1964, 1967) shows that from the knowledge of the maximum number of ligands that bind a macromolecule and the median ligand activity, one can obtain an accurate estimate of the mean ligand binding affinity. Here, we adopted a similar approach to analyze the free energy relationships of voltage-dependent ion channels. We found that a comparable parameter, the median voltage of activation, as calculated from the QV curve, can be related to the net chemical free energy change associated with voltage-dependent activation of these proteins. Specifically, this procedure yielded a value of −14.6 kcal/mol associated with full-scale channel activation of the Shaker potassium channels and −16.1 kcal/mol for the voltage-gated sodium channels. We have discussed several characteristic models of ion channel activation such as those with inactivation, cooperativity, voltage-independent steps, latent charge movement between multiple open states, etc. and illustrate the validity and robustness of our proposed method.
MATERIALS AND METHODS
Oocyte expression
The cDNA voltage-gated Shaker potassium channel, with a deletion in the N-terminal region (residues 6–46) and with the W434F mutation, was linearized with NotI (New England Biolabs, Inc.) and in vitro transcribed to generate the mRNA using the mMESSAGE mMACHINE T7 kit (Life Technologies). Stage V Xenopus laevis oocytes were injected with 50.6 nl mRNA (at a concentration of 0.1 µg/µl). After injection, the oocytes were kept at 18°C in a solution containing 100 mM NaCl, 2 mM KCl, 1.8 mM CaCl2, 1 mM MgCl2, 5 mM Hepes, 0.1 mM DTT, and 0.2 mM EDTA, supplemented with 100 µg/ml gentamicin and 100 mg/ml bovine serum albumin. Measurements were performed 1–2 d after injection.
cDNAs of both the α and β subunit of the rNaV1.4 were transcribed as described in the previous paragraph. Equimolar ratios of the α and β subunit mRNAs were coinjected into Xenopus oocytes to a final volume of 50 nl. Injected oocytes were preserved as in the previous paragraph, and measurements were performed 3–5 d after injection.
Gating current measurements
The gating current measurements were performed on a cut-open oocyte voltage clamp set-up (CA-1B; Dagan Corporation) as described previously (Muroi et al., 2010; Lacroix and Bezanilla, 2011). For the potassium channel gating current measurement, the external solution was 115 mM NMG-MES (N-methyl-d-glucamine methanesulfonate), 2 mM Ca-MES, and 10 mM Hepes, pH 7.4. For the sodium channel gating current measurement, the external solution was 115 mM Na-MES, 2 mM Ca-MES, and 10 mM Hepes, pH 7.4. In the latter case, all ionic currents were blocked by the application of 10 µM tetrodotoxin to the external and middle chambers. For both channels, the internal solution was 115 mM NMG-MES, 2 mM EGTA, and 10 mM Hepes, pH 7.4. The recording pipette resistance was 0.3–0.5 MΩ. Analogue signals were sampled at 250 kHz with a Digidata 1440 interface (Molecular Devices) and low-pass filtered at 10 kHz. The capacitive transient currents were subtracted online using the P/4 method with a subtraction holding potential of −120 mV for the potassium channels and 50 mV for the sodium channels. Gating currents were obtained by applying a depolarizing pulse (50 ms for potassium and 20 ms for sodium channels) to voltages from −120 to 10 mV (at 5-mV intervals) for the potassium channels and −160 to 30 mV (at 10-mV intervals) for the sodium channels. The holding potential was −90 mV, and a 50-ms-long pre- and postpulse at −130 mV was used.
Analysis and simulations
Each of the QV curves is a mean obtained from five oocytes. The curve was fitted to various equations as described in the Table 1. Computation of the area was performed using the trapezoid method. In brief, for a fractional gating charge displacement versus voltage (QV) curve, with n points, the area between the curve and the ordinate (Q) axis was calculated as
where Vi is the ith point on the QV curve and Qi is the fraction of charge that is transferred at voltage Vi. Numerical simulations of the different models were performed using MATLAB 2008b (MathWorks).
Table 1.
Estimation of free energy change from QV
| Fitting function | Parameters | Sh-IR W434F | NaV1.4 | ||
| Values | Values | ||||
| a | V1/2 | −45.9 | −3.2 | −56.5 | −1.82 |
| z | 3.03 | 1.4 | |||
| b | V1/2 | −64.6 | −13.93 | −97.15 | −9.63 |
| z | 2.35 | 1.08 | |||
| c | V1/2(1) | −58.2 | −7.07 | −71.6 | −3.92 |
| z1 | 1.99 | 1.1 | |||
| V1/2(2) | −42.4 | −49.64 | |||
| z2 | 4.5 | 1.85 | |||
| d | V1/2(1) | −56.64 | −6.44 | −71.02 | −3.62 |
| z1 | 2.02 | 1.15 | |||
| V1/2(2) | −42.6 | −48.23 | |||
| z2 | 3.89 | 1.58 | |||
| e | Vm | −46.81 | −14.63 | −56.28 | −16.5 |
| Qmax | 13.6 | 12.8 | |||
The table lists the different functions used to fit the QV curve and the values of the corresponding parameters derived from the fits to the QV curves of the Sh-IR W434F and NaV1.4 channels. V1/2 parameters have units in millivolts, and z parameters have units of electronic charges. The free energy changes calculated from each of the fits are also listed (kcal/mol).
A two-state model and the fitting function is a Boltzmann function.
A model where the channel activates in four independent single-step transitions; the fitting function is the fourth power of the Boltzmann function and
A model where the channel activates via two energetically independent steps; the fitting function is the sum of two Boltzmann terms and
A three-state model where the channel activates in two sequential steps;
The free energy change calculated via the median method of channel activation. The Qmax values for each channel was obtained from previously published literature (Schoppa et al., 1992; Hirschberg et al., 1995; Aggarwal and MacKinnon, 1996; Seoh et al., 1996).
RESULTS
Theory
Free energy change in a two-state process is obtained from a Boltzmann fit.
Consider a voltage-dependent ion channel that can exist in two states, closed (C) and open (O). On increasing the voltage, the open state of the channel becomes increasingly populated. The associated free energy difference between the closed and open states can be written as where V is the membrane electric field gradient and is the chemical (nonelectrical) free energy difference between the two states or the free energy change associated with the transition in the absence of an electrical driving force (V = 0). q is the gating charge translocated when the ion channel activates and is responsible for an electrical component in the net free energy change associated with activation. The equilibrium constant for such a transition at any voltage will be
where PO and PC are the fractional occupancy of the open and closed states, respectively, and K0 is the voltage-independent component of the equilibrium constant, which is related to as The voltage-dependent probability of occupancy of the open state, in this situation, will be
Rewriting K0 as exp(−qFV1/2), where V1/2 (Stevens, 1978)is the voltage at which half of the channels are open, PO can be reexpressed as
| (1) |
By fitting an experimentally derived PO-V curve to Eq. 1, one can derive the parameters of the Boltzmann fit, V1/2, and q and thereby estimate as qFV1/2. A similar equation can be derived for the gating charge displacement versus V relation. If a channel can access only two states, the normalized QV and PO-V curves will superimpose on each other. Also, the Boltzmann slope of the curves will equal the exact number of gating charges displaced during channel activation. However, voltage-gated ion channels are known to transit through a large number of intermediates during activation; the experimentally derived PO-V and QV curves do not superpose, with the latter almost always preceding the PO-V curve on the voltage axis. Also the Boltzmann slope of either curve is much lower than the actual amount of gating charge displaced during channel activation (Schoppa et al., 1992; Aggarwal and MacKinnon, 1996; Seoh et al., 1996). Thus, it is likely that free energy estimates of ion channel activation via a Boltzmann fit to activation response are inaccurate.
Area under the activation curve is a measure of the free energy change of activation.
Consider that the voltage-gated ion channel exists in n different conformational states, with each state i associated with a gating charge (or valence), given by
| (2) |
where the summation is over all the charges zj of the channel protein in state i, which are informed principally by the charges on the side chains of specific ionizable residues of the protein. λji is a state-dependent parameter representing the fraction of the membrane electric field sensed by the jth charge of the protein in the state i (Stevens, 1978; Roux, 1997). qi, as described by Eq. 2, essentially governs the voltage dependence of the energy of a given conformational state, Ei, i.e.,
| (3) |
The negative sign in Eq. 3 implies that states with a more positive valence become more stable with increasing voltage.
The mean gating charge of the entire ensemble of conformational states at any given voltage is (Sigworth, 1994)
| (4) |
where Pi(V) is the equilibrium occupancy of the ith state at voltage V, which is assumed to follow a Boltzmann distribution. Thus, where β = 1/kBT and Z is the partition function of the system,
The mean free energy of the ensemble, assuming that temperature is held constant, is
| (5) |
Changing the electrical potential (V) will alter the distribution of the channel states and thus the mean ensemble free energy. At a constant temperature, differentiating Eq. 5 with respect to voltage gives
| (6) |
Now using Eqs. 3 and 4, the differential change in the free energy of the system (Eq. 6) with voltage can be expressed as
| (7) |
Thus, net work done or net change in free energy of the system as the voltage is changed from V1 to V2 can be given by
| (8) |
The gating charge displacement measured when the voltage is switched from a reference voltage (Vref) to a voltage V is essentially the difference Vref is usually a hyperpolarizing voltage when all protein charges are retracted to their initial resting configuration, and, without any loss of generality, can be taken to be 0. Taking V1 as Vref and using V instead of V2, Eq. 8 can be integrated by parts, giving
| (9) |
Suppose gating charge movement is measured experimentally from a hyperpolarizing reference potential, where all the charges are retracted, to a potential V at which all charge movement saturates. Thus at highly depolarized voltages is Qmax, which makes Eq. 9
| (10) |
From Eq. 10, the net free energy change in the process thus comprises two terms: the first (−QmaxV) scales linearly with voltage, and the second component () equals the area between the gating charge displacement versus voltage (QV) curve and the ordinate (Q) axis. A hypothetical QV curve for a voltage-dependent ion channel is shown in Fig. 1 A, where the shaded region represents The linear component is the change in the net electrical energy of the system as it undergoes a complete transformation. The second component, unlike its linear counterpart, is convergent and will be shown to lead to an expression for the net change in the chemical free energy of the system. In the next section, we derive a parameter, the median voltage of activation, which is directly related to
Figure 1.

Free energy measures from a QV curve. (A) A hypothetical normalized QV curve. The vertical dashed line is the V = 0 axis. The shaded area is the integral (), which equals The integral is negative on the left of the V = 0 axis and positive on the right, as indicated by the − and + signs. (B) The same QV curve with the median voltage of charge movement (Vm) marked by the vertical dashed lines. The areas on either side of the Vm axis are equal and are both positive. (C) The QV curve intersected by the V = 0 and V = Vm axes. The area of the shaded rectangle is equal to the sum of the two areas shaded in A, taking their respective signs into consideration.
The median voltage of activation.
According to the definition of median ligand activity proposed by Wyman (1967), we define the median voltage of activation, Vm, as the voltage at which
| (11) |
Also let Qm be the gating charge displacement at Vm.
By definition, is
| (12) |
The integral on the right side of Eq. 12 can be broken down into two integrals:
| (13) |
Integrating each of the two integrals in Eq. 13, by parts, and using the definition of Vm (Eq. 11) and the fact that it can be shown that the integral on the right of Eq. 12 is 0. The result is that
| (14) |
Fig. 1 B shows the QV curve intersected by the V = Vm axis, with the two shaded regions being equal in area. The areas on the right and left of the Vm axis correspond to the integrals on the right and left side of Eq. 11, respectively. The area of the rectangle shaded in Fig. 1 C is equal to the sum of the two areas shaded in Fig. 1 A, taking the sign of the latter areas into consideration.
A physical interpretation of and Vm.
Thus far, we have shown that the area under an experimentally measured QV curve can be separated into two components, a linear and a saturating (converging) component, both being dependent on the total charge moved between the initial and final states of the system. The saturating component, can be described (Eq. 14) by a parameter, the median voltage of activation, given by Eq. 11. In this section we will show that is the change in chemical free energy of the system associated with the activation of the system.
According to Eq. 3, the energy of each state of the system can be written as where is the chemical energy of the ith state. The Boltzmann weight of each of these states can be expressed as Ki exp(qiVβ), where Ki = exp(−Eiβ). We assume that at sufficiently hyperpolarizing voltages, the system occupies just one (reference) state for which qr = 0 and = 0. With this normalization, the Boltzmann weights of the different states become where () is the chemical component of the equilibrium constant of the transition from the reference state to state i. The partition function of the system is now
| (15) |
For our reference state, = 1.
Now we turn to Eq. 11 and rewrite it as
| (16) |
Combining Eqs. 5, 7, and 16, we get
| (17) |
or
| (18) |
At hyperpolarizing voltages (V → −∞), only the reference state will be populated, and thus Dividing the equation by kBT and rewriting QmaxVβ as ln exp(QmaxVβ), where (kBT = 1/β), Eq. 18 becomes
| (19) |
Now, we substitute Z from Eq. 15 into Eq. 19. At very high voltages, all the terms of Z are dominated by the (final) state. Thus, the integral equations, Eqs. 16 and 17, ultimately yield
| (20) |
where is the chemical component of the equilibrium constant for the transition from the reference state to the final state of the system. Two fundamentally crucial points emerge from the relation described in Eq. 20. First, which is equal to QmaxVm, is thus the measure of chemical free energy difference between the initial resting state of the system and the final activated state of the system, i.e., the free energy difference between the initial and final states of the system in the absence of any electric field (0 mV). Second, at Vm, the Boltzmann weight of the fully activated state of the system, is 1, which is same as the Boltzmann weight of the reference state (for which the valence is 0). This implies that at Vm, the state or states where all charge has moved (fully activated) and that where none has moved (fully resting state) are equally populated.
The relations established are independent of the pathway connecting the initial and final states of the system and the number of possible states of the system. Measurement of the QV can thus directly be related to the change in the free energy without elaborate model fitting procedures or assumptions about the nature of the conformational transitions (such as the two-state process assumption required by Boltzmann fits). The relations remain valid even when the QV curves show biphasic or asymmetric behavior. It requires the knowledge of Qmax, which, at least for the voltage-gated potassium (KV) channels, is known with reasonable certainty (Schoppa et al., 1992; Aggarwal and MacKinnon, 1996; Seoh et al., 1996). Thus, at a first level of approximation, the measurement of the median voltage of activation would facilitate a straightforward and accurate calculation of the free energy changes associated with the voltage-dependent activation of any system.
Accuracy of QmaxVm as a measure of free energy change
To compare the free energy values derived from QmaxVm and the Boltzmann fits for real systems, we experimentally recorded the gating currents in the inactivation-removed Shaker W434F potassium channel construct (Sh-IR W434F) and in the voltage-gated sodium channel (NaV1.4), with the ionic currents blocked with tetrodotoxin, and evaluated their normalized QV curves (Fig. 2). V1/2 for each was obtained by fitting the Boltzmann equation (Eq. 1), whereas Vm was obtained by calculating the area between the curve and the Q axis (see Materials and methods). Previously published values of Qmax for each channel (Schoppa et al., 1992; Hirschberg et al., 1995; Aggarwal and MacKinnon, 1996; Seoh et al., 1996) were used for the free energy calculations using the median method. We find that the free energy values computed via the median method were four to eight times the values computed via the Boltzmann method (Table 1).
Figure 2.

QV curves of the Shaker potassium channel and the rNaV1.4 channel. Normalized QV curves for Sh-IR W434F and NaV1.4. Each curve is a mean of independent measurements from five oocytes. The normalized QV curve for the ILT mutant was simulated according to the kinetic model proposed by Ledwell and Aldrich (1999).
Occasionally for potassium channels, the sigmoid activation curves have been fitted to a fourth-power Boltzmann equation (Zagotta et al., 1994b; Smith-Maxwell et al., 1998b; Gonzalez et al., 2000, 2001), assuming that identical conformational changes occur in a single step in each of the four identical voltage-sensors, which “move” independent of the other. This fit provides a much closer value of the free energy change to that obtained from the median method for Sh-IR W434F, but for NaV1.4 the difference between the two estimates continues to be large (Table 1). Fitting the QV curve of NaV1.4 to the product of four nonidentical Boltzmann terms (which takes into consideration the four nonidentical domains of the protein) would be ill constrained. We fitted two other model dependent sigmoidal functions (Perozo et al., 1994; Rodríguez et al., 1998), both of which resulted in free energy estimates significantly different from the median method for Sh-IR W434F as well as NaV1.4 (Table 1).
For the Shaker potassium channel, elaborate multistep kinetic models have been proposed by various groups (Bezanilla et al., 1994; Zagotta et al., 1994a; Schoppa and Sigworth, 1998) based on single channel conductances, gating currents, and macroscopic ionic currents. Here, we consider the model proposed by Zagotta et al. (1994a; ZHA model).
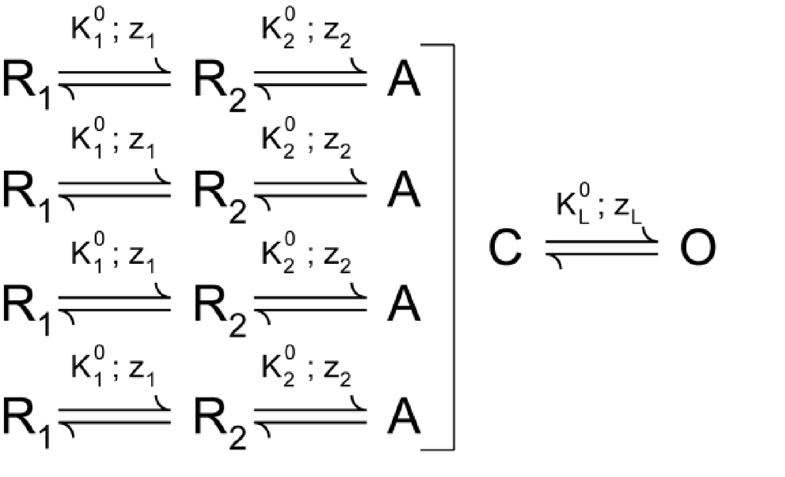 |
(SCHEME 1) |
According to this model, each voltage sensor independently activates in two discrete steps (with equilibrium constants K1 and K2), and when all the voltage-sensors are activated, a concerted transition gates the ion channel pore open (equilibrium constant KL). All the equilibrium constants have an exponential voltage dependence: (i = 1, 2, or L). The net chemical free energy change in going from the reference state to the final open state, will be (Note the use of R, the universal gas constant, instead of kB and the inclusion of Faraday constant [F] in the numerical free energy calculations.) Using the parameters reported, we find that the free energy estimate from the ZHA model parameters and the median method are nearly identical (Table 2). Next, we considered the ILT mutant of the Shaker potassium channel (Smith-Maxwell et al., 1998a; Ledwell and Aldrich, 1999), which is characteristic in that it results in a QV curve with a secondary phase, widely separated from the primary (Fig. 2), and thus cannot be fitted to a Boltzmann curve. However, the value of chemical free energy change for this mutant computed using the median method from the numerically simulated QV curve is again almost the same as that obtained from the kinetic model parameters. The fitting exercise described herein thus shows that the median method is a physically consistent, experimentally feasible method to accurately estimate voltage-dependent energetics in the system.
Table 2.
Comparison of free energy estimates from kinetic models and median method
| Channel | z1 | z2 | zL | Qmax | Vm | QmaxFVm | ||||
| kcal/mol | mV | kcal/mol | ||||||||
| Sh-IR | 3 | 1.8 | 132.07 | 1.4 | 12 | 0.4 | −15.58 | 13.2 | −46.8 | −14.19 |
| ILT | 74.667 | 1.7 | 466.667 | 1.3 | 0.0143 | 1.8 | −22.17 | 13.8 | −67.4 | −21.37 |
The table lists the parameters of the ZHA model for the Sh-IR channel and the ILT mutant. Vm value for the ILT mutant was calculated from the QV curve, generated using the model parameters published previously (Ledwell and Aldrich, 1999; Fig. 2). The Qmax values used in both cases are those specified in the ZHA model.
Free energy estimation using the median method in the case where certain steps are voltage independent
Next we considered models of ion channel activation with voltage-independent steps to illustrate how our inferred energetics can be modified by consideration of such transitions. Let us assume that a voltage-independent transition occurs in the middle of a linear transition pathway, involving six states with the final state being the open state Of (Fig. 3 A, scheme I). Because all of the steps beyond it are voltage driven, as we increase the voltage, the system will be pushed further and further to the right until it finally saturates in Of. For this system, the chemical free energy difference between the initial and final states, will be equal to QmaxVm as described previously (see Theory section A physical interpretation of and Vm).
Figure 3.

Effect of an intermediate voltage-independent step on the free energy estimates. (A) A six-state linear model of activation of a voltage-dependent ion channel with five closed state and a single final open state. The voltage dependence of the equilibrium constants is given by (i = 1, 2, 3, 4, or 5), where is the chemical component of the equilibrium constant Ki and zi is its voltage dependence. The third step (shown in bold) is voltage independent, and thus z3 = 0. is the sum of the chemical free energy change of each of the steps and will equal (B) QmaxFVm is plotted against for different values of log (−5 to 5) and two values of z2 (closed squares, z2 = 5; and open triangles, z2 = 0). The remaining parameters of the model were arbitrarily chosen as = 1, = 75, = 25, = 5, z1 = 2, z3 = 0, z4 = 2.5, and z5 = 1. (C and D) Variation of (C) and Vm (D) with changing values of z2 (0–5) and log
To test this numerically, we generated a large number of QV curves, based on this model, for different values of z2 and The former is the voltage dependence of the equilibrium constant for the second step, and the latter is the equilibrium constant for voltage-independent third step. For this scheme and thus changing z2 alters the maximum gating charge transferred in the process of activation. From each simulated curve, we computed the median voltage of activation, Vm, by integrating the area between the curve and the ordinate (Q) axis (). Plotting QmaxFVm against (Fig. 3 B) shows that they are identical to each other and independent of Qmax. The surface plot of for varying z2 and log (Fig. 3 C) shows that it has logarithmic dependence on and is independent of z2. However, Vm shows a logarithmic dependence on but an inverse dependence on z2 (Fig. 3 D). which is the chemical free energy difference between the final and initial states of the system, will be independent of the magnitude of gating charge translocated between the two states. For a fixed value of Qmax in the system, Vm is linearly related to and both will have a proportional dependence on the equilibrium constants. When Qmax is altered without changing any of the equilibrium constants, remains unchanged, but Vm will be altered because QmaxFVm =
Next, we modified scheme I (Fig. 3 A) by making the last (rather than the middle) step of the pathway voltage independent (Fig. 4 A, scheme II). Now at saturating depolarization, both the final states, C5 and Of, will be occupied, their relative occupancies being determined by the voltage-independent equilibrium constant of the last transition (). Invoking Eq. 19 for scheme II (Fig. 4 A), we see that
| (21) |
Eq. 21 tells us that if the system does not saturate to a single state, QmaxVm reports the change in chemical free energy in taking the system from its initial reference state to a saturating condition, which is an ensemble rather than a single state. This brings us to an important point: there are two nonequivalent definitions of free energy change in the system. One is the change in the free energy of the ensemble, whereas the other is the free energy difference between the unique final and initial states of the system ( which in this case is ). The former is estimated simply via QmaxVm, whereas to estimate the latter, we rewrite Eq. 21:
| (22) |
If is not large, the second logarithmic term in Eq. 22 would have a nonvanishing contribution to the overall equation. In this situation, however, will be equal to This gives
| (23) |
Thus, when the final step is voltage independent, the knowledge of the maximum open probability, along with Qmax and Vm, would let us estimate the net free energy change associated with transferring the channel from its initial state C1 to its final state Of.
Figure 4.

Effect of terminal voltage-independent steps on the free energy estimates. (A) Two six-state linear schemes of voltage-dependent activation of a channel. In both schemes, except for the final transition (in bold), all other steps are voltage dependent. Scheme II has one open state, whereas scheme II has two open states. The voltage dependence of each of the equilibrium parameters in schemes II and III is defined similar to those in scheme I (Fig. 3 A). For schemes II and III, z5 = 0. (B) Results of the numerical simulations performed using scheme II. = 10, z2 = 1.5, z3 = 1, and z5 = 0. The remaining parameters were same as those in scheme I (Fig. 3 A). was varied from 0.001 to 2,097.15. The relation between the free energy difference between the initial and final states, (), and the free energy change in the ensemble, QmaxFVm (closed symbols) and (open symbols), for different values of Adding QmaxFVm and the correction factor, gives , as depicted by the dashed line. (C) values calculated at different values of for scheme II (A).
We illustrate this point through numerical simulations. We calculated the Vm for several QV curves, based on scheme II (Fig. 4 A), using different values of and plotted QmaxFVm against (Fig. 4 B). In each case, we also calculated (Fig. 4 C). Fig. 4 B shows that for large values of QmaxFVm and are identical and is ∼0 (because is ∼1). This is expected because under these conditions, the final saturated state of the ensemble is populated by a single state so that the change in the chemical free energy of the ensemble and the chemical free energy difference between the final and the initial state are equivalent. For smaller values of where < 1, these two free energy measures are different, and the value of increases with increasing difference between the two free energy quantities.
Next, we consider scheme III, which is a six-state linear model with two final open states, the transition between them being voltage independent (Fig. 4 A). For this case, the QmaxVm measure is equal to
| (24) |
This scheme yields = 1, and, as evident from Eq. 24, QmaxVm will be the free energy change of the ensemble but not the chemical free energy difference between the first and last states (). Unlike our previous case (terminal voltage-independent step between a closed and open state), here, the two free energy measures cannot be distinguished using values.
Effects of cooperativity and ion channel inactivation
In the models considered thus far, the median measure of the chemical free energy change of the system correlates well with the model-based estimates. To further check and validate these correlations, we performed numerical simulations on an allosteric model of ion channel activation. Such models have been used with success to understand the voltage-dependent gating of the BK channels (Horrigan and Aldrich, 1999, 2002). We used an MWC model (Monod et al., 1965) for our simulations here.
Consider scheme IV, a 10-state MWC model of ion channel activation as shown in Fig. 5 A. The channel is assumed to comprise four identical voltage-sensing modules and a single pore domain. KV is the equilibrium constant of activation of each of the four voltage-sensing modules, whereas KP is the equilibrium constant of the pore-opening transition. Both of the equilibrium constants are assumed to have an exponential voltage dependence: (i = V, P) where zi reflects the voltage dependence of each transition and is the chemical component of the equilibrium constant of each transition. This model is different from those discussed previously, in part, because of the presence of multiple open states with different valences, which will manifest itself as a latent charge movement between the open states (Sigg and Bezanilla, 1997). θ is the cooperativity parameter that represents the facilitation experienced by the pore-opening process caused by activation of a voltage sensor and vice versa. θ is assumed to be voltage independent. In scheme IV (Fig. 5 A), if all the steps are voltage dependent, the system will start from state C1 at hyperpolarizing voltages and end in state Of at highly depolarizing voltages. The chemical free energy difference between the states C1 and Of, will be given by
Figure 5.

Influence of latent charge movement and cooperativity on inferred energetics. (A) A 10-state MWC cooperative scheme of voltage-dependent ion channel activation. The channel comprises four identical voltage-sensing modules and one pore domain, each capable of existing in two conformations. States Ci and Oi differ in the conformational status of the pore domain, whereas the different Cis and Ois differ among each other in the number of activated voltage-sensing modules (i = 0, 1,…, 4). Activation of the each of the voltage sensors facilitates the opening transition of the pore and vice versa. The number alongside each state indicates its multiplicity. The voltage dependence of the equilibrium constant for activation of the pore and voltage sensors follows the relation (i = V, P). (B) Plot of QmaxFVm against for different values of θ (varied between 5 and 80) and two values of zV (open triangles, zV = 1; closed squares, zV = 3). The other model parameters were chosen to be = 20, = 10−5, and zP = 1.5. Different values of zV lead to different latent charge movement. (C) Plot of QmaxFVm and against for different values of θ (varied between 5 and 80) when zP = 0. The arrow shows the value of θ and beyond which and QmaxFVm deviate. For these simulations, = 20, = 10−5, and zV = 3. in each case was ∼0. Adding QmaxFVm and the correction factor, gives as depicted by the dashed line. (D) Plot of QmaxFVm and against for different values of (varied between 10−5 and 50) when zP = 0. The arrow shows the value of and below which and QmaxFVm deviate. For these simulations, = 20, θ = 20, and zV = 3. in each case was ∼1. Adding QmaxFVm and the correction factor, , gives, as depicted by the dashed line.
We generated several QV curves for scheme IV (Fig. 5 A) with different values of zV and θ when zP is not 0. The free energy change calculated from median voltage of activation in each case was compared with Qmax for scheme IV (Fig. 5 A) is 4zV + zP. The plot of QmaxFVm against (Fig. 5 B) shows that, as long as the pore-opening transition is voltage dependent (zP ≠ 0), the two free energy measures are equal, dependent on θ but independent of Qmax. This illustrates that the presence of multiple open states or latent charge movement between the open states does not limit the applicability of the median method to estimate the chemical free energy change.
When the pore-opening process is voltage independent, at saturating voltages, both states Cf and Of will be populated, their relative proportions being determined by the magnitude of the equilibrium constant, In addition, at hyperpolarizing voltages, both the states C0 and O0 will be populated, their relative proportions being determined by Thus, at both hyperpolarized and depolarized conditions, the system does not exist in a unique state but rather in an ensemble of states. From Eq. 18 and assuming C0 to be our reference state, we see that
| (25) |
In terms of the model parameters for scheme IV (Fig. 5 A), Eq. 25 may be rewritten as
| (26) |
For such an MWC model, at highly depolarized voltages will be whereas at very low hyperpolarizing voltages, will be Using these definitions in Eq. 26, we obtain
| (27) |
For illustration purposes, we compared numerically simulated values of QmaxFVm and in the case when the pore opening is voltage independent (i.e., zP = 0) at different values of the model parameters. When is small (thus, is ∼0), and θ is large, is ∼1 and the two free energy measures are equal (Fig. 5 C). For smaller values of θ, can be obtained by adding the correction factor to QmaxFVm. Alternatively, when both θ and are large (thus, is significant), the deviation between the two free energy measures can be accounted for by the correction factor, (Fig. 5 D). Thus, using the median measure along with the appropriate correction factors, as described in Eq. 27, the chemical free energy difference between the terminal states can be estimated for systems undergoing voltage-dependent activation according to an MWC scheme of activation.
We finally consider the case of channels that undergo inactivation on sustained depolarization (Fig. 6 A, scheme V). The system can be modeled by considering that there are three specialized units, V, P, and I, each capable of existing in two conformations. Conformational change of V (VR to VA) governs the initial voltage-sensing steps of the channel, that of P (PC to PO) is the gate opening transition, and that of I (IR to IA) controls the inactivation process. Scheme IV (Fig. 6 A) has 12 parameters. This cubic model of an inactivating channel can be represented as a nested coupled model as depicted in Fig. 6 B. Each of three structural units has an intrinsic activation constant described by a voltage-independent component, and voltage-dependent zi (where i is V, P, or inact). Additionally there are three coupling parameters, θVP, θPI, and θIV, which are voltage independent and depict the pairwise interactions between the structural units. Each of the 12 parameters of the cubic model (Fig. 6 A) can be uniquely related to the parameters of Fig. 6 B using the principle of microscopic reversibility.
Figure 6.

Influence of inactivation on the median estimate of free energy change. (A) An eight-state model for an inactivating channel. The encircled states represent the initial reference state (VRPCIR, red) and the final state (VAPOIA, black) of the system. In the final state, all of the units of the system are in their activated/open conformations, whereas in the reference state, all are in their resting/closed conformations. The equilibrium constants are assumed to have an exponential voltage dependence, (i = 1, 2,…, 12). (B) An equivalent nested coupled model of inactivation. The conformational transitions in each of the structural units are where i is V, P, or inact. The pairwise coupling parameters, θVP, θPI, and θIV, denote the voltage-independent coupling between units V and P, P and I, and I and V, respectively. The parameters of the cubic model can be related to those of the nested model. For instance, K10 = Kinact and K11 = KinactθPIθIV. (C) Plot of QmaxFVm against for different values of (varied between 0.0001 and 0.0256) and two values of zinact. The remaining parameters were arbitrarily chosen to be = 75, = 1, θVP = 5, θPI = 8, θIV = 100, zV = 3, and zP = 1. Here, (D) Maximum fraction of inactivated channels at depolarizing voltages for different values of
If all of the equilibrium constants in this model have a positive voltage dependence, at highly depolarizing voltages, the system will saturate in the state VAPOIA, whereas at very low voltages, only the initial reference state, VRPCIR, will be populated. QmaxVm (Vm being obtained from the QV curve) will thus be the chemical free energy difference between the initial and final states of the system.
Next, assume that the inactivation process is voltage independent. As a result, all of the equilibrium constants between two connected states differing in the conformation of I (Fig. 6 A) will be voltage independent, i.e., K9, K10, K11, and K12 do not change with voltage. Because all other transitions are voltage dependent, both states VAPOIR and VAPOIA will be populated at depolarized potentials, and at very low voltages, both VRPCIR and VRPCIA will exist. This situation is similar to our description of the MWC model, with voltage-independent pore opening transitions, in that multiple states are populated at both hyperpolarized and depolarized voltages.
Thus, Eq. 18 here transforms to
| (28) |
Thus, Eq. 28 tells us that even in this scenario, QmaxVm is the change in the chemical free energy of the ensemble but not the chemical free energy difference between a unique final and initial states of the system, The latter will be equal to The relation between the two measures of free energy can be expressed as
| (29) |
The maximum fraction of inactivating channels (Imax) in this system, at depolarizing voltages, is In most inactivating ion channels, inactivation is coupled to activation, which would mean that >> Thus, Eq. 29 can be reexpressed as
| (30) |
Eq. 30 is very similar to the relation that we derived for the case when the terminal voltage-dependent opening transition of a noninactivating ion channel is voltage insensitive (Eq. 23; Fig. 4 A, scheme II). The difference between and QmaxVm is small when Imax is close to unity and continues to increase with decreasing values of Imax. These points are illustrated through simulations performed using scheme V (Fig. 6 A). QmaxFVm is plotted against for different values of in two situations, when inactivation is voltage dependent and when it is voltage independent (Fig. 6 C). In the former case, they are equal, whereas in the latter case, they are equal only at relatively large values of where Imax is ∼1 (Fig. 6 D). Thus, our overall proposition that QmaxFVm is the chemical free energy of the ensemble remains valid even in inactivating channels.
DISCUSSION
In summary, we have derived a general expression for the change in the chemical free energy change associated with the activation of a voltage-dependent ion channel, where Qmax is the maximum amount of gating charge displacement, F is the Faraday constant, and Vm is the median voltage of activation estimated from a QV curve. Vm is mathematically defined by Eq. 11. It is the voltage at which the area bounded by the QV curve, Vm axis, and Q = 0 axis becomes equal to that bounded by the QV curve, Vm axis, and the Q = Qmax axis, as depicted pictorially in Fig. 1 B. We have considered various classes of models with cooperativity, voltage-independent transitions, multiple open states, latent charge movement, etc. and discussed the measures of free energy change in each case. We demonstrate that the Vm measure of free energy change is independent of the nature of the transition pathway and of the symmetry relations within the protein (i.e., whether parts of them are identical or not). In some instances where initial or terminal steps of the transition pathway are voltage independent, certain correction factors need to be added to the Vm measure to calculate the free energy difference between the first and last state of the channel. General relations between the median estimates of free energy changes and the chemical free energy differences between the first and last states of the system in six broad classes of ion channel gating models are listed in Table 3.
Table 3.
Relation between and QmaxFVm for ion channel gating models
| Model | Reference state (r) | Final state (f) | Relation |
| Noninactivating; all steps voltage dependent or intermediate step voltage independent | C1 | Of | |
| Noninactivating; last step voltage independent | C1 | Of | |
| Noninactivating; MWC scheme; all steps voltage dependent | C1 | Of | |
| Noninactivating; MWC scheme; allosteric transition voltage independent | C1 | Of | |
| Inactivating; all steps voltage dependent or intermediate step voltage independent | C1 | If | |
| Inactivating; voltage-independent inactivation | C1 | If |
The table lists the relationship between the median measure of free energy (derived from a QV plot) and the chemical free energy difference between the unique initial and final states of the system for six broad classes of gating modes of the ion channel.
Although these relations are fairly general, their application to understand the energetic relationships in ion channels should be performed with careful deliberation of the assumptions on the basis of which the relations are derived and the behavior of the specific system of interest. The median estimate of free energy is no substitute for full quantitative models of channel gating. However, it might serve as a useful check/constraint of the parameters for detail models of ion channel gating. Also, this measured free energy change includes free energy contributions from the intrinsic stabilities of the different structural units as well as interactions between them. Parsing out these individual components via measurement of QV curves alone is not straightforward and might require the application of site-specific measurements along with more detailed analyses such as the recently proposed χ-value analysis (Chowdhury and Chanda, 2010).
The median voltage of charge movement (Vm) is a more accurate and physically meaningful free energy correlate than V1/2. The two parameters will be identical when the QV curve is symmetric, but the difference between them can be easily appreciated in cases in which the QV curve is nonsymmetric and/or shows multiple phases (Perozo et al., 1994; Ledwell and Aldrich, 1999; Tao et al., 2010; Lacroix and Bezanilla, 2011). We estimate that the chemical free energy change for the Shaker potassium channels is approximately −14 kcal/mol, which suggests that most electrical energy is being efficiently used to drive conformational change in the ion channel.
Our derivations establish QV as the direct free energy correlate of the free energy change in a voltage-dependent system. In many instances, PO-V curves have been used to obtain empirical estimates of free energy of activation of voltage-dependent ion channels (Monks et al., 1999; Li-Smerin et al., 2000a; Hackos et al., 2002; Yifrach and MacKinnon, 2002; Sadovsky and Yifrach, 2007). Such energy measures are substantially different from those proposed in this study. Operationally, a PO-V–based estimate of the free energy change can be interpreted as the free energy difference between the ensemble of closed states of the system at the threshold voltage of pore opening and the final ensemble of open states. This also implies that a PO-V curve does not fully capture the activation energetics of a voltage-dependent ion channel that activates in multiple steps.
On a final note, it must be mentioned that, in a case in which the Qmax of a channel is not measured, the energetic effect of a mutation on the activation energetics can be enumerated via the Vm of its QV curve alone, under the assumption that Qmax is unaltered by the mutation. If the QV curve of the mutant channel is symmetric, V1/2 might be used instead of Vm (both will be identical). This implies that considering the Boltzmann slope in the energy terms introduces a theoretical anomaly in the expression for the change in free energy in cases beyond the realm of a two-state approximation. Therefore when Qmax is not measured, an empirical estimate of the energetic effect of a mutation on the voltage-gated ion channel can be assessed simply via comparison of the Vm value of its QV curve with that of a control (Soler-Llavina et al., 2006; Gagnon and Bezanilla, 2010; Muroi et al., 2010; Xu et al., 2010). The obvious caveats to this approach are cases in which mutations affect Qmax. In such scenarios, to quantify the magnitude of energetic perturbation, apart from the QV curve, Qmax for each charge-altering mutation needs to be measured separately.
Acknowledgments
We thank Deborah L. Capes for providing the gating current data for the rNaV1.4 channels and Dr. Meyer Jackson and Dr. Marcel Goldschen for their valuable comments.
This project was supported by funds from the National Institutes of Health (grant GM084140) and the Shaw Scientist Award to B. Chanda.
Christopher Miller served as editor.
References
- Aggarwal S.K., MacKinnon R. 1996. Contribution of the S4 segment to gating charge in the Shaker K+ channel. Neuron. 16:1169–1177 10.1016/S0896-6273(00)80143-9 [DOI] [PubMed] [Google Scholar]
- Armstrong C.M., Bezanilla F. 1973. Currents related to movement of the gating particles of the sodium channels. Nature. 242:459–461 10.1038/242459a0 [DOI] [PubMed] [Google Scholar]
- Bezanilla F. 2000. The voltage sensor in voltage-dependent ion channels. Physiol. Rev. 80:555–592 [DOI] [PubMed] [Google Scholar]
- Bezanilla F., Perozo E., Stefani E. 1994. Gating of Shaker K+ channels: II. The components of gating currents and a model of channel activation. Biophys. J. 66:1011–1021 10.1016/S0006-3495(94)80882-3 [DOI] [PMC free article] [PubMed] [Google Scholar]
- Chowdhury S., Chanda B. 2010. Deconstructing thermodynamic parameters of a coupled system from site-specific observables. Proc. Natl. Acad. Sci. USA. 107:18856–18861 10.1073/pnas.1003609107 [DOI] [PMC free article] [PubMed] [Google Scholar]
- Cole K.S., Moore J.W. 1960. Potassium ion current in the squid giant axon: dynamic characteristic. Biophys. J. 1:1–14 10.1016/S0006-3495(60)86871-3 [DOI] [PMC free article] [PubMed] [Google Scholar]
- DeCaen P.G., Yarov-Yarovoy V., Zhao Y., Scheuer T., Catterall W.A. 2008. Disulfide locking a sodium channel voltage sensor reveals ion pair formation during activation. Proc. Natl. Acad. Sci. USA. 105:15142–15147 10.1073/pnas.0806486105 [DOI] [PMC free article] [PubMed] [Google Scholar]
- Gagnon D.G., Bezanilla F. 2010. The contribution of individual subunits to the coupling of the voltage sensor to pore opening in Shaker K channels: effect of ILT mutations in heterotetramers. J. Gen. Physiol. 136:555–568 10.1085/jgp.201010487 [DOI] [PMC free article] [PubMed] [Google Scholar]
- Gonzalez C., Rosenman E., Bezanilla F., Alvarez O., Latorre R. 2000. Modulation of the Shaker K+ channel gating kinetics by the S3–S4 linker. J. Gen. Physiol. 115:193–208 10.1085/jgp.115.2.193 [DOI] [PMC free article] [PubMed] [Google Scholar]
- Gonzalez C., Rosenman E., Bezanilla F., Alvarez O., Latorre R. 2001. Periodic perturbations in Shaker K+ channel gating kinetics by deletions in the S3-S4 linker. Proc. Natl. Acad. Sci. USA. 98:9617–9623 10.1073/pnas.171306298 [DOI] [PMC free article] [PubMed] [Google Scholar]
- Hackos D.H., Chang T.H., Swartz K.J. 2002. Scanning the intracellular S6 activation gate in the shaker K+ channel. J. Gen. Physiol. 119:521–532 10.1085/jgp.20028569 [DOI] [PMC free article] [PubMed] [Google Scholar]
- Hille B. 2001. Ion Channels of Excitable Membranes. Third edition Sinauer Associates, Sunderland: 814 pp [Google Scholar]
- Hirschberg B., Rovner A., Lieberman M., Patlak J. 1995. Transfer of twelve charges is needed to open skeletal muscle Na+ channels. J. Gen. Physiol. 106:1053–1068 10.1085/jgp.106.6.1053 [DOI] [PMC free article] [PubMed] [Google Scholar]
- Horrigan F.T., Aldrich R.W. 1999. Allosteric voltage gating of potassium channels II. Mslo channel gating charge movement in the absence of Ca2+. J. Gen. Physiol. 114:305–336 10.1085/jgp.114.2.305 [DOI] [PMC free article] [PubMed] [Google Scholar]
- Horrigan F.T., Aldrich R.W. 2002. Coupling between voltage sensor activation, Ca2+ binding and channel opening in large conductance (BK) potassium channels. J. Gen. Physiol. 120:267–305 10.1085/jgp.20028605 [DOI] [PMC free article] [PubMed] [Google Scholar]
- Lacroix J.J., Bezanilla F. 2011. Control of a final gating charge transition by a hydrophobic residue in the S2 segment of a K+ channel voltage sensor. Proc. Natl. Acad. Sci. USA. 108:6444–6449 10.1073/pnas.1103397108 [DOI] [PMC free article] [PubMed] [Google Scholar]
- Ledwell J.L., Aldrich R.W. 1999. Mutations in the S4 region isolate the final voltage-dependent cooperative step in potassium channel activation. J. Gen. Physiol. 113:389–414 10.1085/jgp.113.3.389 [DOI] [PMC free article] [PubMed] [Google Scholar]
- Lehmann-Horn F., Jurkat-Rott K. 1999. Voltage-gated ion channels and hereditary disease. Physiol. Rev. 79:1317–1372 [DOI] [PubMed] [Google Scholar]
- Li-Smerin Y., Hackos D.H., Swartz K.J. 2000a. α-Helical structural elements within the voltage-sensing domains of a K+ channel. J. Gen. Physiol. 115:33–50 10.1085/jgp.115.1.33 [DOI] [PMC free article] [PubMed] [Google Scholar]
- Li-Smerin Y., Hackos D.H., Swartz K.J. 2000b. A localized interaction surface for voltage-sensing domains on the pore domain of a K+ channel. Neuron. 25:411–423 10.1016/S0896-6273(00)80904-6 [DOI] [PubMed] [Google Scholar]
- McCormack K., Tanouye M.A., Iverson L.E., Lin J.W., Ramaswami M., McCormack T., Campanelli J.T., Mathew M.K., Rudy B. 1991. A role for hydrophobic residues in the voltage-dependent gating of Shaker K+ channels. Proc. Natl. Acad. Sci. USA. 88:2931–2935 10.1073/pnas.88.7.2931 [DOI] [PMC free article] [PubMed] [Google Scholar]
- Monks S.A., Needleman D.J., Miller C. 1999. Helical structure and packing orientation of the S2 segment in the Shaker K+ channel. J. Gen. Physiol. 113:415–423 10.1085/jgp.113.3.415 [DOI] [PMC free article] [PubMed] [Google Scholar]
- Monod J., Wyman J., Changeux J.P. 1965. On the nature of allosteric transitions: A plausible model. J. Mol. Biol. 12:88–118 10.1016/S0022-2836(65)80285-6 [DOI] [PubMed] [Google Scholar]
- Muroi Y., Arcisio-Miranda M., Chowdhury S., Chanda B. 2010. Molecular determinants of coupling between the domain III voltage sensor and pore of a sodium channel. Nat. Struct. Mol. Biol. 17:230–237 10.1038/nsmb.1749 [DOI] [PMC free article] [PubMed] [Google Scholar]
- Perozo E., MacKinnon R., Bezanilla F., Stefani E. 1993. Gating currents from a nonconducting mutant reveal open-closed conformations in Shaker K+ channels. Neuron. 11:353–358 10.1016/0896-6273(93)90190-3 [DOI] [PubMed] [Google Scholar]
- Perozo E., Santacruz-Toloza L., Stefani E., Bezanilla F., Papazian D.M. 1994. S4 mutations alter gating currents of Shaker K channels. Biophys. J. 66:345–354 10.1016/S0006-3495(94)80783-0 [DOI] [PMC free article] [PubMed] [Google Scholar]
- Rodríguez B.M., Sigg D., Bezanilla F. 1998. Voltage gating of Shaker K+ channels. The effect of temperature on ionic and gating currents. J. Gen. Physiol. 112:223–242 10.1085/jgp.112.TT2.223 [DOI] [PMC free article] [PubMed] [Google Scholar]
- Roux B. 1997. Influence of the membrane potential on the free energy of an intrinsic protein. Biophys. J. 73:2980–2989 10.1016/S0006-3495(97)78327-9 [DOI] [PMC free article] [PubMed] [Google Scholar]
- Sadovsky E., Yifrach O. 2007. Principles underlying energetic coupling along an allosteric communication trajectory of a voltage-activated K+ channel. Proc. Natl. Acad. Sci. USA. 104:19813–19818 10.1073/pnas.0708120104 [DOI] [PMC free article] [PubMed] [Google Scholar]
- Schoppa N.E., Sigworth F.J. 1998. Activation of Shaker potassium channels. III. An activation gating model for wild-type and V2 mutant channels. J. Gen. Physiol. 111:313–342 10.1085/jgp.111.2.313 [DOI] [PMC free article] [PubMed] [Google Scholar]
- Schoppa N.E., McCormack K., Tanouye M.A., Sigworth F.J. 1992. The size of gating charge in wild-type and mutant Shaker potassium channels. Science. 255:1712–1715 10.1126/science.1553560 [DOI] [PubMed] [Google Scholar]
- Seoh S.A., Sigg D., Papazian D.M., Bezanilla F. 1996. Voltage-sensing residues in the S2 and S4 segments of the Shaker K+ channel. Neuron. 16:1159–1167 10.1016/S0896-6273(00)80142-7 [DOI] [PubMed] [Google Scholar]
- Sigg D., Bezanilla F. 1997. Total charge movement per channel. The relation between gating charge displacement and the voltage sensitivity of activation. J. Gen. Physiol. 109:27–39 10.1085/jgp.109.1.27 [DOI] [PMC free article] [PubMed] [Google Scholar]
- Sigworth F.J. 1994. Voltage gating of ion channels. Q. Rev. Biophys. 27:1–40 10.1017/S0033583500002894 [DOI] [PubMed] [Google Scholar]
- Smith-Maxwell C.J., Ledwell J.L., Aldrich R.W. 1998a. Role of the S4 in cooperativity of voltage-dependent potassium channel activation. J. Gen. Physiol. 111:399–420 10.1085/jgp.111.3.399 [DOI] [PMC free article] [PubMed] [Google Scholar]
- Smith-Maxwell C.J., Ledwell J.L., Aldrich R.W. 1998b. Uncharged S4 residues and cooperativity in voltage-dependent potassium channel activation. J. Gen. Physiol. 111:421–439 10.1085/jgp.111.3.421 [DOI] [PMC free article] [PubMed] [Google Scholar]
- Soler-Llavina G.J., Chang T.H., Swartz K.J. 2006. Functional interactions at the interface between voltage-sensing and pore domains in the Shaker K(v) channel. Neuron. 52:623–634 10.1016/j.neuron.2006.10.005 [DOI] [PubMed] [Google Scholar]
- Stevens C.F. 1978. Interactions between intrinsic membrane protein and electric field. An approach to studying nerve excitability. Biophys. J. 22:295–306 10.1016/S0006-3495(78)85490-3 [DOI] [PMC free article] [PubMed] [Google Scholar]
- Tao X., Lee A., Limapichat W., Dougherty D.A., MacKinnon R. 2010. A gating charge transfer center in voltage sensors. Science. 328:67–73 10.1126/science.1185954 [DOI] [PMC free article] [PubMed] [Google Scholar]
- Vandenberg C.A., Bezanilla F. 1991. A sodium channel gating model based on single channel, macroscopic ionic, and gating currents in the squid giant axon. Biophys. J. 60:1511–1533 10.1016/S0006-3495(91)82186-5 [DOI] [PMC free article] [PubMed] [Google Scholar]
- Villalba-Galea C.A., Sandtner W., Starace D.M., Bezanilla F. 2008. S4-based voltage sensors have three major conformations. Proc. Natl. Acad. Sci. USA. 105:17600–17607 10.1073/pnas.0807387105 [DOI] [PMC free article] [PubMed] [Google Scholar]
- Wyman J., Jr 1964. Linked functions and reciprocal effects in hemoglobin: A second look. Adv. Protein Chem. 19:223–286 10.1016/S0065-3233(08)60190-4 [DOI] [PubMed] [Google Scholar]
- Wyman J. 1967. Allosteric linkage. J. Am. Chem. Soc. 89:2202–2218 10.1021/ja00985a037 [DOI] [Google Scholar]
- Wyman J., Gill S.J. 1990. Binding and Linkage: Functional Chemistry of Biological Macromolecules. University Science Books, Mill Valley, CA: 330 pp [Google Scholar]
- Xu Y., Ramu Y., Lu Z. 2010. A shaker K+ channel with a miniature engineered voltage sensor. Cell. 142:580–589 10.1016/j.cell.2010.07.013 [DOI] [PMC free article] [PubMed] [Google Scholar]
- Yifrach O., MacKinnon R. 2002. Energetics of pore opening in a voltage-gated K(+) channel. Cell. 111:231–239 10.1016/S0092-8674(02)01013-9 [DOI] [PubMed] [Google Scholar]
- Zagotta W.N., Hoshi T., Aldrich R.W. 1994a. Shaker potassium channel gating. III: Evaluation of kinetic models for activation. J. Gen. Physiol. 103:321–362 10.1085/jgp.103.2.321 [DOI] [PMC free article] [PubMed] [Google Scholar]
- Zagotta W.N., Hoshi T., Dittman J., Aldrich R.W. 1994b. Shaker potassium channel gating. II: Transitions in the activation pathway. J. Gen. Physiol. 103:279–319 10.1085/jgp.103.2.279 [DOI] [PMC free article] [PubMed] [Google Scholar]