Abstract
For centuries, traditional agricultural systems have contributed to food and livelihood security throughout the world. Recognizing the ecological legacy in the traditional agricultural systems may help us develop novel sustainable agriculture. We examine how rice–fish coculture (RF), which has been designated a “globally important agricultural heritage system,” has been maintained for over 1,200 y in south China. A field survey demonstrated that although rice yield and rice-yield stability are similar in RF and rice monoculture (RM), RF requires 68% less pesticide and 24% less chemical fertilizer than RM. A field experiment confirmed this result. We documented that a mutually beneficial relationship between rice and fish develops in RF: Fish reduce rice pests and rice favors fish by moderating the water environment. This positive relationship between rice and fish reduces the need for pesticides in RF. Our results also indicate a complementary use of nitrogen (N) between rice and fish in RF, resulting in low N fertilizer application and low N release into the environment. These findings provide unique insights into how positive interactions and complementary use of resource between species generate emergent ecosystem properties and how modern agricultural systems might be improved by exploiting synergies between species.
Global food security is becoming an acute problem because of the increasing world population (1), the limitation of agricultural resources (e.g., land and water) (2), and the effects of global climate change on crop production (3, 4). World agriculture currently faces great challenges in producing sufficient food while minimizing the negative environmental effects of crop cultivation.
In the past 50 y, crop yields have substantially increased, mainly resulting from the use of chemical fertilizers and pesticides, the development of new crop varieties, and the improvement in cultivation methods. The heavy application of chemical fertilizers and pesticides for long periods, however, negatively affects the environment, induces pest resistance to pesticides, and increases agricultural costs (5, 6). As a consequence, modern agriculture now requires “rethinking” (1, 7), and such rethinking should include reconsideration of traditional agricultural systems (8–10).
For many centuries, traditional agricultural systems have contributed to food and livelihood security throughout the world (8). Because traditional agricultural systems have been created, shaped, and maintained by generations of farmers who used management practices that were matched to local conditions, and because these systems are based on diverse species and species interactions, traditional agricultural systems reflect a successful adaptation to different environments and are rich in biological diversity (8, 11, 12). The recognition of the ecological legacy of these traditional agricultural systems and the integration of these unique experiences into our future farm designs could help us to develop more sustainable agriculture. In fact, studies of such traditional systems have already helped scientists create novel farm designs (5, 13–15).
During the recent expansion of modern agriculture based on substantial inputs of fertilizer and pesticides, however, many of these traditional agriculture systems have been disappearing (8). To preserve these important agriculture systems, the Food and Agriculture Organization, the United Nations Development Program, and the Global Environment Facility developed a program for “globally important agricultural heritage systems (GIAHS)” in 2005 (http://www.fao.org/nr/giahs/giahs-home/en/) (16). One of these GIAHS is the rice–fish coculture system that has been practiced by farmers in south Zhejiang province, China, for >1,200 y (17).
In this rice–fish coculture system, the fish is an indigenous, red, soft-scaled common carp (Cypinius carpia color var.) with high genetic diversity (18, 19). The rice varieties in the system have been changing over time. In the last decade, high-yielding hybrid rice varieties have been dominant (20). The rice–fish coculture is considered a sustainable form of agriculture because it maximizes the benefits of scarce land and water resources by using relatively few chemical inputs, by producing both carbohydrate and protein products, and by conserving biodiversity (20–24). Despite other changes resulting from rapid development over the last 30 y in China, farmers continue to practice rice–fish coculture, in part because this system is an important component of traditional culture and local customs (e.g., rice–fish festivals) (21). Although the value of the rice–fish coculture has been recognized (for example, by its inclusion in the GIAHS project), the ecological mechanisms underlying the system have not been studied in depth.
The main purpose of our present study was to estimate the ecosystem stability of this rice–fish system and to determine how the stability is maintained. Our hypothesis is that the stability of this system results from mutually beneficial relationships between rice and fish. The study was conducted at the GIAHS pilot site of the rice–fish system in China (SI Text, section S1, and Fig. S1).
Results
Quantity and Temporal Stability of Rice Yield in Rice–Fish Coculture.
We compared ecosystem stability of rice monoculture (RM) and rice–fish coculture (RF) with a farmer field survey and a field experiment. The temporal stability of rice yield was measured as the degree of constancy of yield around its mean over the same time interval (25). In the survey of farmer fields, we determined the temporal stability of rice yield with data collected annually from 31 sampling units (each unit containing 3–5 subsamples) during 2005–2010. In the field experiment (experiment 1), we determined the temporal stability of rice yield with data from each experimental plot during 2006–2010.
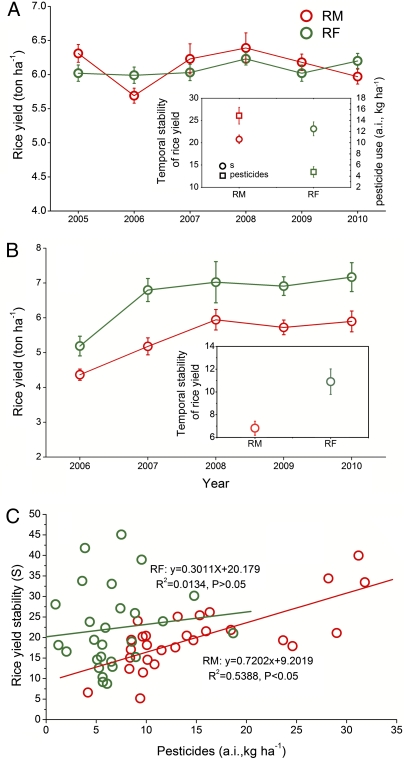
Survey results from farmer fields showed that rice yield did not differ between RM and RF over the 6 y (Fig. 1A, F1,60 = 0.092, P = 0.763) but that the temporal stability of rice yield was higher in RF than in RM (Fig. 1A, F1,61 = 7.031, P = 0.013). There were 68% more pesticides (F1,60 = 514.360, P = 0.000) (Fig. 1A) and 24% more fertilizers (F1,60 = 132.228, P = 0.000) (Table S1) used in RM than in RF. Pesticide application was also more variable in RM than in RF (F1,61 = 112.069, P = 0.001) (Table S1).
Fig. 1.
Rice yield and stability of rice yield (S) in rice monoculture (RM) and rice–fish coculture (RF). (A) Rice yield and S and pesticide use (Inset) in a field survey. (B) Rice yield and S (Inset) in experiment 1. (C) The relationship between S and the use of pesticides as determined in the survey. a.i., active ingredient. Error bars are SE.
In the field experiment (experiment 1), in which pesticides were not applied, rice yield (F1,30 = 29.876, P = 0.001) and temporal stability of rice yield (F1,6 = 6.691, P = 0.04) were both higher in RF than in RM (Fig. 1B).
Many factors can cause temporal variation in rice yield including year-to-year changes in climate, pest incidence, use of new rice varieties, and fertilizer rate (26, 27). During our study, paired farmer fields in the survey and plots in field experiment 1 did not change in rice variety, irrigation scheme, and fertilization level (20, 23) (Table S1). In addition, weather (temperature, precipitation, and relative humidity) during the rice growing seasons did not vary widely over the 6 y (Fig. S2). In the survey, the factor that varied most was quantity of pesticides (Fig. 1A and Table S1), which may be due to the substantial year-to-year variation in the abundance of rice pests (Fig. 2 and Fig. S3). Hence, the relationship between the temporal stability and the quantity of pesticides used in the 6-y period was analyzed. We found that the temporal stability of rice yield was positively correlated with the quantity of pesticides applied in RM (R2 = 0.526, P = 0.001, n = 31) but not in RF (R2 = 0.104, P = 0.077, n = 31) (Fig. 1C). The results indicate that temporal stability of rice yield in RM may largely depend on pesticides and that the greater stability in RF than in RM may partly depend on the presence of fish.
Fig. 2.
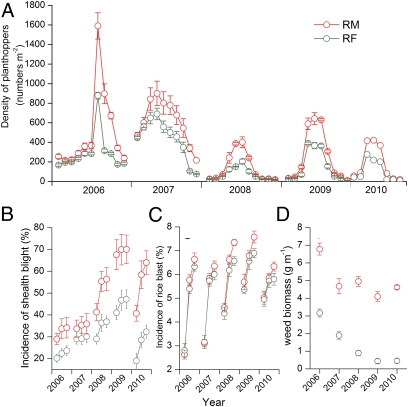
Rice pests in rice monoculture (RM) and rice-fish coculture (RF) in experiment 1. (A) Density of rice planthoppers. (B) Sheath blight incidence. (C) Rice blast incidence. (D) Weed infestation. Error bars are SE.
Occurrence of Rice Pests in Rice–Fish Coculture (Experiment 1).
To test why RF can maintain the same yield stability as RM with low pesticides, we examined the occurrence of insect pests, diseases, and weeds of rice in a 5-y field experiment without pesticide application. We found that rice planthoppers (including Nilaparvata lugen, Sogatella furcifera, and Laodelphax striatellus) were more abundant in RM than in RF during the outbreak period of rice planthoppers (from late August to early September of each year) (P < 0.05, Fig. 2A), although the abundances of the rice stem borer [Chilo supperssalis (Walker)] (F1,30 = 0.166, P = 0.687) and the rice leaf roller (Cnaphalocrocis medinalis Guenee) (F1,30 = 0.011, P = 0.918), which mainly attack the upper part of the rice plants, did not significantly differ between RM and RF in experiment 1 (Fig. S4 A and B).
Rice sheath blight [caused by Thanatephorus cucumeris (Frank) Donk] and rice blast (caused by Pyricutaria oryzae Cav.) are important rice diseases in this area. Incidence of rice sheath blight was higher in RM than in RF (F1,30 = 11.706, P = 0.002, Fig. 2B). Rice blast incidence did not differ (F1,30 = 2.714, P = 0.110) between RM and RF in the early growing season (from June to early August, when leaf area was small), but the incidence was higher in RM than in RF (F1,30 = 12.992, P = 0.023) in the later growing period (from late August to early September) (Fig. 2C). Weed biomass was significantly lower (F1,30 = 9.915, P = 0.004) in RF than in RM in experiment 1 (Fig. 2D).
Removal of Rice Planthoppers by Fish Activity (Experiment 1).
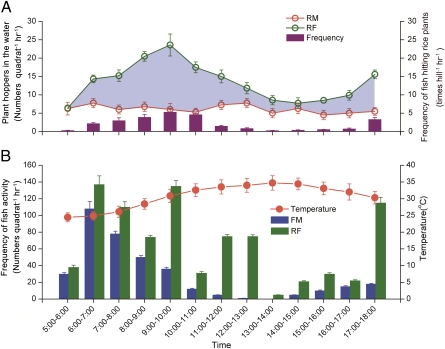
Because we noticed that planthoppers often fell into the water when fish hit the rice stems, we reasoned that the reduction of planthoppers in RF was due to the fish activity. To quantify this effect, we established quadrats that contained four rice hills in both RM (without fish hitting rice plants) and RF (with fish hitting rice plants). Video recordings of the quadrats were used to quantify the number of times that fish hit the rice stems in RF. In addition, the rice planthoppers that fell onto the water surface in RF and RM were counted (SI Text, section S2, and Fig. S5). The video recording of the RF quadrats indicated 26.8 ± 2.4 hits per rice hill per day (from early morning 5:00 AM to evening 6:00 PM) and that the peak in hitting occurred from early morning 6:00 AM to late morning 11:00 AM (Fig. 3A). The number of rice planthoppers that dropped to the water surface per day (from early morning 5:00 AM to evening 6:00 PM) was 79 ± 6 per RM quadrat and 174 ±15 per RF quadrat (Fig. 3A).
Fig. 3.
Fish activity and rice planthopper removal in experiment 1. (A) Frequency at which fish hit rice plants (bars, hits per hill per hour) and total numbers of rice planthoppers (lines, numbers per quadrat) collected from the quadrats B and D (Fig. S5). Shading between the lines indicates the numbers of planthoppers falling into the water, presumably because of fish activity. (B) Frequency of fish (bars) occurring in quadrats A and C (SI Text, section S2, and Fig. S5) in rice–fish coculture (RF) and fish monoculture (FM), and air temperature (line) in experiment 1. Error bars are SE.
We estimated the numbers of planthoppers that fell into the water in 1 d because of fish activity in RF. To do this, we reasoned that rice planthoppers fell onto the water surface in RM because of “nonfish” effects (probably wind), and we assumed that nonfish effects were the same in RM and RF. Thus, we calculated the numbers of rice planthoppers that fell into the water because of fish activity by subtracting the numbers collected from the water surface in RM quadrats from those collected from the water surface in RF quadrats (SI Text, section S2). On the basis of subtraction and as indicated by the shading in Fig. 3A, a mean of 96 ± 8 rice planthoppers per RF quadrat per day was removed from rice plants as a consequence of fish hitting the rice stems. When these data were collected, there were 117 ± 13 and 91 ± 8 planthoppers per hill on rice plants in RM and RF, respectively. For RF, the total number in a quadrat at the time of observation was 364 ± 33 (91 ± 8 per hill × 4 hills per quadrat). The removal rate of rice planthoppers by fish was calculated by dividing the number removed by fish by the total number of rice planthoppers in a quadrat (SI Text, section S2). Thus, the removal rate of rice planthoppers by fish was ∼26 ± 2%.
Activities of Fish in Rice–Fish Coculture (Experiment 1).
To test whether the activity of fish living with rice differs from the activity of fish living without rice, we monitored and compared the activities of fish in RF and fish monoculture (FM) (SI Text, section S2, and Fig. S5). On the basis of video recordings, fish were more active in RF than in FM in a day (F1,42 = 9.754, P = 0.003) (Fig. 3B). Between 12:00 PM and 2:00 PM (early afternoon), no swimming and feeding activity was observed in FM but substantial activity was observed in RF (Fig. 3B).
Microenvironment in Rice Fields (Experiment 1).
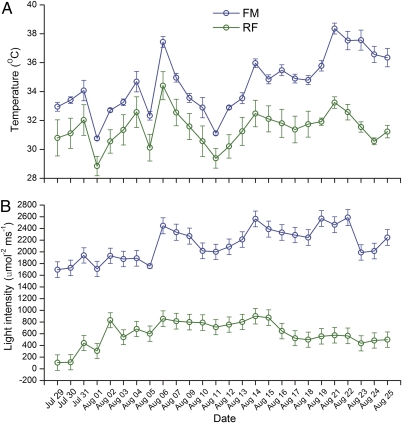
To determine why fish were more active in RF than in FM, we compared the field environment in RF and FM (without rice). From July 29 to August 18, 2007 (which were sunny days and were the hottest days in the study area during that year), the surface water temperature (Fig. 4A, F1,6 = 437.587, P = 0.000) and light density (Fig. 4B, F1,6 = 254.531, P = 0.000) from 12:00 PM to 2:00 PM were significantly higher in FM than in RF.
Fig. 4.
Temperature of surface water (A) and light intensity under the rice plant canopy (B) in experiment 1. RF, rice–fish coculture; FM, fish monoculture.
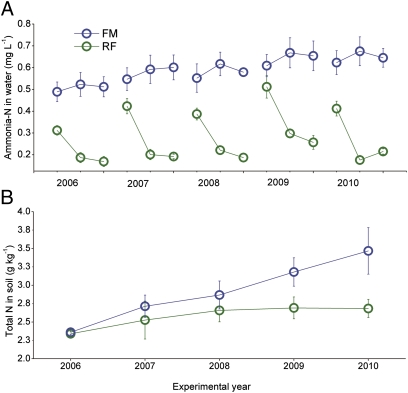
Ammonia-N levels in water were significantly lower in RF than in FM during the rice growing season (F1,30 = 10.620, P = 0.000, Fig. 5A). Total N in soil tended to increase in FM but did not substantially change in RF during the 5-y experiment (Fig. 5B). Total N in soil accumulated over time in FM and was greater than in RF at the end of the experiment (Fig. 5B, F1,30 = 2.783, P = 0.044).
Fig. 5.
Ammonium N in water (A) and total N in soil (B) in experiment 1. RF, rice–fish coculture; FM, fish monoculture. Error bars are SE.
Nitrogen (N) Use Efficiency (Experiment 2).
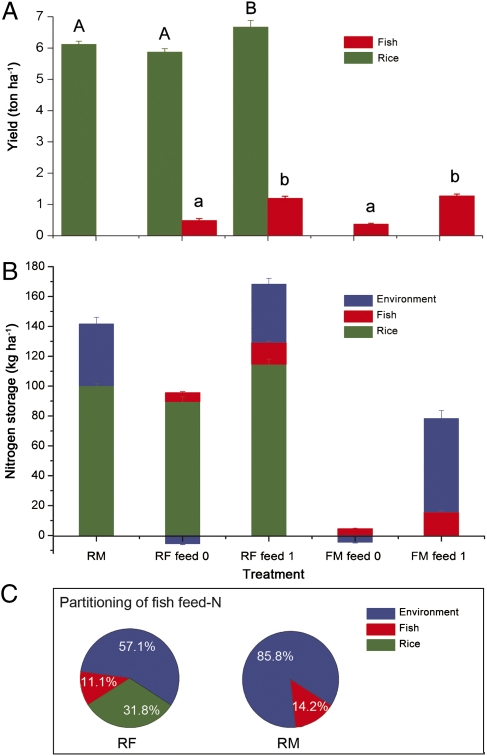
To test why coculture of rice and fish can also reduce the use of N fertilizers in RF as indicated in the field survey (Table S1), we conducted an experiment to examine the fate of input N in RM, RF, and FM systems. We found that rice yield was significantly higher in RF plots with fish feed input than in RF plots without feed input (Fig. 6A, F2, 11 = 6.566, P = 0.031). Rice yield also tended to be higher in RF plots with feed than in RM plots, even though N input was 36.5% higher in the RM plots than in the RF plots with fish feed (Fig. 6A). Fish feed input significantly increased fish yield in both FM and RF plots (Fig. 6A, F3,15 = 22.545, P = 0.001).
Fig. 6.
(A–C) Yield of rice and fish (A), N balance (B), and the fate of N input (C) in experiment 2. Bars in B show balance of N input and output in RM, RF without fish feed (RF feed 0), RF with fish feed (RF feed 1), FM without feed (FM feed 0), and FM with feed application (FM feed 1). A negative value for N in the environment means that some fraction of N in rice or fish was from the environment, and a positive value for N in the environment means that some portion of the input N was not used by rice and fish but remained in the field. Pie charts in C show partitioning of N derived from fish feed in harvested rice, harvested fish, and the environment in RF and FM (e.g., 11.1% and 14.2% of the N supplied by fish feed was estimated to be contained in fish in RF and FM, respectively). The calculations for the balance of N output and input within each system (RM, RF, or FM) are described in SI Text, section S5. The calculations used to determine the fate of N are described in SI Text, section S6. In A, means for rice yield with the same uppercase letter or means for fish yield with the same lowercase letter are not significantly different (P > 0.05). RM, rice monoculture; RF, rice–fish coculture; FM, fish monoculture. Error bars are SE.
Only 11.1% and 14.2% of the N in fish feed was assimilated into fish bodies in RF and FM, respectively (Fig. 6C). In RF, however, rice plants used the unconsumed N in fish feed and reduced fish feed N in the environment (i.e., in soil and water) (Fig. 6B). A comparison of RF with and without fish feed indicated that 31.8% of the N contained in rice grain and straw was from fish feed (Fig. 6C). Subtraction of the fish N in RF from the fish N in FM indicated that 2.1% of the fertilizer N was assimilated into fish bodies in the RF.
Discussion
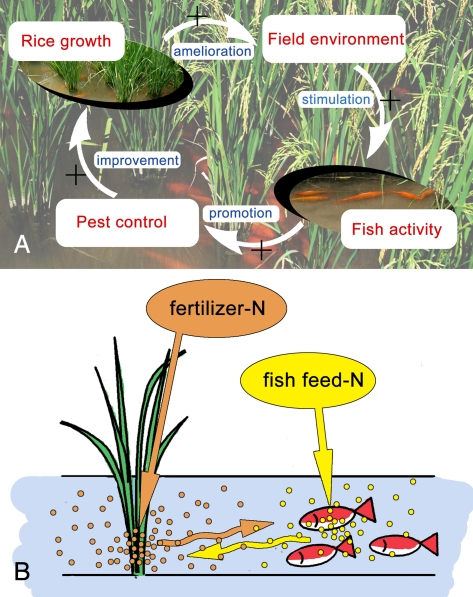
According to our survey of farmer fields and our first field experiment, the same level of temporal stability of rice yield requires substantially less pesticide input in RF than in RM. This stability of the RF system is associated with positive interactions between rice and fish that generate some emergent ecosystem properties. These emergent properties help explain the stability and sustainability of this traditional system.
On the one hand, fish can be biocontrol agents in rice (28). In our first field experiment, fish benefited rice by reducing insect pests, diseases, and weeds. Although fish did not reduce some pests (e.g., rice stem borer and rice leaf roller), fish substantially reduced rice planthoppers, rice sheath blight, and a variety of weeds. Our results further indicated that the reduction in rice planthoppers was partly due to fish hitting rice plant stems. This hitting caused rice planthoppers to fall into the water where they were possibly consumed by the fish (Fig. 3A). Whether fish could learn to hit the stems to feed on planthoppers in rice–fish system remains to be determined. The hitting activity caused by fish could also shake down dew drops from rice leaves in early morning and hence reduce the risk of spore germination and mycelium penetration of rice blast disease in rice leaves, which is worth further study. Fish can also disrupt or eat mycelia of the pathogenic fungus Rhizoctonia solani Kuhn and thus inhibit the development of rice sheath blight (Fig. 2B). In addition, fish in rice fields are capable of removing weeds by eating or uprooting them, resulting in an almost weed-free paddy field (Fig. 2D).
On the other hand, rice benefits fish. First, rice improves the environment for fish by providing shade and reducing water temperature during the hot season (Fig. 4 A and B). This moderation of light and temperature was associated with a substantial increase in fish activity (Fig. 3B). Second, rice acts as a N sink and helps reduce the concentration of ammonia in the water (Fig. 5A) and total N in the soil (Fig. 5B); such reductions in N could make the water more suitable for fish. Rice also may benefit fish by providing a supplemental food source in the form of planthoppers and other herbivorous insects that fall from the rice plants into the water. These positive interactions between fish and rice would represent a form of positive feedback.
Complementary N use between rice and fish explains why the RF system requires less chemical N fertilizers than the RM system. Although substantially less chemical N fertilizer was applied to RF than to RM in experiment 2, rice yields were similar in the two systems (Fig. 6A). RF can produce a high rice yield with less chemical fertilizer partly because of the unconsumed N in the fish feed (as indicated in Fig. 6C, 32% of the N in rice grain and straw was from fish feed in RF). At the same time, the fertilizer N in RF that is not taken up by the rice plants can stimulate plankton, which is consumed by fish. Thus, N use is efficient in RF apparently because both rice and fish use different forms of N.
Positive interactions and complementary nutrient use between rice and fish are the foundation of this “long-lived” coculture system and help explain why this coculture system can remain productive over time with low input of pesticides and chemical fertilizers. In modern, intensive agriculture, however, monocultures are planted, and positive interactions and complementary use of resources between species are largely ignored (29). Maintaining high and stable production in these intensive agricultural systems usually requires a high input of chemical fertilizers and pesticides (6). Rice–fish coculture, in contrast, exploits synergies between species to minimize chemical inputs and to maintain high and stable crop production. Study of the rice–fish coculture system suggests that modern agricultural systems might be improved by adding species to monocultures that result in positive interactions between the components. These interactions should improve the functioning of the agricultural ecosystem.
Rice production is a key component of global food security because rice is the main ingredient in the daily diets of ∼3 billion people. Moreover, >90% of worldwide rice production occurs in developing areas (27), where populations are growing rapidly and where the land available for agriculture is limited (2, 4). Rice–fish systems similar to the system described in this paper are now practiced in Egypt, India, Indonesia, Thailand, Vietnam, the Philippines, Bangladesh, Malaysia, and other countries (30, 31). The rice–fish systems are important in these areas because they provide food security, reduce the impact of agriculture on the environment, and may be less affected than conventional systems by climate change (32, 33). Rice–fish coculture on a large scale, however, will require the development of machinery for rice cultivation, field facilities that provide fish refuge, and new technology for high-yield fish culture.
Our study suggests that higher yield, lower chemical use, and more efficient utilization of land, water, and nutrients could be realized if some of the ecological components from traditional agriculture are appropriately incorporated into modern agriculture along with biotechnology, information-based technology, and other new technologies (34, 35). If we can apply the philosophy behind these traditional systems, future agriculture may have more chance to meet the escalating global food demand while protecting the environment.
Materials and Methods
Field Survey.
We assessed the quantity and stability of rice yield in rice–fish coculture by surveying farmer fields in south Zhejiang Province, China, which is the location of the rice–fish coculture GIAHS site (120°26′–121°41′E, 27°25′–28°57′N) (the study area is described in SI Text, section S1, and Fig. S1A). During 2005–2010, we randomly selected 31 villages (each village is located in a small watershed; 25 are in hilly areas and 6 are in flat areas) as sampling units throughout the study area (Fig. S1B). In each village, we selected three to five pairs of fields with RM vs. RF as subsample units. The two fields of each pair were located within the same village in a small watershed of ∼100 ha and were similar in size (0.3–0.5 ha), weather, and soil type. Each field pair was owned by one farmer or owned separately by two farmers. The same fields were surveyed each year.
Without influencing normal field operations, we recorded farming activities during the rice growing season at each field; we recorded each application of fertilizers and pesticides, the varieties planted, and the irrigation scheme used. The total application of pesticides was expressed as active ingredient (a.i.) per hectare. The total application of fertilizers was calculated and expressed as N, phosphorus (P), or potassium (K) per hectare.
In the first 2 y of the study (2005 and 2006), rice yields were obtained by harvesting sample plots (a 2-m2 plot in each field) and by obtaining harvest information from the farmers. Rice yields obtained by these two methods were highly correlated. Thus, during 2007–2010, data for rice yields were obtained only from farmers. All rice yield data used in this paper were obtained from farmers. Data for fish yield were also obtained from farmers. Rice and fish yields were expressed as tons per hectare and kilograms per hectare, respectively.
Data for precipitation, temperature, and relative humidity were obtained from three meteorological stations within the study site (Fig. S1B). Data for rice planthoppers were collected from three monitoring stations within the study site (Fig. S1B).
The temporal stability of rice yield (S) in RM and RF was compared with data from each sampling unit (village; the average from the subsample units in that village) for 6 y (2005–2010). S for each village was calculated as S = μ/δ, where μ is the mean yield value for a time period and δ is its temporal SD over the same time interval. The temporal coefficient of variation (CV) in the quantity of pesticides and fertilizers applied for RM and RF in each sample unit was calculated as CV = (SD/mean) × 100. Simple linear regression was used to determine the relationship between S and the quantity of pesticide (a.i.) applied in RM and RF.
Analysis of variance (ANOVA) was conducted with the general linear model (GLM) in SPSS (V.17.0). Repeated measures ANOVAs were performed on rice yield and quantities of pesticides and fertilizers. Two-way ANOVAs were used to analyze the effects of culture types (RM and RF) and paired plots on temporal stability of rice yield and on CVs (percentages) of pesticides and fertilizers over 6 y. Before analysis, data were log-transformed to meet assumptions of normality and homogeneity of variance.
Experiment 1.
We conducted a 5-y field experiment at the GIAHS pilot site (SI Text, section S1, and Fig. S1B) to compare the stability of the rice–fish coculture system with two other systems and to determine how this coculture system maintains stability with minimal pesticide input. The experiment was a split-plot design with three main plots (three culture systems), five subplots (five experimental years, 2006–2010), and four replicates. The three culture systems were RM without pesticides, RF without pesticides, and FM. Blocks were arranged in four terraces, and each treatment was randomly placed in a 25 × 20-m plot within each block. Plots were separated by 5-m buffer strips planted with soybean.
The hybrid variety Zhong-Zhe-You No.1, a dominant variety in the study area, was used. Four weeks after germination, rice seedlings were transplanted in the field with 35 cm between rows and 30 cm between hills (one seedling per hill) within the rows. Immediately after rice was transplanted, 250 young fish (each ∼70 g) were introduced to each plot. A compound N:P:K fertilizer (15:15:15) was broadcast as a basal fertilizer before furrowing at 450 kg⋅ha−1. No topdressing was applied. No pesticide was used in any plot during the experiment. Plots were flush irrigated at transplanting and were kept flooded to 20 cm depth until harvest. Fish were fed every day with 1.75 kg of local feed (a mixture of rice, corn, and wheat grain) per RF and FM plot.
Rice planthoppers (including N. lugen, S. furcifera, and L. striatellus), rice stem borers [C. supperssalis (Walker)], and rice leaf rollers (C. medinalis Guenee) were quantified every week in each experimental year. The method described by Frei et al. was used to quantify rice planthoppers (36). For the rice stem borer, 100 hills of rice in each plot were sampled by the parallel line sampling method and then dissected and examined for borers. For the rice leaf roller, 10 sites with a total number of 40 rice hills from each plot were sampled at random; the larvae were recorded for each plant sampled, and the number of larvae per hill were calculated for each treatment. Every 2 wk after transplanting, the incidence of rice sheath blight [caused by T. cucumeris (Frank) Donk] and rice blast (caused by P. oryzae Cav.) was determined by examining 1,000 stems per plot (200 stems at five locations per plot) and calculating the percentage of symptomatic stems. Plots were evaluated for weed infestation 2 wk before harvest by placing a 1-m2 quadrat at five locations in each plot. The aboveground dry biomass of weeds in each quadrat was determined.
In 2007, we monitored fish activity and removal of rice planthoppers by fish activity (SI Text, section S2) and temperature of the surface water and solar radiation intensity under the rice plant canopy in each plot (SI Text, section S3). In July, August, and September of each year, we determined the concentration of ammonia N in water sampled from RF and FM plots (SI Text, section S4). Immediately after each rice harvest, we determined total N in soil sampled from RF and FM plots (SI Text, section S4).
In each experimental year, rice yields were measured by harvesting and weighing the rice grain from each plot. When rice was harvested, fish yields were measured by collecting and weighing all of the fish from each plot. The temporal stability of rice yield (S) in RM and RF was calculated with data from each plot for 5 y (2006–2010). S for each plot was calculated as described in Field Survey.
The GLM in SPSS (V.17.0) was used to conduct the statistical analysis. All data were first subjected to a homogeneity test and were log-transformed if they did not meet the assumptions of normality and homoscedasticity. ANOVAs with split-plot design (culture types RM, RF, and FM as the main plots and experimental years as the subplots) were performed on rice yield, fish yield, weed biomass, and soil total N. Repeated measures (sampling several times in a year) ANOVAs with split-plot design were performed on the density of insect pests, disease incidences, and the concentration of ammonia N in the water. For each experimental year, the density of rice planthoppers between RM and RF was compared at time of the outbreak period of rice planthoppers (from late August to early September) and the other times (from early June to late July and from middle to late September). The frequency of fish activity in a day and the water temperature and light intensity under the rice canopy around noon were compared in RF vs. FM plots with repeated measures ANOVA. The numbers of rice planthoppers collected from the water surface were compared in RM vs. RF plots with repeated measures ANOVA.
Experiment 2.
To test the effect of N application in the form of fish feed on rice and fish yield, we compared RM, RF (± fish feed), and FM (± fish feed) in experiment 2. The experiment had a completely randomized block design with five treatments and four replicates. The treatments were (i) RM, (ii) rice–fish coculture without feed application (RF feed 0), (iii) rice–fish coculture with feed application (RF feed 1), (iv) fish monoculture without feed application (FM feed 0), and (v) fish monoculture with feed application (FM feed 1). Blocks were arranged in four terraces, and each treatment was randomly placed in a 6.5 × 10-m plot within each block. Plots were separated by 5-m buffer strips planted with soybean.
Rice cultivation (e.g., variety, seedling preparation, transplantation, and irrigation) was the same as in experiment 1. For RM, a compound N:P:K fertilizer (15:15:15) was broadcast as a basal fertilizer before furrowing at 450 kg⋅ha−1. A topdressing of urea containing 46% N was applied to RM 30 d after transplanting at 112.5 kg⋅ha−1. RF feed 0 and RF feed 1 received the same basal fertilizer as RM but did not receive a topdressing. For treatments of fish monoculture (FM feed 0 and FM feed1) and rice–fish coculture (RF feed 0 and RF feed 1), 60 young fish (each ∼12 g) were added to each plot immediately after rice was transplanted. A compounded fish feed was prepared with ingredients purchased at the local market. The feed contained, on a dry matter basis, 9.13% crude protein, 3.25% crude lipid, and 14.5% crude ash. The N and P content was 1.46% and 5.37%, respectively. In the treatments RF feed 1 and FM feed 1, feed was applied once each day at 15, 30, 45, 60, 75, and 90 d after fish were added at a rate of 30, 60, 90, 120, 150, and 200 g per plot, respectively (the quantity added was increased as the fish grew). The total amount of feed supplied during the entire experiment was 9.73 kg per plot.
Rice yield was determined by harvesting the rice from each plot. For determination of N content in rice grain and straw, five rice hills were collected per plot at harvest. The grain and aboveground straw were dried at 65 °C and ground. Fish yield was estimated by collecting all fish from the whole plot at rice harvest. Five fish were sampled from each plot for analysis of N content. Dry matter content was determined by drying the samples at 105 °C for 24 h. The Kjeldahl method was used for determination of the N contents in rice grain, rice straw, and fish.
The balance of N output and input within each system (RM, RF, or FM) was calculated (SI Text, section S5), and the fate of N contained in fish feed in RF or FM was analyzed (SI Text, section S6). The quantity of fertilizer N that could potentially stimulate plankton (which is consumed by fish) was calculated by subtracting the fish N in RF from the fish N in FM.
Two-way ANOVAs in the GLM (SPSS, V.17.0) were used to analyze the effect of treatment or block on yields of rice and fish and on the N contents of rice and fish. Means were compared by Tukey's method at the 5% confidence level.
Supplementary Material
Acknowledgments
We thank J. H. Chen, M. F. Wu, and X. H. Wang for helping with the field experiment in the GIAHS site. Y. L. Jin, Q. Zhang, L. Liu, Y. F. Li, L. M. Xu, W. J. Zhu, and S. S. Zhang were also involved with the field experiments. We also thank Bruce Jaffee in the United States for helpful comments on the text and English revision. This research was supported by the National Basic Research Program of China (2011CB100406), the Science and Technology Department of Zhejiang Province (2008C12064), and the State Environmental Protection Administration of China (201009020-04).
Footnotes
The authors declare no conflict of interest.
This article is a PNAS Direct Submission.
See Author Summary on page 19851.
See Commentary on page 19841.
This article contains supporting information online at www.pnas.org/lookup/suppl/doi:10.1073/pnas.1111043108/-/DCSupplemental.
References
- 1.Godfray HCJ, et al. Food security: The challenge of feeding 9 billion people. Science. 2010;327:812–818. doi: 10.1126/science.1185383. [DOI] [PubMed] [Google Scholar]
- 2.MacDonald GM. Climate change and water in Southwestern North America special feature: Water, climate change, and sustainability in the southwest. Proc Natl Acad Sci USA. 2010;107:21256–21262. doi: 10.1073/pnas.0909651107. [DOI] [PMC free article] [PubMed] [Google Scholar]
- 3.Brown ME, Funk CC. Climate. Food security under climate change. Science. 2008;319:580–581. doi: 10.1126/science.1154102. [DOI] [PubMed] [Google Scholar]
- 4.Piao SL, et al. The impacts of climate change on water resources and agriculture in China. Nature. 2010;467:43–51. doi: 10.1038/nature09364. [DOI] [PubMed] [Google Scholar]
- 5.Mäder P, et al. Soil fertility and biodiversity in organic farming. Science. 2002;296:1694–1697. doi: 10.1126/science.1071148. [DOI] [PubMed] [Google Scholar]
- 6.Tilman D, Cassman KG, Matson PA, Naylor R, Polasky S. Agricultural sustainability and intensive production practices. Nature. 2002;418:671–677. doi: 10.1038/nature01014. [DOI] [PubMed] [Google Scholar]
- 7.Bromley DW. Food security: Beyond technology. Science. 2010;328:169. doi: 10.1126/science.328.5975.169-d. [DOI] [PubMed] [Google Scholar]
- 8.Altieri MA. Linking ecologists and traditional farmers in the search for sustainable agriculture. Front Ecol Environ. 2004;2:35–42. [Google Scholar]
- 9.Vien TD, Leisz SJ, Lam NT, Rambo AT. Using traditional swidden agriculture to enhance rural livelihoods in Vietnam's uplands. Mt Res Dev. 2006;26:192–196. [Google Scholar]
- 10.Herrero M, et al. Smart investments in sustainable food production: Revisiting mixed crop-livestock systems. Science. 2010;327:822–825. doi: 10.1126/science.1183725. [DOI] [PubMed] [Google Scholar]
- 11.Zhu YY, et al. Genetic diversity and disease control in rice. Nature. 2000;406:718–722. doi: 10.1038/35021046. [DOI] [PubMed] [Google Scholar]
- 12.Altieri MA, Nicholls CI. The simplification of traditional vineyard based agroforests in northwestern Portugal: Some ecological implications. Agrofor Syst. 2002;56:185–191. [Google Scholar]
- 13.Reganold JP, Glover JD, Andrews PK, Hinman HR. Sustainability of three apple production systems. Nature. 2001;410:926–930. doi: 10.1038/35073574. [DOI] [PubMed] [Google Scholar]
- 14.Kleijn D, et al. Mixed biodiversity benefits of agri-environment schemes in five European countries. Ecol Lett. 2006;9:243–254. doi: 10.1111/j.1461-0248.2005.00869.x. discussion 254–257. [DOI] [PubMed] [Google Scholar]
- 15.Crowder DW, Northfield TD, Strand MR, Snyder WE. Organic agriculture promotes evenness and natural pest control. Nature. 2010;466:109–112. doi: 10.1038/nature09183. [DOI] [PubMed] [Google Scholar]
- 16.Koohanfkan P, Furtado J. Traditional rice-fish systems as globally indigenous agricultural heritage systems (GIAHS). Proceeding of the FAO Rice Conference. Int Rice Comm Newslett. 2004;53:66–74. [Google Scholar]
- 17.Wang ZB. Chronicles of Agriculture of Yongjia County. Beijing: Ocean Press; 1997. pp. 7–11. (in Chinese) [Google Scholar]
- 18.Wang CH, Li SF. Phylogenetic relationships of ornamental (koi) carp, Oujiang color carp and Long-fin carp revealed by mitochondrial DNA COII gene sequences and RAPD analysis. Aquaculture. 2004;231:83–91. [Google Scholar]
- 19.Wang CH, et al. Genetic parameter estimates for growth-related traits in Oujiang color common carp (Cyprinus carpio var. color) Aquaculture. 2006;259:103–107. [Google Scholar]
- 20.Xie J, et al. Conservation of traditional rice varieties in a globally important agricultural heritage system (GIAHS): Rice-fish co-culture. Agric Sci China. 2011;10:101–105. [Google Scholar]
- 21.You X. Rice-fish culture-a typical model of sustainable traditional agriculture. Agr Archaeol. 2006;4:222–224. (in Chinese) [Google Scholar]
- 22.Fang L, Zhang JE, Jiang YP. The conservation and sustainable development of the rice-fish farming system in Qingtian County, Zhejiang Province as one of globally-important ingenious agricultural heritage systems. Chin Agric Sci Bull. 2007;23:389–392. [Google Scholar]
- 23.Xie J, Wu X, Tang JJ, Zhang JE, Chen X. Chemical fertilizer reduction and soil fertility maintenance in rice-fish co-culture system. Front Agric China. 2010;4:422–429. [Google Scholar]
- 24.Li K. Rice-fish culture in China: A review. Aquaculture. 1988;71:173–186. [Google Scholar]
- 25.Tilman D, Reich PB, Knops JMH. Biodiversity and ecosystem stability in a decade-long grassland experiment. Nature. 2006;441:629–632. doi: 10.1038/nature04742. [DOI] [PubMed] [Google Scholar]
- 26.Thomas MB. Ecological approaches and the development of “truly integrated” pest management. Proc Natl Acad Sci USA. 1999;96:5944–5951. doi: 10.1073/pnas.96.11.5944. [DOI] [PMC free article] [PubMed] [Google Scholar]
- 27.Frei M, Becker K. Integrated rice-fish culture: Coupled production saves resources. Nat Resour Forum. 2005;29:135–143. [Google Scholar]
- 28.Halwart M. In: Fish as Biocontrol Agents in Rice: The Potential of Common Carp Cyprinus carpio and Nile Tilapia Oreochromis niloticus (Tropical Agroecology 8) Halwart M, editor. Weikersheim, Germany: Margraf Verlag; 1994. [Google Scholar]
- 29.Omer A, Pascual U, Russell NP. Biodiversity conservation and productivity in intensive agricultural systems. J Agric Econ. 2007;58:308–329. [Google Scholar]
- 30.Fernando CH. Rice field ecology and fish culture- an overview. Hydrobiologia. 1993;259:91–113. [Google Scholar]
- 31.Halwart M, Gupa MV. Culture of Fish in Rice Fields. Penang, Malaysia: Food and Agriculture Organization and The World Fish Center; 2004. [Google Scholar]
- 32.Frei M, Becker K. A greenhouse experiment on growth and yield effects in integrated rice-fish culture. Aquaculture. 2005;244:119–128. [Google Scholar]
- 33.Datta A, Nayak DR, Sinhababu DP, Adhya TK. Methane and nitrous oxide emissions from an integrated rainfed rice-fish farming system of Eastern India. Agric Ecosyst Environ. 2009;129:228–237. [Google Scholar]
- 34.Gebbers R, Adamchuk VI. Precision agriculture and food security. Science. 2010;327:828–831. doi: 10.1126/science.1183899. [DOI] [PubMed] [Google Scholar]
- 35.Tester M, Langridge P. Breeding technologies to increase crop production in a changing world. Science. 2010;327:818–822. doi: 10.1126/science.1183700. [DOI] [PubMed] [Google Scholar]
- 36.Frei M, et al. Effects of a mixed culture of common carp, Cyprinus carpio L., and Nile tilapia, Oreochromis niloticus L., on terrestrial arthropod population, benthic fauna, and weed biomass in rice fields in Bangladesh. Biol Control. 2007;41:207–213. [Google Scholar]


