

Abstract
The neural bases of gender differences in emotional, cognitive, and socials behaviors are largely unknown. Here, magnetic resonance imaging data from 336 women and 225 men revealed a gender dimorphism in the functional organization of the brain. Consistently across five research sites, women had 14% higher local functional connectivity density (lFCD) and up to 5% higher gray matter density than men in cortical and subcortical regions. The negative power scaling of the lFCD was steeper for men than for women, suggesting that the balance between strongly and weakly connected nodes in the brain is different across genders. The more distributed organization of the male brain than that of the female brain could help explain the gender differences in cognitive style and behaviors and in the prevalence of neuropsychiatric diseases (i.e., autism spectrum disorder). Hum Brain Mapp, 2012. © 2011 Wiley Periodicals, Inc.
Keywords: fMRI, scale‐free networks, default mode networks, consciousness, resting‐state, functional connectomes, local functional connectivity density, lFCD
INTRODUCTION
Recent studies using diffusion magnetic resonance imaging (MRI) tractography reported that cortical networks showed greater overall anatomical connectivity and more efficient organization in the female than in the male brain [Gong et al.,2009]. Although anatomical differences in network connectivity are likely to result in functional differences, the extent to which there is a gender dimorphism in functional connectivity is still unclear. The functional connectivity between brain regions can be studied using correlation analyses of MRI data sets collected in resting conditions [Biswal et al.,1995], and resting‐state functional connectivity studies have documented differences between men and women [Biswal et al.,2010]. Studies on functional connectivity have also suggested that the brain networks have a scale‐free organization where few nodes (hubs) have numerous connections and numerous nodes have few connections with other regions to support fast communication with minimal energy cost [Achard et al.,2006; Barabasi,2009]. However, the potential sex effects on the scale‐free circuitry of the functional networks are unknown.
A popular technique used for the analysis of resting‐state time series is based on the selection of seed regions and correlation analysis of blood oxygenation level‐dependent (BOLD) signals, reviewed in Fox and Raichle [2007]. Cluster analysis is also used for the evaluation of the degree of functional connectivity among multiple seed regions [Cordes et al.,2002]. These methods are computationally demanding and have limited potential to assess functional properties of the networks, such as the local clustering, because they rely strongly on “a priori” selection of specific seed regions rather than allowing the characteristics of the network to define the node regions. Data‐driven methods such as independent component analysis (ICA) and principal component analysis (PCA) were also used to identify autocorrelated networks [Birn et al.,2008; Biswal et al.,2010; Mikula and Niebur,2006; van de Ven et al.,2004]. These data reduction approaches cannot be used to assess the scale‐free scaling of the brain because they provide global rather than local measures of brain connectivity. The existence of hubs in the human brain was assessed from MRI data sets using a computer‐demanding data‐driven approach based on graph theory methods [van den Heuvel et al.,2008].
Recently, we proposed “functional connectivity density mapping” (FCDM) [Tomasi and Volkow,2010], an alternative voxel‐wise data‐driven method that allows ultrafast mapping of regions with high local functional connectivity density (lFCD), for the identification of hubs in the human brain. This technique is based on the highly clustered organization of the brain [van den Heuvel et al.,2008] and allows calculation of individual functional connectivity maps with unprecedented spatial resolution (3‐mm isotropic of higher). We hypothesized that, in resting conditions, the lFCD would be higher for women than for men, paralleling the anatomical connectivity findings [Gong et al.,2009], that its probability distribution would have the power scaling for the number of functional connections per node that is characteristic of scale‐free networks [Achard et al.,2006; Barabasi,2009], and that this scaling would be different for men and women.
METHODS
Data Sets
We used resting‐state functional connectivity data sets corresponding to 561 healthy subjects (336 women; 225 men; age range = 18–30 years) from five research sites (Beijing, Cambridge, Leiden, Oulu, and Saint Louis) of the “1000 Functional Connectomes” Project [Biswal et al.,2010]; these data sets have a narrow age range that minimizes potential aging effects on lFCD and a complementary set of high‐quality structural MRI images that were used to minimize potential effects of gray matter (GM) density on lFCD. These data sets were acquired using echo‐planar imaging scanners with different acquisition parameters and 3‐Tesla MRI scanners (Table I). The corresponding structural MRI data sets were also included in the analysis to account for potential differences in brain morphology between men and women. Specifically, three‐dimensional magnetization‐prepared rapid gradient‐echo (MP‐RAGE) imaging [Mugler and Brookeman,1990] data sets with optimal GM/white matter (WM) contrast and high spatial resolution (1‐mm isotropic), which is important to minimize unwanted partial volume effects during segmentation, were used.
Table I.
Demographic data and imaging parameters for selected resting‐state functional MRI data sets of the image repository “1000 Functional Connectomes”, the corresponding lFCD‐variability, and the variance of its first principal component, PCA#1
| Data set | Subjects | Age (years) | tp | TR (s) | Variability (%) | PCA #1 (%) |
|---|---|---|---|---|---|---|
| Beijing | 122F/76M | 18–26 | 225 | 2.0 | 32 | 27a |
| Cambridge | 123F/75M | 18–30 | 119 | 3.0 | 31 | 33a |
| Leiden | 8F/23M | 20–27 | 215 | 2.2 | 21 | 40a |
| Oulu | 66F/37M | 20–23 | 245 | 1.8 | 33 | 29a |
| St. Louis | 17F/14M | 21–29 | 127 | 2.5 | 23 | 29a |
The factors of the first principal component were significantly correlated (P < 0.05, two‐sample t‐test) with gender.
tp, number of time points in the image time series; TR, repetition time of the MRI acquisition; F/M, women/men.
Voxel‐Based Morphometry
The structural MRI data sets were subject of a number of processing steps using automated procedures implemented in the statistical parametric mapping package SPM2 (Wellcome Department of Cognitive Neurology, London, UK). First, image intensity correction was applied to remove spatial variations related to nonuniform MRI sensitivity. Then, the images were segmented into GM and WM and cerebrospinal fluid (CSF) compartments using a modified mixture model cluster analysis technique. Finally, the images were normalized to the stereotactic space of the Montreal Neurological Institute (MNI) preserving concentrations using a 12‐parameters affine transformation with medium regularization and 16 nonlinear iterations, the T1.mnc included in SPM2, and a voxel size of 1 × 1 × 1 mm3. Note that variable image contrast and variable field of view across research sites prevented creation of an artifact‐free custom template. The volumes of the GM, WM, and CSF compartments as well as the total brain volume (TBV) were computed for segmented as well as for normalized images. Complementary voxel‐based morphometry (VBM) analyses [Ashburner and Friston,2000] of regional GM were carried out after smoothing the normalized GM images with a 10‐mm3 full‐width‐half‐maximum Gaussian kernel. The SPM2 one‐way analysis of variance (ANOVA) model with nonsphericity correction and without global scaling was used for group analyses of GM density.
Local Functional Connectivity Density Mapping
The echo‐planar imaging (EPI) time series were motion corrected with a 12‐parameter affine transformation and spatially normalized to the MNI stereotactic space preserving concentrations using a 12‐parameters affine transformation with a voxel size of 3 × 3 × 3 mm3 and the SPM2 EPI.mnc template as described above. The six SPM2 realignment parameters were included into a multilinear regression model to remove motion‐related signal fluctuations [Tomasi and Volkow,2010], and 0.01−0.10 Hz band‐pass temporal filtering was used to remove low‐frequency magnetic field drifts [Foerster et al.,2005] of the scanner and high‐frequency components of physiologic noise [Cordes et al.,2001]. The number of functional connections, k, between a given voxel and other voxels was computed through Pearson correlations using a correlation threshold R = 0.6 and a three‐dimensional searching algorithm developed in Interactive Data Language (IDL) (ITT Visual Information Solutions, Boulder, CO) that detects the boundaries of the voxel's cluster [Tomasi and Volkow,2010]. Specifically, for each GM voxel (x 0), the searching algorithm computes the Pearson correlation factor, r, between x 0 and the closest neighbors of voxels functionally connected with x 0 (x M; M = {j}). If r 0j > R, the x j is added to the list of functionally connected voxels (x N; N = {i}), and the calculation is repeated for the next neighbor in the list. When no new neighbors can be added to the list of functionally connected voxels with x 0, the searching algorithm computes k as the number of elements in N, and the calculation is initiated for a different x 0. This calculation is performed for all x 0 voxels. Subsequently, these lFCD maps were spatially smoothed (8 mm) to minimize the differences in the functional anatomy of the brain across subjects.
The lFCD distribution varied across research centers (Fig. 1) likely due to differences in acquisition parameters, instruments, demographic variables, and potential differences in resting conditions (e.g. eyes opened/closed, awake/sleep, etc). The use of a single scaling factor for each research site, 1/k 0, reflecting the mean lFCD across subjects and voxels in the brain, k 0, allowed us to normalize its distribution and merge the data sets from different research sites [Tomasi and Volkow,2010].
Figure 1.
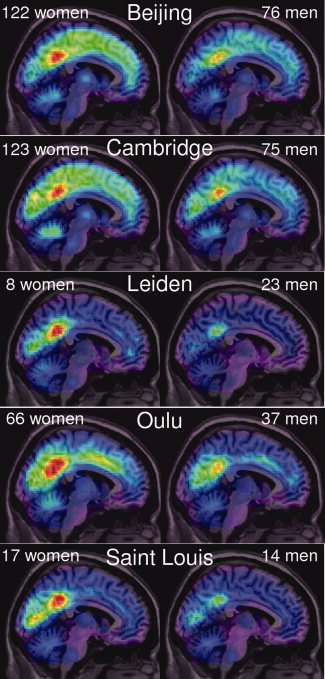
Spatial distribution of the average resting‐state lFCD superimposed on middle sagittal MRI plane for each of the five research sites (white center labels; sample sizes are indicated by white labels on the left and right upper corners of each panel). In resting conditions, the average lFCD peaks in posterior cingulate/ventral precuneus for men and women and for all research sites, regardless of differences in ethnicity, sample size, and MRI scanners and acquisition parameters.
Gaussian Fit of the lFCD Distribution
We have shown in a larger sample that the rescaled lFCD was normally distributed at the location of lFCD hubs [Tomasi and Volkow,2010]. To evaluate whether the rescaled lFCD was normally distributed at each x 0 in this work, we performed voxel‐wise Gaussian fits of the lFCD distribution in IDL. The fits converged in less than 20 iterations for >99.8% of the voxels. The goodness of the Gaussian fits, as given by the χ2 per degrees of freedom χ < 1.29, indicates a good agreement between the lFCD distribution and the normal curve for >90% of the voxels (Fig. 2). Thus, differences between the normal distribution and the lFCD distribution were statistically significant (P < 0.05) for less than 10% of the voxels. Overall, these results strongly suggest that statistical parametric (SPM) tests are adequate to evaluate group differences in lFCD.
Figure 2.

Exemplary distribution of the rescaled lFCD across subjects (N = 561) at the location of the main functional hub (posterior cingulated/ventral precuneus) and a Gaussian fit of the data (A); distribution of the χ2 goodness‐of‐Gaussian fit (χ) of the lFCD distribution across gray matter voxels (B); and spatial distribution of χ rendered on dorsal (C) and ventral (D) surfaces of a template of the human brain.
Removal of GM Contributions in FCDM
Potential GM confounding effects on lFCD were removed for each individual voxel using linear regression in IDL. Specifically, for each voxel, a linear form
was fitted to the data, and a GM‐corrected map, lFCD0, was computed and saved in analyze format for each subject. Here, ρ is a zero‐mean regressor reflecting the GM density at each voxel, and B is the slope of the linear fit. To evaluate the statistical significance of this linear association, the linear correlation factor between lFCD and ρ was computed for each voxel and transformed into a z‐score using the Fisher transform. A z‐threshold >4.76, which corresponds to a family‐wise error threshold p FWE < 0.05, was used to correct for multiple comparisons at the voxel‐level the statistical maps of GM–lFCD correlations.
Statistical Analyses
Group analyses of the lFCD0 maps were performed using the general linear model in SPM2. Specifically, the analysis was based on one‐way ANOVA with two groups (women and men), nonsphericity correction, and without global scaling. To control for brain size and gender, the model included zero‐mean regressors for total GM, total WM, TBV, and age. Clusters with p FWE < 0.05, corrected for multiple comparisons with the random field theory [Worsley et al.,1992], were considered significant in group analysis of FCDM. The MNI coordinates of the lFCD‐cluster maxima were transformed to the Talairach space using a best‐fit transform (icbm_spm2tal; http://brainmap.org/icbm2tal/) that minimizes bias associated with reference frame and scaling [Lancaster et al.,2007]. The brain regions were labeled according to the Talairach daemon (http://www.talairach.org/) [Lancaster et al.,2000] and a query range of 5 mm to account for the spatial uncertainty of the MRI signal [Tomasi and Caparelli,2007], which results from macrovascular and susceptibility effect as well as image postprocessing steps. We further checked the labels of the hubs using the Automated Anatomical Labeling (AAL) atlas [Tzourio‐Mazoyer et al.,2002] and the Brodmann atlas, which is included in the MRIcro software (http://www.cabiatl.com/mricro/).
Principal Component Analyses
PCA was used to analyze the variability of FCDM across subjects. lFCD maps with zero empirical mean were calculated by subtracting the average lFCD value across subjects from the lFCD data. Then, the principal components of FCDM data sets were computed using the covariance method in IDL.
Functional Region‐of‐Interest Analyses
Isotropic cubic masks containing 27 imaging voxels (0.73 ml) were defined at the centers of relevant functional connectivity hubs (Table II) to extract the average strength of the lFCD signal from individual lFCD maps using a custom program written in IDL.
Table II.
Cluster locations (x, y, and z) in the MNI stereotactic space and statistical significance for gender effects on lFCD0
| ROI | Brain region | BA nucleus | x (mm) | y (mm) | z (mm) | F > M (T) | F > M (Z) |
|---|---|---|---|---|---|---|---|
| 1 | Thalamus | Anterior | 12 | −3 | 12 | 8.87 | 8.61 |
| 2 | Superior frontal | 6 | 6 | 24 | 57 | 7.95 | 7.72 |
| 3 | Superior frontal | 6 | −3 | 24 | 57 | 7.10 | 6.95 |
| 4 | Precuneus | 7 | −12 | −33 | 51 | 7.68 | 7.49 |
| 5 | Thalamus | Pulvinar | −21 | −27 | 3 | 7.47 | 7.28 |
| 6 | Caudate | Body | −15 | −9 | 21 | 7.28 | 7.11 |
| 7 | Medial frontal | 6 | −9 | 6 | 54 | 7.17 | 7.01 |
| 8 | Medial frontal | 6 | −12 | 36 | 30 | 7.14 | 6.98 |
| 9 | Thalamus | Anterior | −12 | 0 | 3 | 7.04 | 6.89 |
| 10 | Supramarginal | 40 | −54 | −45 | 36 | 7.01 | 6.86 |
| 11 | Supramarginal | 40 | −54 | −45 | 36 | 7.01 | 6.86 |
| 12 | Inferior parietal | 40 | −48 | −39 | 33 | 6.98 | 6.83 |
| 13 | Parahippocampal | 34 | 24 | 6 | −24 | 6.75 | 6.61 |
| 14 | Caudate | Head | 9 | 21 | 0 | 5.75 | 5.66 |
| 15 | Cerebellum | Tonsil | 24 | −51 | 39 | 5.72 | 5.64 |
| 16 | Insula | 13 | 42 | −15 | 9 | 5.58 | 5.50 |
| 17 | Precuneus | 19 | −33 | −69 | 48 | 5.57 | 5.50 |
| 18 | Precuneus | 7 | −27 | −66 | 45 | 5.57 | 5.49 |
| 19 | Cuneus | 18 | 15 | −87 | 24 | 5.06 | 5.00 |
| 20 | Middle temporal | 21 | −63 | −54 | 3 | 4.95 | 4.90 |
| 21 | Caudate | Tail | 36 | −39 | 3 | 4.81 | 4.76 |
| 22 | Cerebellum | Tuber | −48 | −63 | −30 | 4.79 | 4.74 |
Sample: 336 healthy women (F) and 225 healthy men (M).
RESULTS
Men had 13.57% larger TBV, as well as larger GM (11.05%) and WM (15.61%) and CSF (19.82%) volumes than women (P < 0.0001, t‐test). After spatial normalization, the rescaled TBV was not significantly different for men and women (P = 0.4, t‐test). However, women had larger GM volume (2.46%) and smaller WM (1.90%) and CSF (6.06%) volumes than men (P < 0.003, t‐test; Fig. 3) after spatial normalization.
Figure 3.
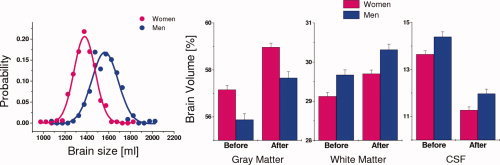
Probability distribution of the brain size for men and women. Total brain volume was significantly larger for men (blue) than for women (pink) (P < 0.0001, t‐test); curves are the Gaussian fits corresponding to men and women. Bar plots: gray matter, white matter, and cerebrospinal fluid (CSF) volumes before and after spatial normalization to the MNI stereotactic space for men and women. Sample size: 336 healthy women and 225 healthy men.
Gender Differences in lFCD
Figure 1 shows the average distribution of the resting‐state lFCD for women (left) and men (right). The posterior cingulate/ventral precuneus (BA 23/31), the brain region with the highest lFCD, was the most prominent functional hub (regions with high connectivity density) in resting conditions. Cuneus and middle occipital gyrus (BA 18), cingulate gyrus (BA 24), inferior parietal cortex (BA 40), as well as precentral (BA 6), inferior and middle frontal gyri (BAs 6 and 9), thalamus, putamen, claustrum, and cerebellum were other brain regions that included lFCD hubs. The variability of the hub's locations across research sites was minimal (5 mm) and comparable with the Gaussian smoothing kernel (8 mm).
Region‐of‐interest (ROI) analyses of the rescaled lFCD data sets revealed that, in resting conditions, women had higher lFCD than men in numerous brain regions (Table II; Fig. 4A,B). Women had 13.7% ± 7.8% higher lFCD than men (P < 0.01, t‐test; Fig. 4C,D; Table II). Using factor analysis, we found that the gender effects accounted for 28% of the lFCD‐variance (P < 2 × 10⁻⁹, t‐test on factors of PCA #1; Fig. 5A,B).
Figure 4.
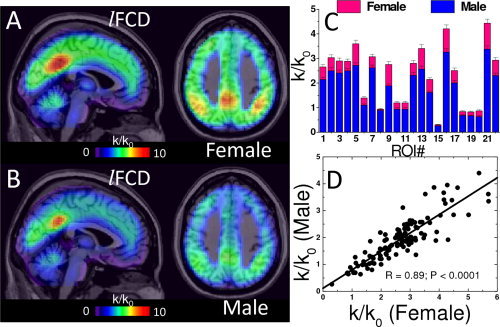
The local functional connectivity density (lFCD) in the brain was evaluated for (A) 336 women (25.5 ± 10.0 years old, mean ± SD) and (B) 225 age‐matched men (26.4 ± 9.7 years old; age effect: P = 0.16, t‐test) using FCDM [Tomasi and Volkow,2010]. The functional connectivity hubs (regions densely connected to other brain regions; red) were bilaterally located in the posterior cingulate/ventral precuneus, inferior parietal cortex, and cuneus. The lFCD was 13.7% ± 7.8% higher (C; ROI t‐tests) and proportional (D; R = 0.89, ROI linear correlation) for women than for men across all cortical and subcortical ROI (0.73‐ml cubic ROIs centered at the MNI coordinates listed in Table II).
Figure 5.
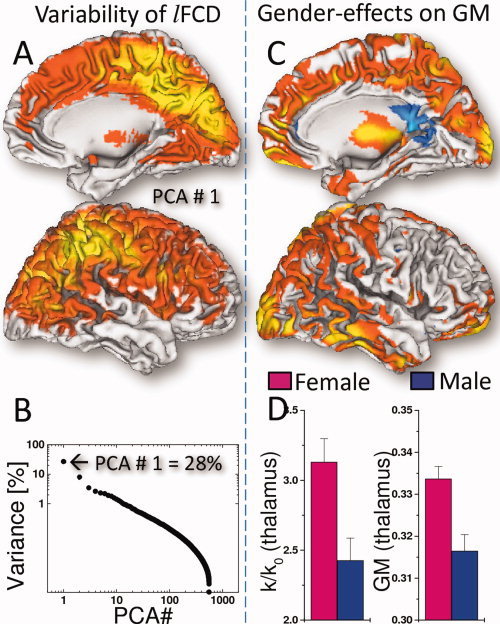
Spatial distribution of the first principal component (PCA #1) showing brain regions with high lFCD‐variance (A) and the variance of the lFCD as a function of the principal components (B). The VBM analysis revealed that women had higher gray matter (GM) density than men in occipital, parietal, temporal, and ventral prefrontal cortices and thalamus (C; red–yellow: 10−3 < P < 10−9, one‐way ANOVA). GM differences paralleled lFCD differences in the thalamus (D). Sample: 336 women and 225 men, age: 21.5 ± 2.3 years.
Voxel‐Based Morphometry
VBM analyses revealed that women had higher GM density than men in regions that showed gender differences in lFCD, including the thalamus as well as parietal and temporal cortices (p FWE < 0.05, one‐way ANOVA; Fig. 5C). Women had 5% ± 1% higher GM density and 12% ± 2% higher lFCD than men in the thalamus (Fig. 4D).
GM‐lFCD Correlations
Correlation analyses showed an association between the uncorrected lFCD and GM density, which was statistically significant in prefrontal (BAs 11, 25, and 47), temporal (BAs 20–22), parietal (BA 7), and limbic (BAs 29 and 35) cortices, thalamus, and pons (Fig. 6A,B; Table III).
Figure 6.

Statistical significance of GM–lFCD correlations rendered on the brain surface (A), and a scatter plot exemplifying the correlation in the thalamus (B). After corrections for gray matter density, the gender‐related lFCD0 differences in the brain were statistically significance in cortical and subcortical brain regions (C; p FWE < 0.05; Table II). The power scaling of P(k/k 0) was 33% higher for men than for women in this study (P < 0.0001, comparison of scaling factors; D). Sample: 225 healthy men and 336 healthy women.
Table III.
Cluster locations (x, y, and z) in the MNI stereotactic space and statistical significance of correlations between GM and lFCD
| Brain region | BA nucleus | x (mm) | y (mm) | z (mm) | GM–lFCD (Z) |
|---|---|---|---|---|---|
| Anterior cingulate | 25 | 0 | 3 | −15 | 15.15 |
| Inferior frontal | 47 | −36 | 27 | −30 | 10.16 |
| Middle frontal | 11 | −27 | 30 | −27 | 9.73 |
| Thalamus | Pulvinar | 3 | −27 | 6 | 9.69 |
| Inferior frontal | 47 | −48 | 30 | −21 | 9.26 |
| Brainstem | Pons | −15 | −30 | −24 | 8.71 |
| Superior temporal | 22 | −66 | −9 | 0 | 8.66 |
| Superior temporal | 22 | −57 | 12 | −15 | 8.57 |
| Brainstem | Pons | 0 | −42 | −30 | 7.87 |
| Inferior temporal | 20 | 57 | −27 | −24 | 7.80 |
| Precuneus | 7 | 0 | −57 | 69 | 7.62 |
| Superior temporal | 22 | −63 | 3 | 0 | 7.59 |
| Posterior cingulate | 29 | 0 | −57 | 15 | 7.47 |
| Fusiform | 20 | −51 | −24 | −27 | 7.43 |
| Middle temporal | 21 | −69 | −18 | −9 | 7.30 |
| Middle temporal | 21 | −72 | −24 | −12 | 7.25 |
| Parahippocampal | 35 | 15 | −30 | −12 | 7.19 |
| Middle temporal | 21 | −72 | −30 | −9 | 7.05 |
| Precuneus | 7 | 0 | −72 | 60 | 6.89 |
| Middle temporal | 21 | −63 | 0 | −15 | 6.77 |
| Middle temporal | 21 | −69 | −9 | −18 | 6.66 |
| Inferior frontal | 47 | 33 | 24 | −27 | 6.65 |
Sample: 336 healthy women (F) and 225 healthy men (M).
Gender Differences in lFCD After Corrections for GM Density
The SPM analysis of GM‐corrected data (lFCD0) demonstrated significant gender effects that peaked bilaterally in the ventral anterior nucleus of the thalamus and spread over other thalamic nuclei, frontal (BA 6), parietal (BAs 7 and 40), occipital (BAs 18 and 19), temporal (BAs 21 and 41) and limbic (BAs 23, 34, and 36) regions, insula (BA 13), and caudate (p FWE < 0.05, FWE‐corrected for multiple comparisons; Fig. 6C, Table II). The lFCD0 was not significantly correlated with any of the four covariates in the statistical analysis (total GM, total WM, TBV, and age).
Scale‐Free Scaling
The probability distribution of the lFCD, P(k/k 0), defined as the ratio between the number of voxels with k/k 0 functional connections, n(k/k 0), and the total number of voxels in the brain, n 0, had a negative power scaling, P(k/k 0) ∝ ((k/k 0)γ for voxels with k/k 0 > 10 (Fig. 7), and the absolute value of the scaling factor, γ, was lower for women than for men (P < 0.0001, comparison of regression slopes; Fig. 6D).
Figure 7.
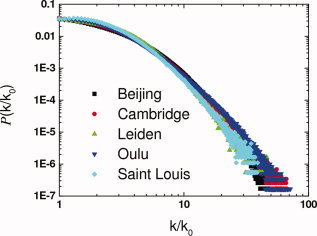
lFCD probability distribution, P(k/k 0) as a function of k/k 0 for each research site.
DISCUSSION
Using resting‐state MRI time series from the public image repository, 1000 Functional Connectomes [Biswal et al.,2010] and FCDM [Tomasi and Volkow,2010], a novel ultrafast data‐driven approach to map densely connected brain regions, we mapped the sex‐related lFCD differences between 225 healthy men and 336 healthy women. The main finding is that women had 14% higher lFCD than men, even after controlling for differences in TBV, GM, WM, and age, suggesting that lFCD differences reflect brain organization differences between genders rather than GM effects. These differences were maximal in the anterior thalamus (bilateral), and there were no significant laterality patterns in lFCD nor in the gender differences in lFCD or GM density, which suggest minimal gender effects on lFCD hemispheric differentiation.
Our results are consistent with the women's higher global anatomical connectivity reported by diffusion tensor imaging studies [Gong et al.,2009]. Because intrinsic metabolic demands of brain tissue are driven predominantly by the energy required to maintain the resting state [Raichle et al.,2001], the higher lFCD would predict higher energy consumption and cerebral blood flow (CBF) for women than for men. Indeed, imaging studies have reported higher CBF per unit weight of brain [Gur et al.,1982] and higher brain glucose metabolism in women than in men [Baxter et al.,1987]. The gender‐related lFCD differences in this study also included regions of the default mode network that show the highest glucose metabolic rate at rest [Langbaum et al.,2009], negative BOLD responses during cognitive functional MRI tasks [Tomasi et al.,2006], and whose activity is associated with the overall state of consciousness [Horovitz et al.,2009]. These regions seem to be among the first to show metabolic decrements in Alzheimer's disease (AD) [Small et al.,2000], which is believed to reflect the greater energetic requirements of these regions. Thus, the women's higher connectivity could help explain why female AD patients show greater impairments than male patients for the equivalent reduction in cerebral metabolic rate [Perneczky et al.,2007].
A previous study that assessed the functional connectivity of the brain in a larger data set from the same image repository using ICA reported that women have higher functional connectivity than men in the ventral precuneus and other regions of the default mode network [Biswal et al.,2010], which is in agreement with this study. The same study, however, also reported that men had higher functional connectivity strength in occipital temporal and parietal regions than in women. This study did not show any region where men had higher FCD than women. Taking into account that FCDM and ICA have different processing steps (FCDM: motion‐filtering and clustering and ICA: centering, whitening, and minimization of mutual information) and map different properties of the brain (FCDM: strength of the local functional connectivity and ICA: independent autocorrelated networks), the discrepancies most likely reflect the methodological differences between the studies.
The larger TBV as well as GM, WM, and CSF volume for men than for women is consistent with previous studies. It is known that women have smaller brain volumes than men [Gur et al.,1999], which, in part, reflects their smaller bodies [Cosgrove et al.,2007], and that women have a higher percentage of GM, whereas men have a higher proportion of WM [Gur et al.,1999]. Spatial normalization and the voxel‐wise approach to remove GM effects on lFCD effectively controlled for volumetric differences (TBV, GM, and WM) between men and women in this study.
The probability distribution of the lFCD decreased with the number of functional connections per voxel following a power scaling that is characteristic of the scale‐free networks [Barabasi,2009] and that has been previously reported in studies of functional connectivity [Tomasi and Volkow,2010; van den Heuvel et al.,2008]. For highly connected regions (k/k 0 > 10), the scaling factor was 33% higher for men than for women (P < 0.0001, comparison of slopes), suggesting that the balance between hubs and weakly connected nodes in the brain is different across genders.
In this study, we were unable to control for the menstrual cycle, which is relevant because menstrual fluctuation in sex hormones that are critical in the sexual differentiation of the brain [McEwen,2001] may also influence functional brain organization. The women's higher variability (probably introduced in part by the menstrual cycle) was partially compensated by the larger number of women in a way that the standard errors were not different for women and men (P > 0.2, t‐test) and remained below 3.7% for all ROIs in this study (Fig. 8).
Figure 8.
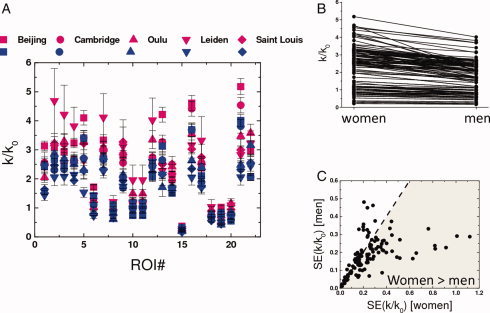
(A) Rescaled lFCD (k/k 0) for women (pink) and men (blue) for all ROI in Table II for different research sites (Table I). (B) Scatter plot exemplifying gender‐related lFCD differences for all 22 ROIs in Table II. (C) Scatter plot of the lFCD standard error (SE) for women versus that for men for all 22 ROIs in Table II demonstrating the larger lFCD variability for women than for men.
Though it is unclear how gender differences in functional organization map out into gender differences in cognitive and emotional behavior, we hypothesize that the men's lower brain connectivity might reflect optimization of functions that require specialized processing, such as spatial orienting, whereas the women's higher brain connectivity may optimize functions that require integration and synchronization across large cortical networks such as those supporting language. Indeed, brain imaging studies show that women have higher brain activation and better performance during difficult verbal tasks than men [Gur et al.,2000]. Differences in brain functional connectivity may also contribute to gender differences in the prevalence of neurodevelopmental diseases. For example, because autism spectrum disorder (ASD) has been linked to decreased local connectivity [Tommerdahl et al.,2008], the 5–10 times higher prevalence of ASD in men than in women [American Psychiatric Association,2000] could partially reflect the lower connectivity of the male brain. Overall, these results show significant gender differences in the functional organization of the human brain that may explain gender differences in behavior and emotions and that are consistent with the importance of sex chromosome genes in brain development and function [Nguyen and Disteche,2006].
REFERENCES
- Achard S, Salvador R, Whitcher B, Suckling J, Bullmore E ( 2006): A resilient, low‐frequency, small‐world human brain functional network with highly connected association cortical hubs. J Neurosci 26( 1): 63–72. [DOI] [PMC free article] [PubMed] [Google Scholar]
- American Psychiatric Association ( 2000): Diagnostic and Statistical Manual of Mental Disorders. Washington, DC: American Psychiatric Association. [Google Scholar]
- Ashburner J, Friston K ( 2000): Voxel‐based morphometry—The methods. Neuroimage 11( 6 Pt 1): 805–821. [DOI] [PubMed] [Google Scholar]
- Barabasi A ( 2009): Scale‐free networks: A decade and beyond. Science 325( 5939): 412–413. [DOI] [PubMed] [Google Scholar]
- Baxter LJ, Mazziotta J, Phelps M, Selin C, Guze B, Fairbanks L ( 1987): Cerebral glucose metabolic rates in normal human females versus normal males. Psychiatry Res 21( 3): 237–245. [DOI] [PubMed] [Google Scholar]
- Birn R, Murphy K, Bandettini P ( 2008): The effect of respiration variations on independent component analysis results of resting state functional connectivity. Hum Brain Mapp 29( 7): 740–750. [DOI] [PMC free article] [PubMed] [Google Scholar]
- Biswal B, Yetkin F, Haughton V, Hyde J ( 1995): Functional connectivity in the motor cortex of resting human brain using echo‐planar MRI. Magn Reson Med 34( 4): 537–541. [DOI] [PubMed] [Google Scholar]
- Biswal B, Mennes M, Zuo X, Gohel S, Kelly C, Smith S, Beckmann C, Adelstein J, Buckner R, Colcombe S, Dogonowski AM, Ernst M, Fair D, Hampson M, Hoptman MJ, Hyde JS, Kiviniemi VJ, Kötter R, Li SJ, Lin CP, Lowe MJ, Mackay C, Madden DJ, Madsen KH, Margulies DS, Mayberg HS, McMahon K, Monk CS, Mostofsky SH, Nagel BJ, Pekar JJ, Peltier SJ, Petersen SE, Riedl V, Rombouts SA, Rypma B, Schlaggar BL, Schmidt S, Seidler RD, Siegle GJ, Sorg C, Teng GJ, Veijola J, Villringer A, Walter M, Wang L, Weng XC, Whitfield‐Gabrieli S, Williamson P, Windischberger C, Zang YF, Zhang HY, Castellanos FX, Milham MP. ( 2010): Toward discovery science of human brain function. Proc Natl Acad Sci U S A 107( 10): 4734–4739. [DOI] [PMC free article] [PubMed] [Google Scholar]
- Cordes D, Haughton V, Arfanakis K, Carew J, Turski P, Moritz C, Quigley M, Meyerand M ( 2001): Frequencies contributing to functional connectivity in the cerebral cortex in “resting‐state” data. Am J Neuroradiol 22( 7): 1326–1333. [PMC free article] [PubMed] [Google Scholar]
- Cordes D, Haughton V, Carew J, Arfanakis K, Maravilla K ( 2002): Hierarchical clustering to measure connectivity in fMRI resting‐state data. Magn Reson Imag 20: 305–317. [DOI] [PubMed] [Google Scholar]
- Cosgrove K, Mazure C, Staley J ( 2007): Evolving knowledge of sex differences in brain structure, function, and chemistry. Biol Psychiatry 62( 8): 847–855. [DOI] [PMC free article] [PubMed] [Google Scholar]
- Foerster B, Tomasi D, Caparelli E ( 2005): Magnetic field shift due to mechanical vibration in functional magnetic resonance imaging. Magn Reson Med 54( 5): 1261–1267. [DOI] [PMC free article] [PubMed] [Google Scholar]
- Fox M, Raichle M ( 2007): Spontaneous fluctuations in brain activity observed with functional magnetic resonance imaging. Nat Rev Neurosci 8( 9): 700–711. [DOI] [PubMed] [Google Scholar]
- Gong G, Rosa‐Neto P, Carbonell F, Chen Z, He Y, Evans A ( 2009): Age‐ and gender‐related differences in the cortical anatomical network. J Neurosci 29( 50): 15684–15693. [DOI] [PMC free article] [PubMed] [Google Scholar]
- Gur R, Gur R, Obrist W, Hungerbuhler J, Younkin D, Rosen A, Skolnick B, Reivich M ( 1982): Sex and handedness differences in cerebral blood flow during rest and cognitive activity. Science 217( 4560): 659–661. [DOI] [PubMed] [Google Scholar]
- Gur R, Alsop D, Glahn D, Petty R, Swanson C, Maldjian J, Turetsky B, Detre J, Gee J, Gur R ( 2000): An fMRI study of sex differences in regional activation to a verbal and a spatial task. Brain Lang 74( 2): 157–170. [DOI] [PubMed] [Google Scholar]
- Gur RC, Turetsky BI, Matsui M, Yan M, Bilker W, Hughett P, Gur RE ( 1999): Sex differences in brain gray and white matter in healthy young adults: Correlations with cognitive performance. J Neurosci 19( 10): 4065–4072. [DOI] [PMC free article] [PubMed] [Google Scholar]
- Horovitz S, Braun A, Carr W, Picchioni D, Balkin T, Fukunaga M, Duyn J ( 2009): Decoupling of the brain's default mode network during deep sleep. Proc Natl Acad Sci U S A 106( 27): 11376–11381. [DOI] [PMC free article] [PubMed] [Google Scholar]
- Lancaster J, Woldorff M, Parsons L, Liotti M, Freitas C, Rainey L, Kochunov P, Nickerson D, Mikiten S, Fox P ( 2000): Automated Talairach atlas labels for functional brain mapping. Hum Brain Mapp 10( 3): 120–131. [DOI] [PMC free article] [PubMed] [Google Scholar]
- Lancaster J, Tordesillas‐Gutiérrez D, Martinez M, Salinas F, Evans A, Zilles K, Mazziotta J, Fox P ( 2007): Bias between MNI and Talairach coordinates analyzed using the ICBM‐152 brain template. Hum Brain Mapp 28( 11): 1194–1205. [DOI] [PMC free article] [PubMed] [Google Scholar]
- Langbaum J, Chen K, Lee W, Reschke C, Bandy D, Fleisher A, Alexander G, Foster N, Weiner M, Koeppe R, Jagust WJ, Reiman EM; Alzheimer's Disease Neuroimaging Initiative ( 2009): Categorical and correlational analyses of baseline fluorodeoxyglucose positron emission tomography images from the Alzheimer's Disease Neuroimaging Initiative (ADNI). Neuroimage 45( 4): 1107–1116. [DOI] [PMC free article] [PubMed] [Google Scholar]
- McEwen B ( 2001): Invited review: Estrogens effects on the brain: Multiple sites and molecular mechanisms. J Appl Physiol 91( 6): 2785–2801. [DOI] [PubMed] [Google Scholar]
- Mikula S, Niebur E ( 2006): A novel method for visualizing functional connectivity using principal component analysis. Int J Neurosci 116( 4): 419–429. [DOI] [PubMed] [Google Scholar]
- Mugler JP, Brookeman JR ( 1990): Three‐dimensional magnetization‐prepared rapid gradient‐echo imaging (3D MP RAGE). Magn Reson Med 15( 1): 152–157. [DOI] [PubMed] [Google Scholar]
- Nguyen D, Disteche C ( 2006): Dosage compensation of the active X chromosome in mammals. Nat Genet 38( 1): 47–53. [DOI] [PubMed] [Google Scholar]
- Perneczky R, Drzezga A, Diehl‐Schmid J, Li Y, Kurz A ( 2007): Gender differences in brain reserve: An (18)F‐FDG PET study in Alzheimer's disease. J Neurol 254( 10): 1395–1400. [DOI] [PubMed] [Google Scholar]
- Raichle ME, MacLeod AM, Snyder AZ, Powers WJ, Gusnard DA ( 2001): A default mode of brain function. Proc Natl Acad Sci U S A 98: 676–682. [DOI] [PMC free article] [PubMed] [Google Scholar]
- Small G, Ercoli L, Silverman D, Huang S, Komo S, Bookheimer S, Lavretsky H, Miller K, Siddarth P, Rasgon N, Mazziotta JC, Saxena S, Wu HM, Mega MS, Cummings JL, Saunders AM, Pericak‐Vance MA, Roses AD, Barrio JR, Phelps ME ( 2000): Cerebral metabolic and cognitive decline in persons at genetic risk for Alzheimer's disease. Proc Natl Acad Sci U S A 97( 11): 6037–6042. [DOI] [PMC free article] [PubMed] [Google Scholar]
- Tomasi D, Caparelli E ( 2007): Macrovascular contribution in activation patterns of working memory. J Cereb Blood Flow Metab 27( 1): 33–42. [DOI] [PMC free article] [PubMed] [Google Scholar]
- Tomasi D, Volkow N ( 2010): Functional connectivity density mapping. Proc Natl Acad Sci U S A 107( 21): 9885–9890. [DOI] [PMC free article] [PubMed] [Google Scholar]
- Tomasi D, Ernst T, Caparelli EC, Chang L ( 2006): Common deactivation patterns during working memory and visual attention tasks: An intra‐subject fMRI study at 4 Tesla. Hum Brain Mapp 27: 694–705. [DOI] [PMC free article] [PubMed] [Google Scholar]
- Tommerdahl M, Tannan V, Holden J, Baranek G ( 2008): Absence of stimulus‐driven synchronization effects on sensory perception in autism: Evidence for local underconnectivity? Behav Brain Funct 4: 19. [DOI] [PMC free article] [PubMed] [Google Scholar]
- Tzourio‐Mazoyer N, Landeau B, Papathanassiou D, Crivello F, Etard O, Delcroix N, Mazoyer B, Joliot M ( 2002): Automated anatomical labeling of activations in SPM using a macroscopic anatomical parcellation of the MNI MRI single‐subject brain. Neuroimage 15( 1): 273–289. [DOI] [PubMed] [Google Scholar]
- van de Ven V, Formisano E, Prvulovic D, Roeder C, Linden D ( 2004): Functional connectivity as revealed by spatial independent component analysis of fMRI measurements during rest. Hum Brain Mapp 22( 3): 165–178. [DOI] [PMC free article] [PubMed] [Google Scholar]
- van den Heuvel M, Stam C, Boersma M, Hulshoff Pol H ( 2008): Small‐world and scale‐free organization of voxel‐based resting‐state functional connectivity in the human brain. Neuroimage 43( 3): 528–539. [DOI] [PubMed] [Google Scholar]
- Worsley K, Evans A, Marrett S, Neelin P ( 1992): A three‐dimensional statistical analysis for CBF activation studies in human brain. J Cereb Blood Flow Metab 12( 6): 900–918. [DOI] [PubMed] [Google Scholar]