Summary
It is important to know the magnitude and patterns of joint loading in people with knee osteoarthritis (OA), since altered loads are implicated in onset and progression of the disease. We used an EMG-driven forward dynamics model to estimate joint loads during walking in a subject with knee OA and a healthy control subject. Kinematic, kinetic, and surface EMG data were used to predict muscle forces using a Hill-type muscle model. The muscle forces were used to balance the frontal plane moment to obtain medial and lateral condylar loads. Loads were normalized to body weight (BWs) and the mean of three trials taken. The OA subject had greater medial and lower lateral loads compared to the control subject. 75 to 80% of the total load was borne on the medial compartment in the control subject, compared to 90 to 95% in the OA subject. In fact, complete lateral unloading occurred during midstance for the OA subject. Loading for the healthy subject was consistent with the data from instrumented knee studies. In the future, the model can be used to analyze the impact of various interventions to reduce the loads on the medial compartment in people with knee OA.
Keywords: Knee, Osteoarthritis, Load, Walking, Musculoskeletal Modeling
INTRODUCTION
In knee osteoarthritis (OA), abnormal loading characteristics are thought to contribute to development and progression of joint degeneration [1,2]. Knee joint loads during walking far exceed body weight [3,4] not only due to the vertical acceleration of body weight as the limb contacts the ground, but also due to compression through muscle action. Assessment of muscle forces and joint contact loads is essential to fully understand mechanisms underlying incidence and progression of numerous musculoskeletal disorders including OA; however, direct measurement of muscle forces and joint contact loads is currently not feasible.
Data obtained using instrumented knee prostheses implanted during total knee arthroplasty (TKA) are the only direct way to measure joint contact forces in vivo and have provided invaluable insight into knee loading patterns [3,4]. Pre and post-TKA loading patterns are likely different because patients with TKA typically experience reduced pain and instability that may reduce muscle co-contraction during daily activities and thus reduce joint loads. Also, people with TKA undergo frontal plane realignment and a reduction of knee adduction moment (KAM) that could alter the mediolateral distribution of the total load compared to pre-operative patterns during walking [1,5]. Since loading patterns change after a TKA procedure, the need still exists to develop techniques to estimate articular loading in people with knee OA.
The KAM from inverse dynamics has been used a surrogate marker for medial compartmental loading in people with knee OA [5,10]. Although KAM is a promising biomechanical marker of OA progression, it is limited in its ability to provide information about mediolateral load sharing patterns. Also, being a net moment, it does not take into account muscle co-contraction at the knee and can underestimate the loading across the joint. Other investigators used detailed knee models, but none accounted for individual muscle activation patterns [6–9]. Muscle electromyographic (EMG) patterns in people with knee OA are characterized by high muscle co-contraction that investigators have presumed to result in higher muscle forces and higher joint loading [11,12]. Therefore, subject specific muscle activation patterns that are recorded using EMG can provide a higher level of accuracy when estimating muscle forces. However, the EMG-force relationship is time-varying, non-linear, and influenced by many factors including the type of contraction, force-length relationship, force-velocity relationship, pennation angles, and electromechanical delay [13]. Thus, estimating muscle forces from EMG activation patterns requires mathematical models that take into account factors that affect force production during movement.
Buchanan et al. used EMG based activations to calculate muscle forces in a model that accounted for many factors that affect the EMG-force relationship [13]. The model compares joint moments calculated from inverse dynamics to net moments calculated from an EMG driven forward dynamics model that uses mathematical optimization to minimize the difference between the two moments. The optimization process involves variables that characterize the EMG-force relationship based on the Hill-type muscle model. Recently, Besier et al. used this approach to estimate muscle forces around the knee during walking and running in subjects with patellofemoral pain [14]. Contrary to the common belief that subjects with patellofemoral pain generate less force in their vastus medialis muscles, they found that vastus medialis force during walking was no different from controls. In contrast, they found that people with patellofemoral pain use greater quadriceps-hamstrings co-contraction during walking; they speculated that muscle co-contraction could lead to excessive joint compression causing pain. Though they did not estimate joint loads, Besier et al. illustrate the importance of accounting for the influence of muscle activation when investigating factors involved in joint loading that may lead to impairment and disability. Different rehabilitation strategies would be designed and implemented for people in whom the vastus medialis produced inadequate force versus people that used excessive muscle co-contraction that increased the joint load.
An EMG-driven modeling approach has not been used to estimate articular loading in people with knee OA. We used an EMG-driven musculoskeletal modeling approach to compute medial and lateral tibiofemoral joint contact loads in a subject with knee OA and a healthy control subject.
METHODS
Subjects
A subject with medial knee OA and a healthy control were recruited from the community to participate in a larger study of neuromuscular control in people with knee OA. The subject with OA did not have any ligament or meniscus injuries and was diagnosed based on radiographic and clinical criteria established by the American College of Rheumatology [15]. Radiographs were used to rule out asymptomatic OA in the control subject. The testing protocol was approved by the Human Subjects Review Board at the University of Delaware. The subjects provided written consent prior to enrollment. Subject demographics are shown in Table 1.
Table 1.
Subject Characteristics: Age, Height, Body Mass Index, KL grade, Alignment.
| Control | OA | |
|---|---|---|
| Age (years) | 43 | 54 |
| Height (m) | 1.75 | 1.75 |
| Mass (kgs) | 104.7 | 68.0 |
| BMI (kg/m2) | 34.2 | 24.9 |
| KL grade Medial | 0 | 3 |
| KL grade Lateral | 0 | 0 |
| Alignment (degrees: varus < 180) | 177 | 176 |
Tibiofemoral Joint Alignment
Alignment was assessed using a standing AP radiograph in which the hip, knee, and ankle joints were visible. Alignment was determined by the angle (varus <180°, valgus >180°) of the mechanical axes of the femur and tibia [16].
Kinematic, Kinetics, and EMG
Subjects walked at their self-selected speed over-ground while kinematic data were collected at 120Hz using a passive 8-camera system (VICON MX, Oxford Metrics, UK), and ground reaction force data were recorded at 1080 Hz from a force platform (Bertec Corp, Columbus, OH). Muscle activity was recorded concurrently at 1080 Hz using a 16-channel system (Motion Lab Systems, Baton Rouge, LA), and the signals bandpass filtered between 20 and 500 Hz. Pre-amplified surface electrodes (20mm inter-electrode distance, 12mm disk diam) were placed over the mid-muscle belly of the semitendinosis (ST), biceps femoris (BFL), vastus medialis (VM), vastus lateralis (VL), rectus femoris (RF), and medial (MG) and lateral (LG) heads of the gastrocnemius [17]. EMG data for each muscle were also collected during maximum voluntary isometric contraction (MVIC) and resting baseline trials for normalization.
EMG driven forward dynamics musculoskeletal model
The model was described in detail elsewhere [13,18]; a summary of the methods is provided here. EMG signals were converted to a parameter called activation after taking into account electromechanical delay, time-varying nature of the EMG data, and the multiple factors in EMG-force relationship. The final model had 10 muscles: VM, VL, RF, MG, LG, ST, BFL, vastus intermedius (VI), biceps short head (BFS) and semimembranosus (SM). SM activation was assumed equal to that of ST; BFL and BFS activations were assumed to be equal. VI was taken as the average of VM and VL.
A degree-of-freedom model of the knee (generalized coordinates of flexion and ab/adduction) was developed in Software for Interactive Musculoskeletal Modeling (SIMM, MusculoGraphics, Inc.) [19]. Sagittal plane tibial translation was incorporated as a prescribed motion dependent on knee angle using functions included in the SIMM generic lower extremity model. The SIMM model and the generalized coordinates were used to calculate muscle-tendon lengths and flexion-extension moment arms for each muscle during each frame of data over the stance phase of level walking. Muscles with small cross-sectional area (i.e., tensor fascia lata, sartorius, and gracilis) were not included as they have a relatively small contribution to the total muscle force. The SIMM model was scaled to the subject’s anthropometrics using measurements from long cassette full length radiographs.
The muscle activations and scaled muscle tendon-lengths were input into a Hill-type muscle model that takes into account the force-length and force-velocity relationships after which individual muscle forces were calculated [13,18]. The calculated muscle forces were multiplied by their sagittal plane moment arms and summed to obtain the model-calculated net moment in the sagittal plane. Parameters were adjusted to minimize the difference between the estimated net moment from the forward dynamics EMG approach and the net knee moment calculated using the inverse dynamics approach. The optimization of the parameters was based on a simulated annealing process [20]. The parameters optimized were those involved in calculation of activation, those involved in the muscle model (optimal fiber length and tendon slack length), and maximum muscle force. Data from one walking trial were used to calibrate the musculoskeletal model, and then the optimized parameters were used to predict 3 other walking trials. The average data from the 3 predicted trials are presented without including the trial used for optimization.
Estimation of joint loads
Joint loads for the medial and lateral compartment were estimated using the algorithm developed by Winby et al. [21]. Internal moments from the muscle forces (as estimated by the model) were balanced against the external moments (measured from inverse dynamics) in the frontal plane. The external moment must be balanced by a combination of muscle forces and joint contact loads. A positive residual moment denotes compressive loading when the muscle forces are able to counter the external loads, and negative residual moment denotes the load being taken up by other passive structures, such as ligaments and capsule. The medial and lateral condylar contact points were assumed to lie at 25% of the scaled intercondylar width from the center of the knee. The loading calculated about the medial and lateral compartment was normalized to body weight to account for differences in the body sizes of the subjects. The loading for the medial and lateral compartment was also expressed as percentage of the total load to compare strategies for load sharing between the condyles.
RESULTS
Kinematics and Kinetics (Table 2)
Table 2.
Walking speed, sagittal and frontal plane peak angles and external moments in early (1st half) and late (2nd half) stance (Mean ± 1SD). Flexion and adduction are positive.
| Variables | Control | OA | |
|---|---|---|---|
| Walking speed (m/sec) | 1.3 (0.0) | 1.4 (0.0) | |
| Early Stance | Peak Knee Flexion Angle (Degrees) | 20.9 (1.6) | 16.3 (0.7) |
| Peak Knee Flexion Moment (%BW*Ht) | 4.5 (0.5) | 5.7 (0.2) | |
| Peak Knee Adduction Moment (%BW*Ht) | 2.3 (0.2) | 3.6 (0.1) | |
| Late Stance | Peak Knee Flexion Angle (Degrees) | 11.7 (0.2) | 4.0 (0.4) |
| Peak Knee Flexion Moment (%BW*Ht) | 0.0 (0.3) | -0.6 (0.4) | |
| Peak Knee Adduction Moment (%BW*Ht) | 1.7 (0.1) | 2.6 (0.0) |
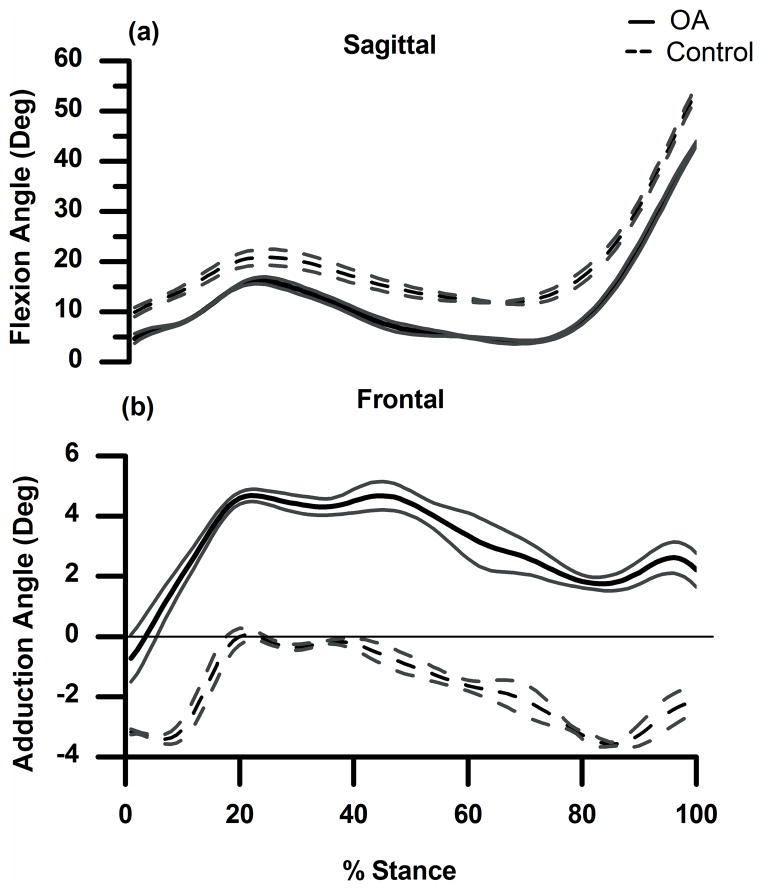
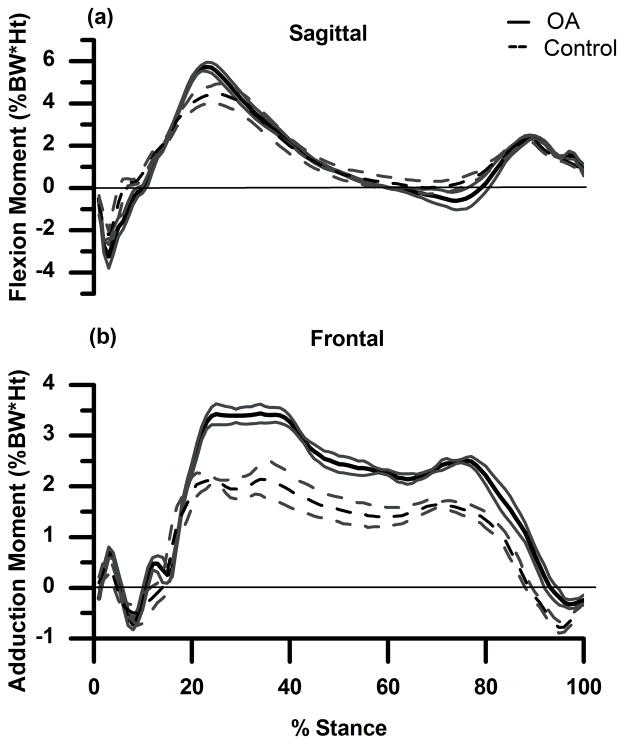
Both subject’s knees were similarly aligned (Table 1), and both walked at similar speeds. The control subject flexed the knee slightly more (Fig. 1a) throughout stance, and the OA subject was positioned in greater knee varus (Fig. 1b) throughout stance. The OA subject had greater peak external knee flexion moment during the 1st half of stance and greater peak external knee extension moment during the 2nd half of stance (Fig. 2a). In the frontal plane (Fig. 2b) the OA subject had a greater peak KAM compared to the control throughout stance.
Figure 1.
(a) and (b): Sagittal (a) and frontal (b) plane knee angles (mean ± 1SD in degrees) for OA subject (solid line) and control subject (dashed line). Flexion and adduction are positive.
Figure 2.
(a) and (b): External sagittal (a) and frontal (b) plane knee moments (mean ± 1SD in %BW*Ht) for OA subject (solid line) and control subject (dashed line). Flexion and adduction are positive.
EMG
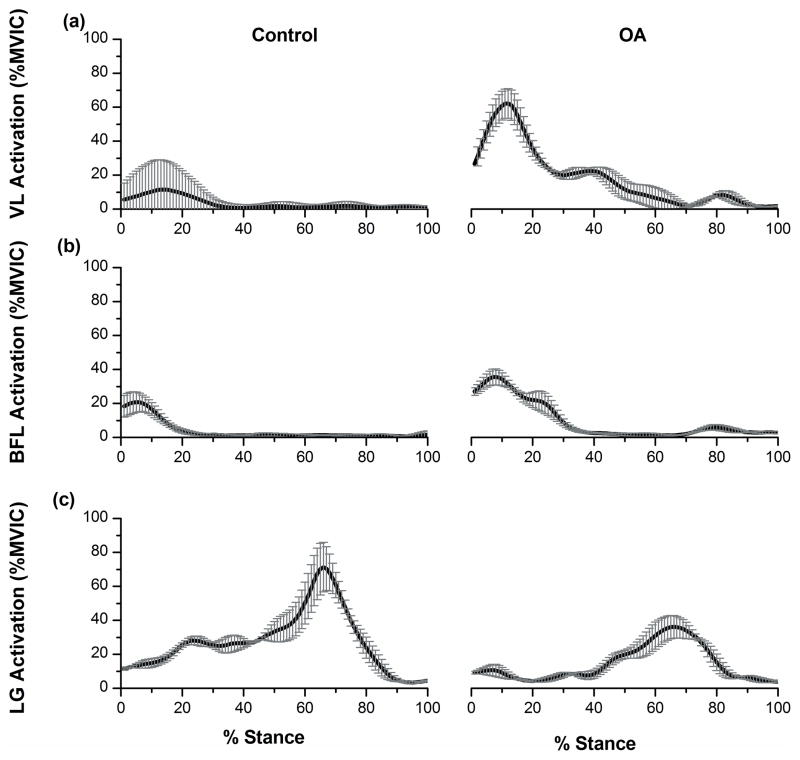
Data for lateral knee muscles are presented in Figure 3. The OA subject had higher VL and BFL activity in the first 20% of stance. During mid and late stance, the OA subject had higher VL activity, but no difference in BFL activity was found, and LG activity was lower. For the medial muscles, the OA subject had lower VM activity (peak of 18% MVIC in the 1st half) compared to the control subject (peak of 43% MVIC). ST activation was similar for the two subjects. The OA subject had much higher MG activity throughout stance (peak of 30% MVIC in the 1st half and peak of 43% MVIC in the 2nd half) compared to the control subject (peak of 4% MVIC and 24% MVIC).
Figure 3.
(a), (b) and (c): EMG activations (before optimization) (Mean±1SD in %MVIC) for lateral muscles: Vastus Lateralis (a), Biceps Femoris Long Head (b), and Lateral Gastrocnemius (c) for the control (Left) and OA (Right) subjects.
Model Predictions
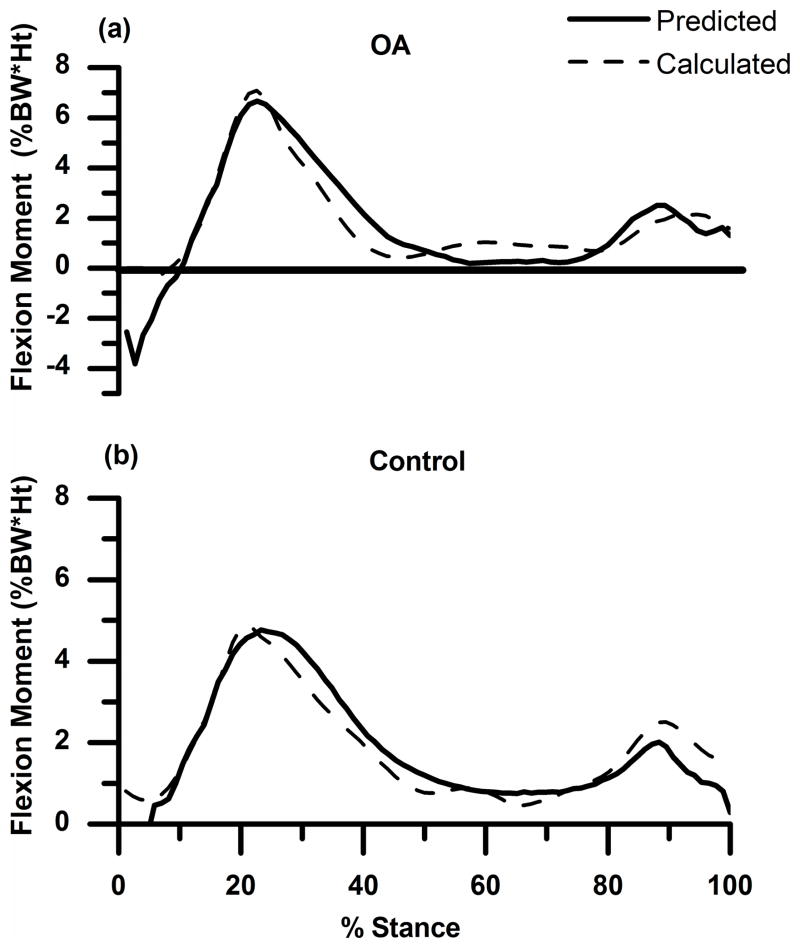
The sagittal plane knee moment predicted (not optimized) by the model matched well with the inverse dynamics knee moment (Fig. 4). The R2 (Mean±SD) and Root Mean Square (RMS) (Mean±SD) values between the predicted forward dynamics and calculated inverse dynamics sagittal plane moments for the average of the 3 predicted trials for the OA subject were 0.86±.02 and 7.8± .44, respectively. The values for the healthy subject were 0.84±0.02 and 12.2±1.6.
Figure 4.
(a) and (b): External sagittal plane knee moment (mean ± 1SD in %BW*Ht) calculated from inverse dynamics (dashed line) and predicted (not optimized) by the model (solid line) for the OA and control subjects for one trial. Flexion is positive.
Loading
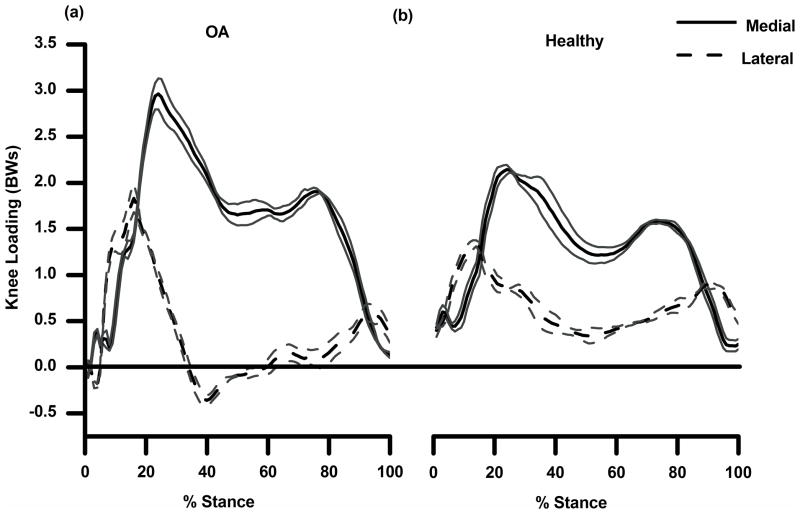
Peak medial and lateral compartment loading during the 1st and 2nd halves of stance for the subjects are shown in Figure 5. The OA subject had higher medial compartment loading as compared to the control subject during the 1st and 2nd halves of stance (Table 3). For the lateral compartment, the OA subject had higher loading during the 1st half and lower loading during the 2nd half of stance. The control subject used a strategy where the medial compartment was loaded up to 75 to 80% of the total load throughout stance whereas the OA subject maintained 95 to 100% of the total load on the medial compartment. The loading patterns suggest lateral compartmental unloading during midstance for the OA subject but not for the control subject. The lateral compartment had a greater share of the load in initial and terminal phases of stance when the total loads were low.
Figure 5.
(a) and (b): Medial (solid line) and lateral (dashed line) compartment loading during stance for OA (a) and control subject (b) as a mean of 3 trials with 1 SD.
Table 3.
Peak medial and lateral joint loading for the control and OA subject during the 1st and 2nd halves of stance. Joint loading is in body weights (BWs) and as a % of total load. NB: peak medial and lateral loading did not occur at the same time and therefore the % total load for the medial and lateral compartments does not add up to 100.
| Control | OA | Control | OA | ||
|---|---|---|---|---|---|
| In Bodyweights | In % Total | ||||
| EARLY STANCE | Medial Load | 2.06 | 2.96 | 74.9 | 100 |
| Lateral Load | 1.22 | 1.83 | 75.7 | 84.9 | |
| LATE STANCE | Medial Load | 1.47 | 1.91 | 81.3 | 95.4 |
| Lateral Load | 0.74 | 0.59 | 92.4 | 73.1 | |
DISCUSSION
Our aim was to demonstrate the application of an EMG-driven forward dynamics musculoskeletal model to estimate articular loads in a pathological condition that presents with altered movement and muscle activation patterns. The model predicted differential loading patterns for the OA and control subjects after accounting for individual muscle activation patterns and sagittal and frontal plane kinematics and kinetics. Our results verify previous speculations [11,12] about higher loading and altered mediolateral load distribution patterns in people with knee OA.
Data from instrumented knees have been used to validate results from musculoskeletal models [22]. The pattern of total loading calculated by our model is consistent with patterns demonstrated by the studies of walking in subjects with instrumented knees [3,4,23,24]. The peak total loading calculated by our model for the healthy subject (2.77 BWs) is comparable to those measured by an instrumented knee implant (2.1 to 2.8 BWs) [3,4,23,24]. A limited number of studies on subjects with instrumented knee prostheses report loading separately for medial and lateral condyles [25–27], and, when expressed as percent of total knee loading, the loading over the medial condyle is in the range of 53 to 92%. Kutzner et al. observed loading on the medial compartment to be from 60% of total load for a person with valgus alignment to 78 to 92% for a person with varus alignment. We found loading over the medial condyle to be 75 to 80% of the total load for the control subject, consistent with the limited amount of published data that exist.
The greater KAM during walking is a ubiquitous finding in people with knee OA, and indeed greater compressive load was confirmed by our model. However, the peak medial loading for our OA subject (~ 3BWs) was ~50% higher than that of the control subject (~ 2 BWs), a difference much greater than one might have predicted based on the difference in the inverse dynamics derived joint moments. Perhaps even more important was that at ~ 40% of stance the OA subject had “negative loading” of the lateral compartment, indicating the joint surfaces were not in contact and that lateral soft tissues were under tension. This finding is consistent with studies that have speculated that the entire load is transferred to the medial condyle in people with knee OA, and no contact occurs between the lateral femoral and tibial condyles, leading investigators to coin the phrase “lateral lift-off” [28,29]. The OA subject would need to generate higher forces in the lateral knee muscles to counter the greater external adduction moment. Failure of this muscle response would then require the load to be balanced by medial joint force. The EMG data (Fig. 3) show that at the time of lateral unloading (around 40% of the stance phase), the OA subject did have higher activation of VL but not higher BFL or LG activation. In fact, the OA subject had higher MG activation during the same period. Hence, the muscle response was likely abnormal and insufficient to counter the external adduction moment resulting in lateral unloading. The EMG patterns could also explain the finding of slightly greater internal extension moment in early stance for the OA subject, even though the subject flexed the knee less compared to the control. Overall extensor muscle activation (mean of RF, VL, VM) was higher for the OA (peak of 37% MVIC) compared to the control subject (peak of 19%) during 20 to 40% stance at the time of peak internal extension moment. Conversely, overall flexor muscle activation (mean of BFL, ST, MG, LG) was lower for the OA subject (peak of 10% MVIC) during the same period compared to the control (peak of 20% MVIC). The higher extensor compared to flexor activation could be associated with higher extension moments.
Presence of lateral lift-off as demonstrated by the model could be used to identify patients who might benefit from more extensive medical intervention (e.g., high tibial osteotomy or joint replacement). However, these data illustrate the importance of understanding the specific influence of muscle activation and movement patterns on joint loads that may not be inferred from the external joint moments typically used in motion analysis.
Data estimated from any modeling should be interpreted in light of certain limitations. In our model, knee ligaments and a number of small muscles were not included. Though these structures do not contribute significantly to sagittal plane stability, they may contribute to balancing the external load in the frontal plane. The loading magnitudes and patterns might be influenced by adding these muscles and the ligaments into the model. The model also did not include subject specific joint surface orientations or muscle insertions that would influence the muscle force calculations and thus the load calculations. Nonetheless, the agreement between the inverse dynamics moments with those determined by the model and the agreement between the loads predicted by instrumented knees and those predicted by our model provide strong evidence that the model-based estimations are physiologically feasible and thus acceptable.
In conclusion, the EMG-driven musculoskeletal modeling method predicted different loading patterns for a person with medial knee OA and a healthy control subject. The model accounted for subject specific anthropometric characteristics and movement and muscle activation patterns. While both subjects showed a double-peak pattern of joint loading, the subject with medial knee OA showed higher medial joint loading than the control subject in early stance, but the magnitude of the difference was much higher than expected. The model also predicted complete unloading of the lateral compartment during mid-stance. This is a clinically relevant finding that warrants further investigation. Studies with greater number of subjects are needed to confirm these findings and to investigate methods to reduce loading and promote better load sharing between the medial and lateral knee compartments.
Acknowledgments
Funding was provided by an International Society of Biomechanics Doctoral Dissertation Grant, an American College of Rheumatology-Research and Education Foundation Health Professional Graduate Student Preceptorship, a University of Delaware Graduate Fellowship, and NIH 1P20RR016458-01 and 1P20RR016458-06.
References
- 1.Andriacchi TP, Mundermann A. The role of ambulatory mechanics in the initiation and progression of knee osteoarthritis. Curr Opin Rheumatol. 2006;18:514–8. doi: 10.1097/01.bor.0000240365.16842.4e. [DOI] [PubMed] [Google Scholar]
- 2.Chaudhari AM, Briant PL, Bevill SL, et al. Knee kinematics, cartilage morphology, and osteoarthritis after ACL injury. Med Sci Sports Exerc. 2008;40:215–22. doi: 10.1249/mss.0b013e31815cbb0e. [DOI] [PubMed] [Google Scholar]
- 3.D’Lima DD, Patil S, Steklov N, et al. The Chitranjan Ranawat Award: in vivo knee forces after total knee arthroplasty. Clin Orthop Relat Res. 2005;440:45–9. doi: 10.1097/01.blo.0000186559.62942.8c. [DOI] [PubMed] [Google Scholar]
- 4.Heinlein B, Kutzner I, Graichen F, et al. ESB Clinical Biomechanics Award 2008: Complete data of total knee replacement loading for level walking and stair climbing measured in vivo with a follow-up of 6–10 months. Clin Biomech (Bristol, Avon) 2009;24:315–26. doi: 10.1016/j.clinbiomech.2009.01.011. [DOI] [PubMed] [Google Scholar]
- 5.Miyazaki T, Wada M, Kawahara H, et al. Dynamic load at baseline can predict radiographic disease progression in medial compartment knee osteoarthritis. Ann Rheum Dis. 2002;61:617–22. doi: 10.1136/ard.61.7.617. [DOI] [PMC free article] [PubMed] [Google Scholar]
- 6.Anderson FC, Pandy MG. Static and dynamic optimization solutions for gait are practically equivalent. J Biomech. 2001;34:153–61. doi: 10.1016/s0021-9290(00)00155-x. [DOI] [PubMed] [Google Scholar]
- 7.Taylor WR, Heller MO, Bergmann G, et al. Tibio-femoral loading during human gait and stair climbing. J Orthop Res. 2004;22:625–32. doi: 10.1016/j.orthres.2003.09.003. [DOI] [PubMed] [Google Scholar]
- 8.Shelburne KB, Torry MR, Pandy MG. Contributions of muscles, ligaments, and the ground-reaction force to tibiofemoral joint loading during normal gait. J Orthop Res. 2006;24:1983–90. doi: 10.1002/jor.20255. [DOI] [PubMed] [Google Scholar]
- 9.Hurwitz DE, Sumner DR, Andriacchi TP, et al. Dynamic knee loads during gait predict proximal tibial bone distribution. J Biomech. 1998;31:423–30. doi: 10.1016/s0021-9290(98)00028-1. [DOI] [PubMed] [Google Scholar]
- 10.Amin S, Luepongsak N, McGibbon CA, et al. Knee adduction moment and development of chronic knee pain in elders. Arthritis Rheum. 2004;51:371–6. doi: 10.1002/art.20396. [DOI] [PubMed] [Google Scholar]
- 11.Hubley-Kozey C, Deluzio K, Dunbar M. Muscle co-activation patterns during walking in those with severe knee osteoarthritis. Clin Biomech (Bristol, Avon) 2008;23:71–80. doi: 10.1016/j.clinbiomech.2007.08.019. [DOI] [PubMed] [Google Scholar]
- 12.Schmitt LC, Rudolph KS. Muscle stabilization strategies in people with medial knee osteoarthritis: the effect of instability. J Orthop Res. 2008;26:1180–5. doi: 10.1002/jor.20619. [DOI] [PMC free article] [PubMed] [Google Scholar]
- 13.Buchanan TS, Lloyd DG, Manal K, et al. Neuromusculoskeletal modeling: estimation of muscle forces and joint moments and movements from measurements of neural command. J Appl Biomech. 2004;20:367–95. doi: 10.1123/jab.20.4.367. [DOI] [PMC free article] [PubMed] [Google Scholar]
- 14.Besier TF, Fredericson M, Gold GE, et al. Knee muscle forces during walking and running in patellofemoral pain patients and pain-free controls. J Biomech. 2009;42:898–905. doi: 10.1016/j.jbiomech.2009.01.032. [DOI] [PMC free article] [PubMed] [Google Scholar]
- 15.Altman R, Asch E, Bloch D, et al. Development of criteria for the classification and reporting of osteoarthritis. Classification of osteoarthritis of the knee. Diagnostic and Therapeutic Criteria Committee of the American Rheumatism Association. Arthritis Rheum. 1986;29:1039–49. doi: 10.1002/art.1780290816. [DOI] [PubMed] [Google Scholar]
- 16.Hsu RW, Himeno S, Coventry MB, et al. Normal axial alignment of the lower extremity and load-bearing distribution at the knee. Clin Orthop Relat Res. 1990:215–27. [PubMed] [Google Scholar]
- 17.Delagi EIJ, Perotto A. In: Anatomic guide for the electromyographer, the limbs. Thomas CC, editor. Springfield, IL: 1981. [Google Scholar]
- 18.Lloyd DG, Besier TF. An EMG-driven musculoskeletal model to estimate muscle forces and knee joint moments in vivo. J Biomech. 2003;36:765–76. doi: 10.1016/s0021-9290(03)00010-1. [DOI] [PubMed] [Google Scholar]
- 19.Delp SL, Loan JP. A graphics-based software system to develop and analyze models of musculoskeletal structures. Comput Biol Med. 1995;25:21–34. doi: 10.1016/0010-4825(95)98882-e. [DOI] [PubMed] [Google Scholar]
- 20.Goffe WL, Ferrier GD, Rogers J. Global optimization of stastical functions with simulated annealing. J Econometrics. 1994;60:65–99. [Google Scholar]
- 21.Winby CR, Lloyd DG, Besier TF, et al. Muscle and external load contribution to knee joint contact loads during normal gait. J Biomech. 2009;42:2294–300. doi: 10.1016/j.jbiomech.2009.06.019. [DOI] [PubMed] [Google Scholar]
- 22.Kim HJ, Fernandez JW, Akbarshahi M, et al. Evaluation of predicted knee-joint muscle forces during gait using an instrumented knee implant. J Orthop Res. 2009;27:1326–31. doi: 10.1002/jor.20876. [DOI] [PubMed] [Google Scholar]
- 23.D’Lima DD, Patil S, Steklov N, et al. Tibial forces measured in vivo after total knee arthroplasty. J Arthroplasty. 2006;21:255–62. doi: 10.1016/j.arth.2005.07.011. [DOI] [PubMed] [Google Scholar]
- 24.D’Lima DD, Steklov N, Fregly BJ, et al. In vivo contact stresses during activities of daily living after knee arthroplasty. J Orthop Res. 2008;26:1549–55. doi: 10.1002/jor.20670. [DOI] [PubMed] [Google Scholar]
- 25.Kutzner I, Heinlein M, Bender A, et al. Medio-lateral Force Distribution in the Knee Joint during Level Walking. 55th Annual Meeting of the Orthopaedic Research Society; 2010; New Orleans, LA, USA. [Google Scholar]
- 26.Mundermann A, Dyrby CO, D’Lima DD, et al. In vivo knee loading characteristics during activities of daily living as measured by an instrumented total knee replacement. J Orthop Res. 2008;26:1167–72. doi: 10.1002/jor.20655. [DOI] [PubMed] [Google Scholar]
- 27.Zhao D, Banks SA, D’Lima DD, et al. In vivo medial and lateral tibial loads during dynamic and high flexion activities. J Orthop Res. 2007;25:593–602. doi: 10.1002/jor.20362. [DOI] [PubMed] [Google Scholar]
- 28.Andriacchi TP. Dynamics of knee malalignment. Orthop Clin North Am. 1994;25:395–403. [PubMed] [Google Scholar]
- 29.Chang A, Hayes K, Dunlop D, et al. Thrust during ambulation and the progression of knee osteoarthritis. Arthritis Rheum. 2004;50:3897–903. doi: 10.1002/art.20657. [DOI] [PubMed] [Google Scholar]


