Abstract
Context
In this article we present “best practice” guidelines for monitoring socioeconomic inequalities in health status in the general population, using routinely collected data.
Methods
First, we constructed a set of critical appraisal criteria to assess the utility of routinely collected outcomes for monitoring socioeconomic inequalities in population health status, using epidemiological principles to measure health status and quantify health inequalities. We then selected as case studies three recent “cutting-edge” reports on health inequalities from the Scottish government and assessed the extent to which each of the following outcomes met our critical appraisal criteria: natality (low birth weight rate, LBW), adult mortality (all-cause, coronary heart disease [CHD], alcohol-related, cancer, and healthy life expectancy at birth), cancer incidence, and mental health and well-being.
Findings
The critical appraisal criteria we derived were “completeness and accuracy of reporting”; “reversibility and sensitivity to intervention”; “avoidance of reverse causation”; and “statistical appropriateness.” Of these, the most commonly unmet criterion across the routinely collected outcomes was “reversibility and sensitivity to intervention.” The reasons were that most mortality events occur in later life and that the LBW rate has now become obsolete as a sole indicator of perinatal health. Other outcomes were also judged to fail other criteria, notably alcohol-related mortality after midlife (“avoidance of reverse causation”); all cancer sites’ incidence and mortality (statistical appropriateness due largely to heterogeneity of SEP gradients across different cancer sites, as well as long latency); and mental health and well-being (“uncertain reversibility and sensitivity to intervention”).
Conclusions
We conclude that even state-of-the-art data reports on health inequalities by SEP have only limited usefulness for most health and social policymakers because they focus on routinely collected outcomes that are not very sensitive to intervention. We argue that more “upstream” outcome measures are required, which occur earlier in the life course, can be changed within a half decade by feasible programs and policies of proven effectiveness, accurately reflect individuals’ future life-course chances and health status, and are strongly patterned by SEP.
Keywords: Health inequalities/disparities, socioeconomic status, monitoring, epidemiology, Scotland
There is widespread enthusiasm in the “social determinants of health” literature for the routine monitoring of social differences in health status (Commission on Social Determinants of Health 2008; Evans et al. 2001; Marmot 2010). Less frequently discussed are the challenges of utilizing routinely collected data—typically based on vital statistics, hospitalizations, disease registries, and health surveys—to monitor population health. While many jurisdictions globally are struggling with how best to analyze and depict patterns and time trends in social inequalities in health status, few practical guidelines are available on how best to do this. Our article is based on the example of Scotland, which has had a long tradition of measuring, analyzing, and reporting on health inequalities by socioeconomic position (SEP). We found substantial evidence of rather steep socioeconomic inequalities in health going back several decades, as well as much recent analytic activity using cutting-edge statistical methods to monitor health inequalities by SEP, over time, in the entire population.
Our approach was to review both basic epidemiological principles for measuring the health status of populations and published articles comparing that status among subgroups in order to quantify health inequalities (Bone et al. 1995; Commission on Social Determinants of Health 2008; Evans et al. 2001; Harper and Lynch 2007, 2010; Harper et al. 2010; Low and Low 2004; Mackenbach and Kunst 1997; Marmot 2010; Murray, Salomon, and Mathers 2000; Wagstaff, Paci, and van Doorslaer 1991). Using the epidemiological principles we identified, we derived a set of critical appraisal criteria for judging the utility of various routinely collected (or survey-based) health outcomes and analytic approaches for measuring and monitoring health inequalities over time in a whole population.
Next we reviewed recent official reports by various branches of the Scottish government, as well as related published analyses of Scottish health inequalities by independent researchers, to identify the best-quality reports in this jurisdiction for the outcomes they selected, their analytic methods and reporting practices (in particular, the use of simple but informative graphic depictions) for describing patterns, and the trends found in socioeconomic inequalities in health.
The aim of our article is, therefore, to apply new “best practice” guidelines for measuring and monitoring health equalities in a population to the “best of the best” national reports that we have been able to identify, which happen to come from Scotland.
Rationale for Each of the Critical Appraisal Criteria
From our review of basic epidemiological principles and of published guidance on methods of analyzing and depicting socioeconomic health inequalities, we derived five epidemiological criteria and two criteria important to effective communication. We then used them to assess the utility of various outcomes and analytic approaches, measure socioeconomic inequalities in health status, monitor them over time, and influence the development of public health policy. These criteria, which we believe are applicable to reports on health inequalities in any population, are outlined in box 1. We next discuss their rationale.
BOX 1 Critical Appraisal Criteria for Measuring and Monitoring Population Health Inequalities by Socioeconomic Position.
-
Do the outcome and its statistical summary measures (including those for inequalities) have the following desirable epidemiological characteristics?
Reasonable completeness and accuracy of reporting. In the subpopulations of interest, does the selected measure mirror the true frequency/pattern of the outcome it purports to estimate?
Clear relevance to known social determinants of health. Based on current knowledge of its etiology, does the outcome reflect life-course stage-specific or cumulative exposures associated with socioeconomic position, such as material deprivation, childhood social and cognitive development, or social marginalization and exclusion?
Reversibility and sensitivity to intervention. As an indicator of health inequality, could the outcome be reasonably expected to change within a reasonable time frame, for example, within a decade after a promising policy or program intervention is implemented?
Avoidance of “reverse causation.” Does the choice of outcome, or of its analyses/summary statistics of inequality and their interpretation, consider that the depicted pattern of outcome occurrence by SEP might be due to a long process of morbidity leading to downward social mobility, so that when the health outcome (e.g., death or hospitalization) is observed, the SEP has been strongly influenced by the process of the illness itself and is therefore different from the SEP that preceded the illness?
Statistically appropriate methods of data analysis and depiction. As analyzed and depicted (including any summary statistics of inequality), does the outcome meet generally recognized standards in medical statistics, including avoiding biased measures of central tendency, checking the goodness of fit for statistical models (e.g., regression) that require distributional or linearity assumptions, and accurately depicting sampling error?
-
Does the indicator have the following desirable communication characteristics for use in knowledge transfer settings in public health policymaking?
Clarity of meaning for nonscientists. Can the indicator and the analyses and depictions used be readily understood by key decision makers, who often do not have any training in statistics or public health?
Lack of ambiguity in indicator's analysis or depiction. As analyzed and depicted, could the indicator lead those policymakers or public health professionals in charge of programs designed to reduce health inequalities to draw “the wrong conclusions”?
Criterion 1(A): Reasonable completeness and accuracy of reporting
We included this criterion because some routinely collected measures of population health status have long been known to have major sources of error and thus require much sophistication and caution in their interpretation. An example is the rate of notification of many infectious diseases, especially common ones, which are not easy to diagnose in primary care (e.g., pertussis or whooping cough). One reason is that such diseases, especially the milder cases, are clinically easy to confuse with other diseases and also that it is not routine practice to order sensitive and specific laboratory confirmatory tests (because of cost, or because the test results would not change patient management). Many decades of research have shown that such notifiable disease reports capture only a small fraction of the actual cases of common diseases that occur in the population, a fraction that is strongly unrepresentative because these reports are strongly associated with the cases’ severity and therefore the likelihood of hospitalization or death.
Criterion 1(B): Clear relevance to known social determinants of health
This criterion is intended to judge the “face validity” of a health outcome's credibility as a marker of differential health status by social status, in this case by SEP. Some important health outcomes are not strongly or consistently related to SEP across different societies or eras and so are less sensitive as indicators of SEP effects on health. Examples are the incidence of some cancers, such as colorectal cancer in the prescreening era; many blood and lymph tumors; single-gene disorders, such as sickle cell trait/disease and cystic fibrosis, that relate much more strongly to racial and ethnic differences in gene frequency rather than SEP per se; and conditions that have complex relationships with SEP, varying widely across settings, such as the prevalence of asthma.
Criterion 1(C): Reversibility and sensitivity to intervention
In this article we are concerned with prioritizing those indicators of health inequalities that can be influenced by modern health policy, programs, and practice. Variant Creutzfeld-Jacob (“mad-cow”) disease (vCJD) in jurisdictions with recent epidemics, such as the United Kingdom, is an example of an outcome that further control measures could not be expected to alter much, since the original source of dietary exposure—beef contaminated via the feeding of animal tissues to livestock before slaughter for human consumption—was eliminated some years ago, with any remaining cases that emerge in the future resulting from infections with the most prolonged incubation periods (decades, in some cases). Thus, while there may well be SEP-related differences in disease incidence in the United Kingdom, these are not generally analyzed by SEP, since they largely reflect only SEP-related differences in beef consumption many years ago and cannot now be modified by any known intervention.
A more challenging category of health outcome is the set of diseases whose onset follows some decades after a harmful exposure, like vCJD, but for which the exposure continues, thus making the problem amenable to policy or program interventions to prevent additional cases far into the future. The classic case is lung cancer due to smoking. In this article we acknowledge the importance of tracking such outcomes, despite the long lag between known causal exposures and the onset of disease, but caution against using these outcomes to demonstrate any short-term effects (i.e., occurring in less than a decade) from proven public health preventive interventions.
Criterion 1(D): Avoidance of “reverse causation”
This criterion relates to those health conditions that cause lengthy periods of disability, often leading to disruption of employment before hospitalization or subsequent death. As we will see later, chronic alcoholism is the quintessential example, but there are many others, such as multiple sclerosis and amyotrophic lateral sclerosis (Lou Gehrig's disease), which mainly affect adults in the prime of life. The concern here is related to the inference of SEP from the postal code of residence at the time of late-stage hospitalization or death, since such health conditions often lead to downward social and economic mobility through prolonged disablement before death. Accordingly, this “reverse causation” process—whereby the disease leads to a lower SEP—may be misinterpreted and the lower SEP may be regarded as a risk factor for the onset of the condition. In these cases, the SEP during the years before the disease took hold, rather than a SEP based on residence location in the late stages, is much more relevant to targeting preventive action at those most at risk.
Criterion 1(E): Statistically appropriate methods of data analysis and depiction
While we might assume that any well-trained public health professional or, certainly, researcher would use statistically appropriate indicators of trends in health inequalities, knowledge of such methods is constantly being updated by new advances in thinking. It is not uncommon for some previously recommended methods to no longer be thought of as optimal or for additional caveats about their use to be added. A good example is the exclusive use of multiplicative or “ratio”-based measures, such as relative risk, to compare rates of adverse health events in two or more social subpopulations, especially over time. As Harper and colleagues elegantly argued (Harper et al. 2010), such analyses tend to favor particular lines of argument about what is “unfair,” that is, a legitimate health inequity as opposed to a mere “inequality.” Most experts, now, however, favor the use of both “relative risk” and “attributable risk” (differences) in such analyses, to provide a more complete picture of what is really going on. Other examples of commonly observed but inappropriate uses of statistics are the use of biased measures of central tendency, such as means, in skewed distributions; failure to check for goodness-of-fit in statistical models with particular assumptions (e.g., the assumption of a linear relationship between rank-ordered SEP and the health outcome risk in question, required if slope or relative indices of inequality are to be validly used to summarize that inequality in one statistic (Bone et al. 1995; Commission on Social Determinants of Health 2008; Evans et al. 2001; Harper and Lynch 2007; Low and Low 2004; Mackenbach and Kunst 1997; Marmot 2010; Murray, Salomon, and Mathers 2000; Wagstaff, Paci, and van Doorslaer 1991); and failure to appropriately calculate or depict any sampling error (e.g., in survey-based outcomes).
Criterion 2(A): Clarity of meaning for nonscientists
While most national policymakers will have access to scientifically trained public health professionals to help them interpret statistical analyses of health status and inequality data, they do not always seek or take their advice, nor will the media or the public necessarily be able to do the same. Thus, important stakeholders may inadvertently misinterpret indicators of trends in health inequalities that have significantly nontransparent features unless they are prominently exposed. An example, of particular relevance to this paper's Scottish case studies of various health outcomes, is hospital admissions for acute coronary heart disease (CHD), a leading cause of adults’ admission to hospital and still the most frequent killer of middle-aged to older people in most countries (including Scotland). The complicating factor in this outcome is that even though the diagnostic criteria used to analyze hospital admission data can be made consistent both internationally and over time, these data do not include the very large fraction of incident cases of CHD that present as sudden death (since these cases either “died in the community” or else were “dead on arrival” at emergency departments and therefore were not admitted). Furthermore, in many jurisdictions (including Scotland), the population burden of CHD cases occurring in different SEP subpopulations has changed in recent decades. Much of this change is due to the long-term trend toward the early diagnosis and successful management of less severe CHD with a more benign prognosis, first in the more privileged SEP groups and only later, if at all, in the lowest SEP groups. In countries such as Scotland, this trend has led to very wide SEP-related differences in CHD mortality. Given these complicated features of “hospitalizations for acute CHD,” these SEP-related differences in this outcome remain only a very partial indicator of all incident and serious cases of the disease and so can be easily misinterpreted by nonexperts.
Criterion 2(B): Lack of ambiguity in indicator's analysis or depiction
Related to, but separate from, criterion 2(A), criterion 2(B) refers to the possibility that various observers may legitimately interpret an indicator quite differently. That is, their interpretations may have an intuitive basis, but they are not dependent on technical training per se. For example, “increased length of stay in hospital after birthing” could be seen as either (1) an indicator of the health care system's compassionate caring for the mother of the newborn, especially if she has no help available in the home when she is discharged there and has other children or adults to care for; or (2) an indicator of overly medicalized births, with the increased attendant risk of hospital-related complications (e.g., infection) and unjustified costs. The appropriate interpretation will obviously depend on the precise details of each case, information that is rarely available or applied to population-based analyses of health status.
Rationale for the Selection of Scottish Case Studies
By far the most comprehensive analyses of routinely collected health outcome data in Scotland, which derive recent patterns and time trends of health status by SEP, are three reports from the Scottish government's Health Analytic Services Division, “Long-Term Monitoring of Health Inequalities: Headline Indicators” (Scottish Government Health Analytical Services Division 2008), first published in September 2008, plus the updates (Scottish Government Health Analytical Services Division 2009, 2010), published in September 2009 and October 2010. Compared with similar reports from other countries, these reports, which were prepared by the expert Short Life Technical Advisory Group, are highly statistically sophisticated, building on an established tradition of academic excellence in Scottish studies of health inequalities (Carstairs and Morris 1991; Leyland et al. 2007; Macintyre 2007; Popham and Boyle 2010; Wood et al. 2006). More important, in no other countries have we been able to identify repeated regular analyses, using the same methods, of time trends over several years in SEP-related health inequalities at the national level, based on the very fine-grained assignment of SEP by local area characteristics and applied consistently across a wide range of routinely collected or survey-based health outcomes. Thus, for the purposes of this article, we—like others (Marmot 2010)—have regarded these reports as internationally state-of-the-art in the analysis and depiction of health inequalities.
Categories of Health Outcomes Analyzed in the Scottish Reports
The Scottish reports include analyses by SEP of the following widely used categories of routinely or survey-collected health outcomes:
Natality (from vital statistics birth registration data): low birth weight rates (i.e., the percentage of babies born with weights < 2500 g).
Mortality (from vital statistics death registration data): all-cause and cause-specific mortality rates (based on the International Classification of Diseases, ICD-10) for specific age groups of interest and sometimes for all age groups taken together, all of them standardized for age and gender when appropriate across SEP groups.
Healthy life expectancy at birth, from the most recent Scottish Household Survey or census data available on self-assessed health status, as well as current age-specific mortality rates (as described earlier).
Hospitalization (derived from hospital discharge data): ICD-10–based cause-specific rates, for specific age groups of interest and sometimes for all age groups taken together, all of them standardized for age and gender when appropriate across SEP groups.
Cancer incidence (from the national registry): overall (all anatomic-site) rates, for specific age-groups of interest, all of them standardized for age and gender when appropriate across SEP groups.
Survey-based measure of mental well-being (the Warwick-Edinburgh Mental Wellbeing Scale, WEMWEBS) from the most recent Scottish Health Survey.
Approaches Currently Utilized in Scottish Analyses of Health Inequalities by SEP
The three reports (Scottish Government Health Analytical Services Division 2008, 2009, 2010) we selected as case studies analyzed the outcomes just outlined using the following widely recommended methods for quantifying health inequalities by SEP (Harper et al. 2010; Harper and Lynch 2007, 2010; Low and Low 2004; Mackenbach and Kunst 1997; Murray, Salomon, and Mathers 2000; Wagstaff, Paci, and van Doorslaer 1991):
Graphical depiction of the “SEP dose-response gradient” of each outcome for a defined time period and across all deciles of SEP in the entire Scottish population. The SEP is measured by national decile of rank-ordered post-code-derived census data and unemployment statistics. These “data zone” statistics reflect the average SEP for the local population based on the Scottish Index of Multiple Deprivation (SIMD) (Leyland et al. 2007).1 Each health-outcome event for a given person is ecologically assigned the local-area mean value of the most recent Scottish Index of Multiple Deprivation, expressed as the national SIMD percentile-ranking of that area, as a measure of SEP. The area in question is defined as containing that person's home address when the event happened. The rank-ordered deciles of data zones take into account the actual population of each zone for the denominators at risk, so that each decile has the same total population. The high density of 6,505 data zones for a population of just over 5 million ensures that these area-based measures of SEP are reasonable proxies of individual-level SEP variables, thereby minimizing any misclassification bias with respect to the individuals’ SEP. Using individual-level SEP variables would require linking records of health, vital statistics, and census data. Although a promising initial study has just been completed at the Scottish Longitudinal Studies Centre, such linkage is not yet possible to use routinely (Popham and Boyle 2010).
Graphical depiction of the absolute range (between the top and bottom SIMD deciles) of the health outcome in question, again annually for the most recent series of ten to twelve calendar years available. Since these are the key graphical depictions in the Scottish reports, most of the figures in this article replicate them in order to give the full flavor of how the reports have cleverly used these simple graphs to communicate time trends in both health outcomes overall and health inequalities by SEP. Such a simplified measure of health inequalities has been criticized, however, because it ignores data from the middle of the SEP distribution (Harper and Lynch 2007, 2010). Nearly all the SEP dose-response gradients across the eleven health outcomes analyzed in these reports are virtually linear across Scottish SEP deciles, and each decile has the same total population by definition. Therefore, the usually recommended inequality indices of greater complexity—which take into account outcomes across the entire SEP distribution, such as the slope index of inequality (SII) and the relative index of inequality (RII),2 based on weighted regression—effectively collapse to become equivalent to simple linear regression. The extreme decile depictions thus tend to accurately reflect all the Scottish SEP distributions’ time trends for each outcome. The generalization of the extremely linear patterning of the eleven outcomes analyzed in the reports has two alcohol-related exceptions, both of which show a clear, nonlinear excess in the bottom SEP decile: (1) hospital admissions before age 75 and (2) to an even greater degree, alcohol-related mortality in midlife.
The annual computation and graphical depiction of the relative index of inequality (RII) (Evans et al. 2001; Harper et al. 2010; Harper and Lynch 2007, 2010; Low and Low 2004) for each health outcome for the most recent series of ten to twelve calendar years of available data. The authors of the reports correctly point out that this index should be used only when the dose-response gradient is approximately linear, which they assess “by eye” through graphing of the gradient to determine linearity.
Tabular presentation of the “scale/context” of each of the adverse health outcomes over time, based on—in the case of rates of events—the total number of numerator events in all of Scotland across SEP groups, the denominator population at risk in each group, and the overall age-standardized rate, for each year analyzed. For outcomes derived from survey data, such as healthy life expectancy, 95 percent confidence intervals for the population estimate are provided. For reasons of space, these data are not presented here but can be easily downloaded from the 2010 report (Scottish Government Health Analytical Services Division 2010, http://www.scotland.gov.uk/Resource/Doc/328340/0106137.pdf).
Results
Table 1 summarizes how each of the categories of health outcome fared when we applied our critical appraisal criteria (box 1) to the analyses and the graphical depictions of them, as presented in the 2008, 2009, and 2010 Scottish reports. Most of the health outcomes and their analyses/depictions meet the majority of the critical appraisal criteria, but in almost every case, either the outcome itself or at least one of the reports’ analyses/depictions of it, or sometimes both, falls short on one criterion.
Table 1.
Assessment of Utility of Outcomes for Monitoring Socioeconomic Inequalities in Health Status Using Critical Appraisal Criteria
| Outcome Category | |||||||||
|---|---|---|---|---|---|---|---|---|---|
| A. Mortality Based | |||||||||
| Criterion | All-Cause Mortality (age < 75) | CHD Mortality (age 45 to 74) | Alcohol-Related Mortality (age 45 to 74) | Total Cancer Mortality (age 45 to 74) | Healthy Life Expectancy at Birth | B. Hospitalizations (for Condition of Interest) | C. Natality (LBW rate) | D. Total Cancer Incidence (age < 75) | E. Mental Health and Well-being |
| 1. Epidemiological | |||||||||
| Completeness and accuracy of reporting | ✓ | ✓ | ✓ | ✓ | ✓ | ✓ | ✓ | ✓ | ✓ |
| Clear relevance to known social determinants of health | ✓ | ✓ | ✓ | ✓ | ✓ | ✓ | ✓ | ✓ | ? |
| Reversibility/sensitivity to intervention | ? (see text) | ? (see text) | ? (see text) | ? (see text) | ? (see text) | ? (see text) | ✗ (see text) | ? (see text) | ? (see text) |
| Avoidance of reverse causation | ✓ | ✓ | ✗ (see text) | ? | ✓ | ? (if chronic disability precedes admission) | ✓ | ✓ | ? (see text) |
| Statistical appropriateness (e.g., use of RII, lumping of heterogeneous outcomes) | ✓ | ✓ | ✗ (use of RII) | ✗ (lumping all cancer sites) | ✓ | ✓ | ✓ | ✗ (lumping all cancer sites) | ✓ |
| 2. Communication | |||||||||
| Clarity for nonscientists | ✓ | ✓ | ✓ | ✗ (obscures cancer sites’ mixed picture) | ? | ? (for acute CHD) | ✗ | ✗ (obscures cancer sites’ mixed picture) | ? (what does it mean?) |
| Unintended side effects | ✓ | ✗ (RII trend message) | ✓ | ✓ | ✓ | ✓ | ✓ | ✓ | ? |
Notes: ✓= no concerns /meets criterion; ✗= major concerns /criterion not met; ?= uncertain.
In the interests of space, we therefore focus on just those aspects of these three Scottish reports—marked as “X” or “?” in table 1—when those working in this field, in any jurisdiction, might in the future want to reconsider the specific health outcomes analyzed, the methods of analysis/graphical depictions used, or both.
Outcomes Based on Mortality Measures (Including Healthy Life Expectancy)
Over the last decade, the strikingly common quality of the depicted time trends for these Scottish mortality-based outcomes (figures 1, 2, 3, and 4), and also for the United Kingdom as a whole (Marmot 2010), is their remarkable temporal stability. There were, however, the following two exceptions:
Figure 1.
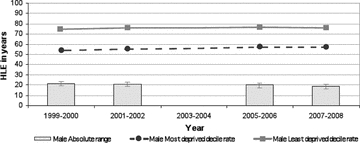
Absolute Range: Healthy Life Expectancy, Males, Scotland, 1999/2000 to 2007/2008 (data not available for 2003/2004) Source: Scottish Government Analytical Services Division 2010.
Figure 2.
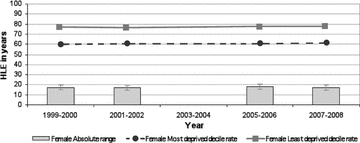
Absolute Range: Healthy Life Expectancy, Females, Scotland, 1999/2000 to 2007/2008 (data not available for 2003/2004) Source: Scottish Government Analytical Services Division 2010.
Figure 3.
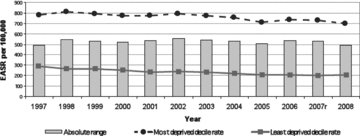
Absolute Range: All-Cause Mortality, Those Aged <75 years, Scotland, 1997–2008 (European age-standardized rates per 100,000)r = revised. Source: Scottish Government Analytical Services Division 2010.
Figure 4.
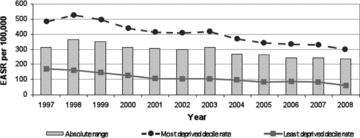
Absolute Range: CHD Mortality, Those Aged 45 to 74 years, Scotland, 1997–2008 (European age-standardized rates per 100,000) Source: Scottish Government Analytical Services Division 2010.
Exception 1: CHD mortality age 45 to 74 years (figure 4). This outcome has demonstrated major secular declines in almost every Western country over the last forty years, albeit somewhat delayed in the case of Scotland. Careful analyses on both sides of the Atlantic (Björck et al. 2009; Capewell and O'Flaherty 2008; Critchley, Capewell, and Unal 2003; Ford et al. 2007; Palmieri et al. 2010; Unal, Critchley, and Capewell 2004; Wijeysundera et al. 2010) have demonstrated that about 50 percent of the decline is due to reductions in fatal cases among patients under care, associated with the earlier and better diagnosis and treatment of CHD. The other 50 percent is due to reductions in the prevalence of population-level risk factors resulting from (1) primary prevention programs at the community level and (2) clinical activities designed to reduce smoking, improve diet, and increase physical activity, all of whose effects are not always possible to separate from the effects of spontaneous secular trends in culture and behavior.
Notably, although the “absolute difference” in CHD mortality between the top and bottom deciles of SEP in Scotland has declined by about 25 percent over the last decade, the RII has steadily risen over that period (figure 5). This steady increase in the RII over time is simply a reflection of the fact that in the overall population, CHD mortality—the denominator of RII—has fallen proportionately more than the absolute interdecile SEP gap has. Thus, as shown in table 1's CHD Mortality column, the RII fails an important critical appraisal criterion, that is, clear and accurate communication to a “lay” decision maker. In this case, although an adverse health outcome has declined steadily over time in all SEP groups, the inequalities index (RII) has grown larger each year (as it is computed by dividing the SII by the average rate in the entire population each year). This result is likely to raise the decision makers’ ire. Why should their administration have, according to the time trend in RII, “failed to have reduced health inequalities,” when in fact the absolute difference between those living in rich and poor areas has come down slightly, just because the RII formula penalizes this favorable time trend in its numerator (the “rich-poor gap”) by dividing it by a more rapidly declining overall population rate of the outcome in question (see figure 4)? Shouldn't a sensible index of inequality give credit for both reductions in absolute differences, as well as for improving the overall population over time? As Harper and colleagues argued (Harper et al. 2010), this is an example of a more general characteristic of the most commonly used measures and indices of inequality: they are “value laden.”
Figure 5.
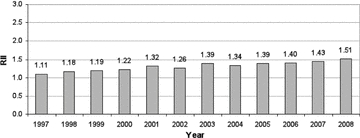
Relative Index of Inequality (RII): CHD Mortality, Those Aged 45 to 74 Years, Scotland, 1997–2008 (RII = SII divided by population mean rate) Source: Scottish Government Analytical Services Division 2010.
Exception 2: alcohol-related mortality, age 45 to 74 years (figure 6). For many years, this outcome has been increasing in frequency in all but the most privileged SEP groups, categorized by area of residence at death in Scotland, and much more rapidly in the most deprived. As table 1 indicates, however, this is one outcome in which the possibility of reverse causation is very real. Specifically, deaths in this age group result from insidious diseases such as cirrhosis of the liver, alcoholic cardiomyopathy, and alcohol-related diseases of the nervous system, which usually involve some years of alcohol-related chronic illness before death occurs (Hart et al. 2009). During this period, downward social mobility almost always results, as chronic heavy drinking impairs work and family functioning, often with a loss of employment and rejection from family life, all of which tend to force new housing arrangements. In turn, this housing often is in the cheapest available accommodation, usually in the city's most deprived areas. Therefore, according to the epidemiological criterion of “avoiding reverse causation,” this indicator fails, and no amount of additional analysis, using sophisticated inequality indices, can correct for this basic flaw. Of course, the record of where these deaths occur is accurate, but in this instance, it cannot necessarily be inferred that earlier-life or premorbid SEP is a fundamental driver of the large gap in mortality between rich and poor. Consequently, any early preventive action may well be mistargeted. If policymakers are interested in ways to improve the income, employment, and housing arrangements for late-stage alcoholics in treatment programs, then alcohol-related mortality analyzed by residence at death is directly relevant. However, if—as is usually the case for public health authorities—policymakers have more interest in preventing the onset of this condition by more “upstream” interventions (such as increasing the minimum price of alcohol), then this indicator might mislead them into thinking that SEP is an important risk marker for the onset of the condition, which is not at all what these data say.
Figure 6.
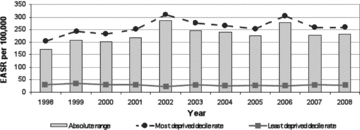
Absolute Range: Alcohol-Related Mortality, Those Aged 45 to 74 Years, Scotland, 1998–2008 (European age-standardized rates per 100,000) Source: Scottish Government Analytical Services Division 2010.
As a footnote, the SEP “dose-response gradient” for this outcome (figure 7) departs more from linearity than do any others depicted in the reports, showing both a concentration of mortality in the lowest decile of SEP (only) and a very suggestive small deficit of mortality in each of the SEP deciles immediately above the lowest. Thus, the SEP dose-response gradient looks as if some deaths from a more typical linear pattern (by earlier-life SEP) had been “displaced” to the lowest socioeconomic rung of the SEP ladder, as would be expected in a downward social mobility process, that is, the reverse causation just described. In this case, such a nonlinear pattern then would make it seem unwise to utilize the SII or RII for this outcome, since the SEP pattern is evidently not linear. The practical issue here is that while a biostatistical method is available to test for nonlinearity (Sergeant and Firth 2006), it has not been widely adopted, as it is rather complex, and there are no clear “policymaker eyeball test” guidelines for what constitutes a “biologically significant departure from linearity.” Each analyst therefore is left to make that judgment subjectively, which is surely not an ideal situation.
Figure 7.
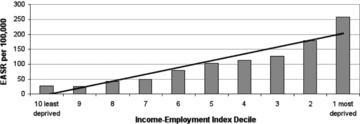
Alcohol-Related Mortality, Those Aged 45 to 74 by Income-Employment Index, Scotland, 2008 (European age-standardized rates per 100,000) Source: Scottish Government Analytical Services Division 2010.
To return to a more fundamental concern about the mortality-based measures of health inequalities analyzed in the three reports and discussed earlier, most of these measures appear to have been glacially slow to change over the last decade. The two exceptions, again, are coronary heart disease mortality rates (declining rapidly but approximately equally for all SEP population strata) and alcohol-related mortality past age 45. This apparent “epidemiological inertia” for these outcomes—despite many policy initiatives in Scotland since the 1990s to tackle them—is not especially surprising, since these outcomes, including healthy life expectancy, all incorporate mortality data in at least the “younger elderly” (i.e., age 65 to 75). While some of the mortality outcomes selected in the reports do truncate adult mortality past age 75, overall life expectancy in Scotland's lowest-SEP-decile population is only 67.7 years for men, versus 81.1 years in the top SEP decile, a difference of 13.4 years (National Statistics 2010). Thus, mortality rates for age ranges that include a large fraction of all deaths, as is the case for low-SEP data zones in all the Scottish reports’ analyses of mortality outcomes, even those truncated at age 75, are essentially tapping the final stages of foreshortened lives that were lived under adverse conditions for many decades.
The hard truth is that such end-of-life-loaded mortality rates are very slow to change, both because they are primarily due to chronic diseases resulting from a lifetime of adverse exposures and because they are subject to the “competing risks” of other causes of death. Thus, any successful disease-specific intervention that reduces only one cause of mortality in late life leaves the beneficiary at the mercy of many other equally high hazards of death, all of which peak in later life. Ergo the oft-cited demographic dictum from cause-deleted life-table calculations: Even the complete elimination of the major causes of death, such as all coronary heart disease or all cancers, would generally result in only comparatively small improvements in all-cause mortality or overall life expectancy in those populations in which most deaths occur in later life (Marmot and Mustard 1994).
In addition, a subtle and long-term latency effect links early-life conditions and late-life mortality risks, as presaged by the work of David Barker and colleagues (Barker 2001) over the years and highlighted by the cogent analyses by a Canadian group (Meza, Pourbohloul, and Brunham 2010). Specifically, the “set point” that determines the baseline rate, above which the mortality rate increases exponentially after age 45 for any particular birth cohort, has been shown to be tightly associated with the infant mortality rates (IMRs) for the whole jurisdiction, in the cohort's precise year of birth. In other words, a powerful driver of later-life mortality levels in each birth cohort appears—in data from several nations, analyzed across nearly a century of time—to be the general conditions of pregnancy and infancy, as proxied by societal IMR during that cohort's first year of life. This in turn implies that late-life mortality levels have an inbuilt lag effect, dating from one average life span earlier. Consequently, early life experiences have a significant “braking” or “damping” effect on the influence of factors more proximate in time to death, such as modern medical care.
These two general observations, together with the Scottish experience since the late 1990s depicted so clearly in the 2008, 2009, and 2010 reports, suggest that we should have only modest expectations for the influence of current policies and programs on the late-life mortality rates driving overall mortality and health expectancy in advanced societies. In particular, feasible and affordable interventions probably will not substantially shift overall later-life mortality rates within the usual policy lifetime of most democratically elected governments, which is typically five or, at most, ten years.
Hospitalization Outcomes
The Scottish reports analyze two disease-specific, but also predominantly later-life, hospitalization outcomes. One, alcohol-related admissions, follows the same pattern as alcohol mortality and suffers from the same potential, already discussed, for “reverse causation.” The other, closely related to CHD mortality, is admissions for those cases of “heart attack” (acute myocardial infarction) who “arrive alive” at hospital (figure 8).
Figure 8.
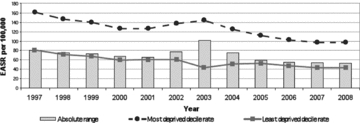
Absolute Range: Hospital Admissions for Heart Attack, Those Aged <75 years, Scotland, 1997–2008 (European age-standardized rates per 100,000) Source: Scottish Government Analytical Services Division 2010.
However, the epidemiological interpretation of those data is greatly complicated by a conundrum. This is that the ratio of poorest-to-richest-SEP-deciles’ admission rates in recent years has stayed stable at about 2 to 2.5, to 1. The same ratio for all coronary disease mortality (figure 4) has also stayed stable, despite substantial declines in all SEP groups, but at a level of about 3.5 to 1 a decade ago, rising to nearly 5 to 1 in 2008. One possible explanation, currently under investigation, is that there continues to be a major excess of sudden cardiac death in the community among low-SEP Scots who never reach hospital, a phenomenon noted by investigators in the Scottish MONICA study more than a dozen years ago (Morrison et al. 1997). Thus while showing continued large inequalities by SEP, this major cause of hospitalization is complicated to interpret because it is so largely driven by cardiac sudden deaths outside hospital, which are not captured in it and yet show steep differences by SEP.
Outcomes Based on Natality (Birth Statistics)
Traditionally utilized indicators for monitoring health inequalities, especially near the beginning of life, have long included “proportion of babies born with low birth weights” (LBW, under 2500 grams). More recent perinatal epidemiological writings (Wilcox 2001), however, have demonstrated that this outcome is not very sensitive to feasible improvements in prenatal maternal health in the modern obstetrical era. Likewise, this outcome is not likely to be amenable in the short to medium term to any proven public health or social policy interventions aimed at reducing the health gap between rich and poor in Western countries. This dismal prognosis for LBW as a population measure of health status is also suggested by its recent Scottish time trends (figure 9), which show a flat trend line for mothers living in the highest-SEP areas in recent years (despite those mothers’ excellent health, as well as ready access to modern obstetrical care through the NHS). Scottish mothers living in the poorest areas showed a small short-term increase in LBW rates, which rose slowly until 2004, followed by a slow decline back to a level just below that of a decade ago. Thus, the absolute gap between the two has varied over a narrow range over the last decade, at least until 2007. (Note that one of the two most recent annual rates, that for 2007, has been revised at least once and that in the past, delayed reporting of very-low-birth-weight births, at the margin of viability where confusion with stillbirths can occur, can lead to LBW underestimates until the delay is corrected.)
Figure 9.
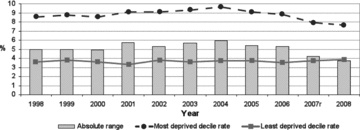
Absolute Range: Low Birth-Weight Babies, Scotland, 1998–2008 (as a percentage of all live singleton births)r = Revised Source: Scottish Government Analytical Services Division 2010.
The explanation for this apparent temporal stability is that developed nations have at least two opposing and quite independently driven time trends in modern birthing, which appear to make it almost impossible for any deliberate policies to reduce crude LBW rates (or SEP differences in those rates) substantially further in any one society (despite rather large relative inequalities in LBW rates between societies internationally). These time trends are as follows:
Modern obstetrics has almost perfected the early detection of fetal distress or growth retardation in utero, and it moves aggressively to induce labor (or, failing that, perform a cesarean section) in pregnancies so affected as soon as the baby reaches the gestational age range for which modern neonatal intensive care is capable of ensuring his or her survival (albeit, in some cases, with long-term complications of prematurity as a result). This approach to high-risk obstetric cases leads to a reduced rate of fetal death in utero and of small-for-gestational-age (SGA) babies at birth, who would otherwise be born later but in much worse condition. The former of these two very real benefits of modern obstetric care is not, however, given any credit in a health outcome based only on the birth weights of live-born babies (LBW) because birth weight has been “traded off” against fetal survival (Public Health Agency of Canada 2008). In addition, other factors related to increased maternal anthropometric measurements, including increased weight gain in pregnancy in combination with reductions in maternal smoking over time (although not in the lowest Scottish SEP groups and a likely contributor to their continued high LBW rates in recent years), have led to ever larger babies. This trend has been associated with not only reductions in the proportion of SGA infants at birth but also a subtle increase in full-term babies’ weights across the entire distribution of weights (Kramer et al. 2002; Public Health Agency of Canada 2008).
Overcoming these deficiencies of LBW as a useful indicator of either further population-wide improvements in perinatal health or reduced inequalities in birth outcomes by SEP requires the use of routinely collected gestational age data to allow the separation of the two components of LBW (preterm and SGA births). This in turn requires that ultrasound scan results in midpregnancy be readily linked to birth registration data at the individual maternal-infant pair level.
Pending the development, therefore, of more sensitive and discriminating perinatal outcomes through routine record linkage that includes gestational age data, crude LBW rates are unlikely to be useful indicators of either health improvement or reduced inequalities by SEP. They are now simply past their “best-before date” as sensitive indicators of perinatal health in the wake of major changes in human reproduction and its medical care.
Cancer Incidence and Mortality
Figures 10 and 11 from the 2010 Scottish “headline indicators” report summarize the absolute SEP gap in “all cancers’ incidence” and “all cancers’ mortality” for persons under 75 years of age, and persons 45 to 75 years of age, respectively, in recent years. While there has been a small decline in all cancers’ incidence and a slightly larger decline in mortality, these declines do not substantially differ by SEP. And yet in recent years, some cancers have greatly increased or declined in incidence, and some in mortality, so what is going on here?
Figure 10.
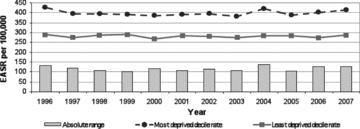
Absolute Range: All Cancers' Incidence, Those Aged <75 years, Scotland, 1996–2007 (European age-standardized rates per 100,000) Source: Scottish Government Analytical Services Division 2010.
Figure 11.
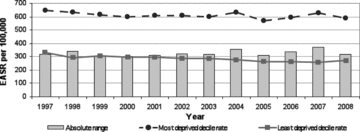
Absolute Range: All Cancers' Mortality, Those Aged 45 to 74 Years, Scotland, 1997–2008 (European age-standardized rates per 100,000) Source: Scottish Government Analytical Services Division 2010.
Data posted on line by the Information and Statistics Division (ISD) of NHS Scotland (http://www.isdscotland.org/isd/1508.html) show that Scottish cross-sectional gradients by SEP, in site-specific cancer incidence and mortality, vary greatly from one cancer site to another, just as they do elsewhere in the world (Harper and Lynch 2007). Indeed, these recent Scottish data show three divergent patterns of incidence by SEP, but not necessarily the same pattern for mortality in any given site. These patterns are (1) typical “gradient” directionality (poor areas’ rates greater than those of rich areas, in a steady gradient by SEP) for cancers related to specific health behaviors associated with low SEP, such as lung (smoking) and cervix (sexual activity); (2) reverse SEP-incidence gradients (rich areas’ rates greater than those of poor areas) for prostate (possibly linked to unofficially unsanctioned but widespread PSA screening, with differential requesting and uptake by SEP) and melanoma (probably linked to tanning parlors or holiday-related high-dose sun exposure over preceding decades); and (3) almost no SEP-incidence gradient at all, as in colorectal and breast cancer (the latter being rather surprising, given other international patterns, and possibly related to historically high doses of firsthand and secondhand tobacco smoking in Scottish women). This heterogeneity of these SEP gradients’ “shape” reflects the fact that these cancers are fundamentally different diseases with different etiologies, screening and diagnostic possibilities, and treatment effectiveness. The analysis or reporting of all the cancer sites’ data together as one entity serves only to conceal these important differences.
With respect to one other criterion, reversibility and sensitivity to intervention, for assessing the utility of indicators for monitoring SEP inequalities over time, there is a striking piece of historical evidence suggesting that we should not expect cancer—or, at least mortality rates for all cancers, pooled—to change within a few years of even cataclysmic exposure to stressors and social change. These are the data collated and analyzed by Leon and colleagues (Leon et al. 1997) concerning changes in cause-specific mortality patterns by age after the Soviet Union collapsed in the early 1990s. Although the ensuing and very prompt epidemic of midlife mortality, worse in men, was probably mediated in large part by major increases in alcohol consumption (particularly binge drinking), this does not alter the fact that the entire society went through devastating personal, familial, and community distress, which is clearly manifested in major increases in all-cause mortality (figure 12). However, when analyzed separately, only mortality for all “neoplasms” (figure 13) (i.e., all cancers), out of several categories of cause-specific mortality, remained completely unchanged in the three-year period that followed the onset of these massive Soviet regime changes in 1991. Whether a longer follow-up might have revealed etiologically or prognostically mediated (but substantially lagged) deteriorations in overall cancer mortality at a later point in time is unclear. All we can say is that an epidemic of psychosocial stressors, associated in this case with major social and economic failure of a whole modern society beginning in 1991, was not manifest in detectable cancer mortality shifts in the following three years. Whatever cancers killed those patients during that time were presumably already—and inexorably—en route to their fatal consequences, quite independently of the biopsychological effects of the societal “crash.” This is a sobering reminder of the long-established epidemiological observation that cancer incidence and mortality statistics (pooled across sites or not) are unlikely—because of the long latencies involved in their pathogenesis—to be promptly responsive to preventive measures that change “lifestyle exposures” or other primary causes of cancer. Cancer incidence rates, and even mortality rates, should therefore not figure prominently in routinely collected and analyzed measures of health inequalities used to monitor entire populations, at least for the purposes of public health policy planning and evaluation in the shorter run.
Figure 12.
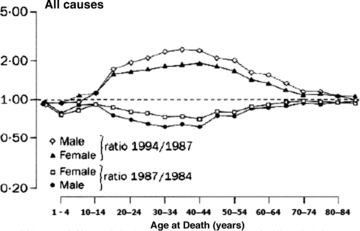
All-Cause Mortality, USSR, 1984–1994 Source: Leon et al. 1997 (page 385).
Figure 13.
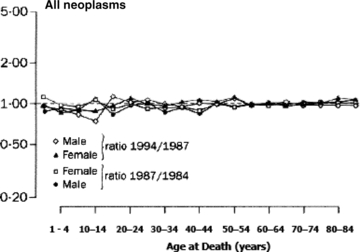
Mortality from Neoplasms, USSR, 1984–1994 Source: Leon et al. 1997 (page 385).
Survey-Based Mental Health and Well-being Outcomes
This survey-based class of outcomes, of which one example—the Warwick-Edinburgh Mental Wellbeing Scale—is analyzed in the Scottish reports (figure 14), meets many of the criteria listed in table 1. Such data describe the current health and function of a representative sample of the entire population, rather than the pattern by SEP of mostly later-life end-stage events such as hospitalization and death. The key critical appraisal criterion for this outcome, however, is different. Specifically, are we sure that these questionnaire-based outcomes, as measured in surveys, would be reasonably rapidly responsive to feasible policy or program interventions to improve health and reduce inequalities? In fact, very little is known about how such psychometric measures vary over time in the general population or among subgroups by SEP or about their relationship with clinically evident mental health diagnoses. It is probable that such measures of mental health and well-being are influenced by many factors, including the current economic recession. Nonetheless, disabling mental health problems, especially anxiety and depression, are extraordinarily common in all human populations, and there is increasing evidence that they (1) often have their roots in early childhood experiences (Hertzman 2010; Irwin, Siddiqi, and Hertzman 2007) and (2) tend to decline significantly only when living conditions, paradoxically, become rather harsh, greatly constraining human behavior, as in wartime.
Figure 14.
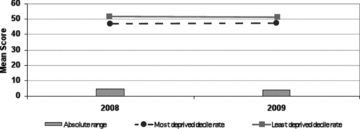
Absolute Range: Mean WEMWBS Score, Scotland, 2008/2009 Source: Scottish Government Analytical Services Division 2010.
It is unclear, therefore, whether these measures can be changed in a relatively short time period by healthy public policies or public health programs, no matter how well they are designed. The best way to find out is to continue to measure these outcomes widely in populations over time, using the same instrument, and to see if these outcomes do change, particularly in the evaluation of specific public health interventions, in what direction, and in what time frame.
As the 2010 Scottish report shows, that jurisdiction has collected to date only two consecutive years of such data, from the Scottish Health Surveys in 2008 and 2009, which show absolutely no difference over a one-year period in either “rich” or “poor” area residents’ mean scores, despite the advent of a severe economic recession during that intervening year. In addition, while the SEP dose-response gradient for this psychometric outcome is almost perfectly linear across the ten SEP deciles (Scottish Government Health Analytical Services Division 2010, 9–10, data not shown), the difference between the top and bottom SIMD deciles’ scores is only about 10 percent of the overall population mean, not a very large SEP differential to start with. This is surely an unpromising characteristic for a “headline indicator” of health inequalities, although in itself it does not tell us whether any feasible public health interventions are likely to reduce that SEP gradient in this outcome. It also does not tell us whether, as may well be the case, these patterns of mental health and well-being have deeper roots, particularly in early life (Hertzman 2010; Irwin, Siddiqi, and Hertzman 2007), that may make them very hard to change, especially in adulthood.
Recommendations: Indicators of Health Inequalities That Are “Reversible and Sensitive to Change”
Of all the criteria for adequately monitoring population-level health inequalities and the impact of healthy public policies or public health programs, “reversibility and sensitivity to change” is the one most frequently unmet by the routinely collected data analyses in the Scottish reports (table 1). The reason is largely that the sorts of routinely collected outcomes just described (with the exception of LBW rates and survey data), which are those generally available in developed countries, concern mostly later-life end-stage events. Specifically, these events are the occurrence of and death from chronic diseases, most of which have relatively long “latencies” between initial risk-factor exposure and actual disease manifestation.
To move this entire surveillance enterprise “upstream” would therefore entail the increased use of indicators of health and function that
occur earlier in the life-course,
can be changed within five to ten years through feasible programs and policies of proven effectiveness, affordability, and acceptability,
accurately reflect the future “life-course chances” and health status of each individual, and
are strongly patterned by SEP.
The work of the World Health Organization's Commission on Social Inequalities (Commission on Social Determinants of Health 2008), specifically its Early Life Knowledge Network, based in Vancouver, BC, Canada, under the direction of Prof. Clyde Hertzman of the University of British Columbia (Hertzman 2010; Hertzman and Williams 2009; Irwin, Siddiqi, and Hertzman 2007; Keating and Hertzman 1999; Kirky 2010), strongly suggests that an ideal class of such indicators would be standardized measures of children's physical, cognitive, emotional, and social development, such as the Early Development Instrument (EDI), for use at school entry. This simple questionnaire, completed by first-year primary-school teachers for all their classroom students on one day each year, is now used every few years throughout British Columbia, as well as other venues globally (including all of Australia), to monitor the “developmental health” (Keating and Hertzman 1999) of entire annual birth cohorts within a few months of their entry to school. An impressive feature of the EDI is that it very accurately predicts success throughout primary and secondary education, despite its simplicity and ease of administration, and therefore its relatively low costs (about one Primary 1 teacher's salary for one day for each data collection wave, for 2,000 to 2,500 people, at current crude birthrates and class sizes, in most developed nations).
Extensive analyses of the EDI results by the BC group under Hertzman reveal very high discriminant validity for small-area variations in child developmental health, which are intriguingly correlated with—but not entirely explained by—the average SEP in each local area. Indeed, Hertzman and his colleagues have shown that some community characteristics above and beyond SEP are very important to children's developmental well-being and that communities with these characteristics can usefully act as role models for other communities trying to improve children's outcomes (Kirky 2010). Most important, the large intervention literature on early childhood education programs clearly shows that such outcomes can be successfully turned around in entire communities within a few years, by simply providing programs of sufficiently high quality and “reach” into families of children at risk, at about age 2, so that by age 5 at school entry, the educational “playing field”—which presages the larger playing field of success in later life—is made fundamentally more level for children of varying SEP (Geddes, Haw, and Frank 2010; Hertzman 2010; Hertzman and Williams 2009; Irwin, Siddiqi, and Hertzman 2007; Keating and Hertzman 1999; Kirky 2010; Lloyd and Hertzman 2009).
In the longer run, measuring children's developmental health only at school entry is not enough. Also needed are “early warning” measurements that use validated instruments administered by “health visitors” and primary health care professionals, from the prenatal period through infancy and toddlerhood to the preschool period. As model programs of child developmental health surveillance in countries such as the Netherlands and Sweden have shown, such population-level measurements are ideally meshed with integrated and universal child care, educational, and health care systems that can promptly take action for children and families detected long before primary school entry as having developmental health problems or delays (Geddes, Haw, and Frank 2010; Hertzman 2010; Hertzman and Williams 2009; Irwin, Siddiqi, and Hertzman 2007; Keating and Hertzman 1999; Kirky 2010; Lloyd and Hertzman 2009).
The Future: Anonymous Record Linkage across Public-Sector Administrative Data
As demonstrated in at least three democratic jurisdictions (Western Australia, British Columbia, and Manitoba) outside the rather special cases of Scandinavia (Data Linkage WA 2010; Manitoba Centre for Health Policy 2006; University of British Colombia Centre for Health Services and Policy Research 2010), it is possible to anonymously link routinely collected administrative data from all the public sectors of human services that are the “first to know” when any family or individual has a major life stressor event with health or functional implications whether this is
treatment for a significant health problem,
new applications for unemployment insurance or welfare benefits as indicators of job loss (of a family member),
the advent of chronic disability benefits (of a family member),
a criminal conviction of a family member (or, in the case of children, being taken into custody),
school failure or “grade retention” (of children and youth),
legal separation or divorce (of parents), or
forced eviction from housing (of the family).
Arguably, the most important and common determinants of overall health and well-being in modern societies are experiences like these, occurring to oneself or one's circle of “significant others.” Consequently, it would behoove a modern nation-state to monitor the frequency over time of families/individuals experiencing any or all of these adverse outcomes and to do that monitoring by SEP.
As these jurisdictions have demonstrated, modern de-identified methods of data linkage are fully capable of ethically achieving this kind of holistic surveillance of “population well-being.” We suggest that the longer-term future of monitoring health and functional inequalities by SEP should include this kind of comprehensive, anonymous record linkage across the routinely collected administrative data of several sectors’ public services. As people live longer and longer, ever more deaths in each birth cohort will be delayed to an age where the precise timing or cause of their occurrence means less and less. Furthermore, general improvements in health status, innovative care arrangements, and new health care technologies are reducing the need for hospital admission to treat many conditions. In these circumstances, traditional population health outcomes based largely on mortality and hospitalization rates will soon be obsolete. Instead, sensitive but inexpensive population-level indicators of how “most living people are doing” should be developed.
Conclusion
We have tried to analyze, using a novel list of critical appraisal criteria, the strengths and weaknesses of three “state-of-the-art” reports from Scotland that monitor recent time trends in routinely collected population health outcomes, including their inequalities by socioeconomic position (SEP). In the end, we submit that even such state-of-the-art data analyses and depictions of these particular health outcomes are losing their relevance to most health and social policymakers and professionals. The time is thus ripe to develop new health and functional outcomes at the population level that are more rapidly responsive to feasible policy and program interventions to improve health, function, and well-being, across the full SEP spectrum in modern society. In so doing, we hope to help narrow the SEP gaps in those more meaningful outcomes, gaps that are still remarkably ubiquitous and persistent.
Acknowledgments
The authors gratefully acknowledge their many international and Scottish colleagues in public health and epidemiology who helped shape this article through discussions after its presentation on many occasions and in many settings over the last three years. Funding for this work came directly from the Medical Research Council (U.K.) and Chief Scientist Office (Scotland) to the Scottish Collaboration for Public Health Research and Policy.
Endnotes
The Scottish Index of Multiple Deprivation 2009 provides a small area–based measure of multiple deprivation. It is derived from income and employment indicators, selected for their accuracy and “recency” from among eight domains of the Scottish Index of Multiple Deprivation, namely, current income, employment, health, education, skills and training, housing, geographic access, and crime. For details, see National Statistics 2010, http://www.scotland.gov.uk/Topics/Statistics/SIMD/BackgroundMethodology.
The slope index of inequality (SII) is frequently used to reflect the socioeconomic dimension of inequalities in health. It is the weighted linear regression coefficient that shows along a socioeconomic scale the relation between the differences in the levels of health (or the frequency of a health problem) across the full hierarchical ranking of individuals in an entire population—for example by SEP. The relative index of inequality (RII) is a unit-less measure of the relative difference and is obtained by dividing the SII by the mean value for the indicator of interest for the population as a whole.
References
- Barker DJP. Fetal Origins of Cardiovascular and Lung Disease. New York: Dekker; 2001. [Google Scholar]
- Björck L, Rosengren A, Bennett K, Lappas G, Capewell S. Modelling the Decreasing Coronary Heart Disease Mortality in Sweden between 1986 and 2002. European Heart Journal. 2009;30(9):1046–56. doi: 10.1093/eurheartj/ehn554. [DOI] [PubMed] [Google Scholar]
- Bone MR, Bebbington AC, Jagger C, Nicolaas G. Health Expectancy and Its Uses. London: HMSO; 1995. [Google Scholar]
- Capewell S, O'Flaherty M. What Explains Declining Coronary Mortality? Lessons and Warnings. Heart. 2008;94(9):1105–8. doi: 10.1136/hrt.2008.149930. [DOI] [PubMed] [Google Scholar]
- Carstairs V, Morris R. Deprivation in Scotland. Aberdeen: Aberdeen University Press; 1991. [Google Scholar]
- Commission on Social Determinants of Health. Closing the Gap in a Generation. Geneva: World Health Organization; 2008. [Google Scholar]
- Critchley JA, Capewell S, Unal B. Life-Years Gained from Coronary Heart Disease Mortality Reduction in Scotland—Prevention or Treatment? Journal of Clinical Epidemiology. 2003;56(6):583–90. doi: 10.1016/s0895-4356(03)00059-3. [DOI] [PubMed] [Google Scholar]
- Data Linkage WA. 2010. Western Australia Record Linkage System. Available at http://www.datalinkage-wa.org/ (accessed June 20, 2011)
- Evans T, Whitehead M, Diderichsen F, Bhuiya A, Wirth M, editors. Challenging Inequities in Health: From Ethics to Action. New York: Oxford University Press; 2001. [Google Scholar]
- Ford ES, Ajani UA, Croft JB, Critchley JA, Labarthe DR, Kottke TE, Giles WH, Capewell S. Explaining the Decrease in US Deaths from Coronary Disease, 1980–2000. New England Journal of Medicine. 2007;356(23):2388–98. doi: 10.1056/NEJMsa053935. [DOI] [PubMed] [Google Scholar]
- Geddes R, Haw S, Frank J. Interventions for Promoting Early Development for Health. Edinburgh: Scottish Collaboration for Public Health Research and Policy; 2010. Available at http://www.scphrp.ac.uk/ (accessed July 4, 2011) [Google Scholar]
- Harper S, King NB, Meersman SC, Reichman ME, Breen N, Lynch J. Implicit Value Judgments in the Measurement of Health Inequalities. The Milbank Quarterly. 2010;88(1):4–29. doi: 10.1111/j.1468-0009.2010.00587.x. [DOI] [PMC free article] [PubMed] [Google Scholar]
- Harper S, Lynch J. Selected Comparisons of Measures of Health Disparities: A Review Using Databases Relevant to Healthy People 2010 Cancer-Related Objectives. Bethesda, MD: National Cancer Institute; 2007. [Google Scholar]
- Harper S, Lynch J. 2010. Measuring Health Disparities [teaching module]. University of Michigan School of Public Health. Available at http://sitemaker.umich.edu/mhd/home (accessed June 20, 2011)
- Hart CL, Smith GD, Upton MN, Watt GCM. Alcohol Consumption Behaviours and Social Mobility in Men and Women of the Midspan Family Study. Alcohol and Alcoholism. 2009;44(3):332–36. doi: 10.1093/alcalc/agn125. [DOI] [PubMed] [Google Scholar]
- Hertzman C. Tackling Inequality: Get Them While They're Young. BMJ. 2010;340:346–48. [Google Scholar]
- Hertzman C, Williams R. Making Early Childhood Count. Canadian Medical Association Journal. 2009;180(1):68–71. doi: 10.1503/cmaj.080512. [DOI] [PMC free article] [PubMed] [Google Scholar]
- Irwin LG, Siddiqi A, Hertzman C. 2007. Early Child Development: A Powerful Equalizer—Final Report [to the WHO's Commission on the Social Determinants of Health]. Available at http://www.who.int/social_determinants/publications/earlychilddevelopment/en/ (accessed June 20, 2011)
- Keating DP, Hertzman C. Developmental Health and the Wealth of Nations. New York: Guildford Press; 1999. [Google Scholar]
- Kirky T. 2010. Map of Needs Gives Kids a Start: Information. The Australian, June 5. Available at http://www.theaustralian.com.au/news/health-science/map-of-needs-gives-kids-a-start-information/story-e6frg8y6-1225875251794 (accessed June 20, 2011)
- Kramer MS, Morin I, Yang H, Platt RW, Usher R, McNamara H, Joseph KS, Wen SW. Why Are Babies Getting Bigger? Temporal Trends in Fetal Growth and Its Determinants. Journal of Pediatrics. 2002;141(4):538–42. doi: 10.1067/mpd.2002.128029. [DOI] [PubMed] [Google Scholar]
- Leon DA, Chenet L, Shkolnikov VM, Zakharov S, Shapiro J, Rakhmanova G, Vassin S, Mckee M. Huge Variation in Russian Mortality Rates 1984–94: Artefact, Alcohol, or What? The Lancet. 1997;350(9075):383–88. doi: 10.1016/S0140-6736(97)03360-6. [DOI] [PubMed] [Google Scholar]
- Leyland AH, Dundas R, McLoone P, Boddy FA. Glasgow: MRC Social & Public Health Services Unit; 2007. Inequalities in Mortality in Scotland 1981–2001. MRC Social & Public Health Services Unit Occasional Paper No. 16. [Google Scholar]
- Lloyd JEV, Hertzman C. From Kindergarten Readiness to Fourth-Grade Assessment: Longitudinal Analysis with Linked Population Data. Social Science & Medicine. 2009;68(1):111–23. doi: 10.1016/j.socscimed.2008.09.063. [DOI] [PubMed] [Google Scholar]
- Low A, Low A. Measuring the Gap: Quantifying and Comparing Local Health Inequalities. Journal of Public Health (Oxford) 2004;26(4):388–95. doi: 10.1093/pubmed/fdh175. [DOI] [PubMed] [Google Scholar]
- Macintyre S. Glasgow: MRC Social & Public Health Sciences Unit; 2007. Inequalities in Health in Scotland: What Are They and What Can We Do about Them? MRC Social & Public Health Services Unit Occasional Paper No. 17. [Google Scholar]
- Mackenbach JP, Kunst AE. Measuring the Magnitude of Socio-Economic Inequalities in Health: An Overview of Available Measures Illustrated with Two Examples from Europe. Social Science & Medicine. 1997;44(6):757–71. doi: 10.1016/s0277-9536(96)00073-1. [DOI] [PubMed] [Google Scholar]
- Manitoba Centre for Health Policy. 2006. Concept: Record Linkage. Available at http://www.umanitoba.ca/faculties/medicine/units/community_health_sciences/departmental_units/mchp/about.html (accessed July 4, 2011)
- Marmot M. Strategic Review of Health Inequalities in England post-2010. London: University College of London; 2010. Fair Society, Healthy Lives. The Marmot Review. Available at http://www.ucl.ac.uk/whitehallII/pdf/FairSocietyHealthyLives.pdf (accessed June 20, 2011) [Google Scholar]
- Marmot M, Mustard J. Coronary Heart Disease from a Population Perspective. In: Evans R, Barer M, Marmor T, editors. Why Are Some People Healthy and Others Not? New York: Aldine de Gruyter; 1994. [Google Scholar]
- Meza R, Pourbohloul B, Brunham RC. Birth Cohort Patterns Suggest That Infant Survival Predicts Adult Mortality Rates. Journal of Developmental Origins of Health and Disease. 2010;1(3):174–83. doi: 10.1017/S2040174410000218. [DOI] [PubMed] [Google Scholar]
- Morrison C, Woodward M, Leslie W, Tunstall-Pedoe H. Effect of Socioeconomic Group on Incidence of, Management of, and Survival after Myocardial Infarction and Coronary Death: Analysis of Community Coronary Event Register. BMJ. 1997;314(7080):541–46. doi: 10.1136/bmj.314.7080.541. [DOI] [PMC free article] [PubMed] [Google Scholar]
- Murray CJL, Salomon JA, Mathers C. A Critical Examination of Summary Measures of Population Health. Bulletin of the World Health Organization. 2000;78(8):981–94. [PMC free article] [PubMed] [Google Scholar]
- National Statistics. Scotland's Population 2009. The Registrar General's Annual Review of Demographic Trends. (155th ed) 2010 Available at http://www.gro-scotland.gov.uk/files2/stats/annual-review-09/rgar2009.pdf (accessed June 20, 2011) [Google Scholar]
- Palmieri L, Bennett K, Giampaoli S, Capewell S. Explaining the Decrease in Coronary Heart Disease Mortality in Italy between 1980 and 2000. American Journal of Public Health. 2010;100(4):684–92. doi: 10.2105/AJPH.2008.147173. [DOI] [PMC free article] [PubMed] [Google Scholar]
- Popham F, Boyle P. 2010. Assessing Socio-Economic Inequalities in Mortality and Other Health Outcomes at the Scottish National Level (Incorporating a Comparison between Mortality in Scotland and England). SCPHRP. Available at http://www.scphrp.ac.uk/ (accessed July 4, 2011)
- Public Health Agency of Canada. Canadian Perinatal Health Report. Ottawa: 2008. Available at http://www.phac-aspc.gc.ca/publicat/2008/cphr-rspc/index-eng.php (accessed June 29, 2011) [Google Scholar]
- Scottish Government Health Analytical Services Division. Long-Term Monitoring of Health Inequalities: First Report on Headline Indicators. 2008 Available at http://www.scotland.gov.uk/Publications/2008/09/25154901/0 (accessed June 20, 2011) [Google Scholar]
- Scottish Government Health Analytical Services Division. Long-Term Monitoring of Health Inequalities: Headline Indicators. 2009 Available at http://www.scotland.gov.uk/Publications/2009/09/25112211/0 (accessed June 20, 2011) [Google Scholar]
- Scottish Government Health Analytical Services Division. Long-Term Monitoring of Health Inequalities: Headline Indicators. 2010 Available at http://www.scotland.gov.uk/Publications/2010/10/25144246/0 (accessed June 20, 2011) [Google Scholar]
- Sergeant JC, Firth D. Relative Index of Inequality: Definition, Estimation, and Inference. Biostatistics. 2006;7(2):213–24. doi: 10.1093/biostatistics/kxj002. [DOI] [PubMed] [Google Scholar]
- Unal B, Critchley JA, Capewell S. Explaining the Decline in Coronary Heart Disease Mortality in England and Wales between 1981 and 2000. Circulation. 2004;109(9):1101–7. doi: 10.1161/01.CIR.0000118498.35499.B2. [DOI] [PubMed] [Google Scholar]
- University of British Colombia, Centre for Health Services and Policy Research. 2010. British Columbia Record Linkage System. Available at http://www.chspr.ubc.ca/ (accessed December 23, 2010)
- Wagstaff A, Paci P, van Doorslaer E. On the Measurement of Inequalities in Health. Social Science & Medicine. 1991;33(5):545–57. doi: 10.1016/0277-9536(91)90212-u. [DOI] [PubMed] [Google Scholar]
- Wijeysundera HC, Machado M, Farahati F, Wang XS, Witteman W, van der Velde G, Tu JV, Lee DS, Goodman SG, Petrella R, O'Flaherty M, Krahn M, Capewell S. Association of Temporal Trends in Risk Factors and Treatment Uptake with Coronary Heart Disease Mortality, 1994–2005. JAMA. 2010;303(18):1841–47. doi: 10.1001/jama.2010.580. [DOI] [PubMed] [Google Scholar]
- Wilcox AJ. On the Importance—and the Unimportance—of Birthweight. International Journal of Epidemiology. 2001;30(6):1233–41. doi: 10.1093/ije/30.6.1233. [DOI] [PubMed] [Google Scholar]
- Wood R, Sutton M, Clark D, McKeon A, Bain M. Measuring Inequalities in Health: The Case for Healthy Life Expectancy. Journal of Epidemiology and Community Health. 2006;60(12):1089–92. doi: 10.1136/jech.2005.044941. [DOI] [PMC free article] [PubMed] [Google Scholar]


