

Abstract
Moist mucosal epithelial interfaces that are exposed to external environments are dominated by sugar epitopes, some of which (e.g., sialic acids) are involved in host defense. In this study, we determined the abundance and distribution of two sialic acids to assess differences in their availability to an exogenous probe in isolated mucins and mucous gels. We used atomic force microscopy to obtain force maps of human preocular mucous and purified ocular mucins by probing and locating the interactions between tip-tethered lectins Maackia amurensis and Sambucus nigra and their respective receptors, α-2,3 and α-2,6 N-acetylneuraminic (sialic) acids. The rupture force distributions were not affected by neighboring sugar-bearing molecules. Energy contours for both lectin-sugar bonds were fitted to a two-barrier model, suggesting a conformational change before dissociation. In contrast to data from purified mucin molecules, the preocular gels presented numerous large clusters (19,000 ± 4000 nm2) of α-2,6 sialic acids, but very few small clusters (2000 ± 500 nm2) of α-2,3 epitopes. This indicates that mucins, which are rich in α-2,3 sialic acids, are only partially exposed at the surface of the mucous gel. Microorganisms that recognize α-2,3 sialic acids will encounter only isolated ligands, and the adhesion of other microorganisms will be enhanced by large islands of neighboring α-2,6 sialic acids. We have unveiled an additional level of mucosal surface heterogeneity, specifically in the distribution of pro- and antiadhesive sialic acids that protect underlying epithelia from viruses and bacteria.
Introduction
Mucosal epithelia (e.g., of the eye and respiratory and gastrointestinal tracts) are overlaid by a network of mucins, which are very high molecular mass glycoconjugates (≥4 × 10⁴ kDa) whose peptide backbones carry extensive O-glycosylation. A high proportion of human ocular mucin sugar chains terminate in negatively charged α-2,3 and α-2,6 N-acetylneuraminic acids, also known as sialic acids (1). These highly charged terminal groups modulate viral and bacterial adhesion. Conversely, bacteria and viruses have evolved a binding specificity for sugar sequence and conformation, facilitating colonization of the mucosal niche. For instance, human flu viruses bind α-2,3-linked sialic acids, whereas avian flu viruses bind α-2,6-linked sialic acids (2), and Pseudomonas aeruginosa, an important ocular pathogen, uses α-2,6 sialic acids (3). Recent work from our group and others suggests that α-2,3 and α-2,6 sialic acids are not equally distributed in purified ocular mucins (1) and tears (4). We used lectins to investigate this differential distribution and the spatial arrangement of α-2,3 and α-2,6 sialic acids on purified ocular mucins and in the preocular fluid.
Lectins are invaluable for the study of carbohydrates because of their high specificity for glycan motifs. They are used as clinical tumor markers to identify altered carbohydrate structures (5), and for the isolation and characterization of glycoproteins. Here, we used lectins as carbohydrate-selective biosensors (6) to distinguish between the linkage positions of sialic acids in oligosaccharide chains. Specifically, we used Maackia amurensis (MAA) and Sambucus nigra (SNA) to identify and map α-2,3- and α-2,6-linked sialic acids, respectively, on glycoconjugates, including mucins.
For biochemical analysis, mucin is usually broken down into individual components, whereas electron and scanning tunneling microscopy enable the observation of whole molecules and polymer architecture (7, 8, 9). However, these methods rely on sample fixation and coating with a conductive material. Atomic force microscopy (AFM) has the advantage of enabling high-resolution imaging of native biological molecules and systems under physiological conditions (10, 11), and has been used extensively to characterize ocular mucins (12, 13, 14, 15). The topography of biomolecules, organelles, and live cells, and the energy landscapes of receptor-ligand interactions have been studied by single-molecule AFM, providing biological information at the nanoscale (16, 17, 18, 19, 20, 21, 22). A characteristic of AFM that makes it especially relevant for studying biological molecules under variable force levels is that force is not applied instantaneously but increases over time, paralleling, for example, the movement of the upper lid over the eye, which can generate appreciable force over the ocular surface (23).
We investigated sialic acids in mucin networks and on purified mucin molecules, using AFM in force volume mode. We continuously recorded force curves while scanning the sample surface (24, 25), with the cantilever tips functionalized with MAA and SNA. This use of AFM to discriminate subtle changes in epitope type and distribution is relatively unexplored. The unbinding forces allowed us to define the kinetics of these interactions, identify the location and proximity of the α-2,3 and α-2,6 sialic acids on purified mucins, and analyze changes in their distribution in tangled networks of mucins, and hence assess mucin packaging in the gel. Ultimately, the availability for binding and surface exposure of sugar moieties may enhance our understanding of host defense and pathogenic invasion of mucosal surfaces.
Materials and Methods
Sample preparation
Purified mucins
Mucins were extracted and purified from normal human conjunctival (NHC) cells in 4 M of guanidine hydrochloride and purified as described previously (26). Briefly, we used cesium chloride buoyant density centrifugation and size fractionation on Sepharose CL2B (GE Healthcare Life Sciences, Chalfont St. Giles, UK) to separate mucins from other molecular species. The purest mucin fraction, with largest hydrodynamic volume and high glycosylation (1.4–1.45 g/mL) was selected, freeze-dried, and dialyzed against imaging buffer (1 mM HEPES, 5 mM NiCl2 at pH 7.4). A 5 μL drop was pipetted onto freshly cleaved mica, allowed to stand for 3 min, washed, and immediately immersed in imaging buffer.
Mucin networks
Impression cytology (27) is a well-established method for obtaining samples of tear fluid for clinical and laboratory investigations (4, 28, 29), including AFM (13). We obtained ocular impressions from two healthy subjects (S.B. and M.B.), after they provided informed consent, by gently pressing freshly cleaved mica against the conjunctiva of the lower eyelid. The mica was immediately immersed in imaging buffer to prevent desiccation. The impressions contained a mixture of both secreted and cell surface-associated ocular mucins, other glycoproteins and proteoglycans, and a variety of other tear components.
Tip functionalization
Covalent binding of diagnostic reagents to silicon nitride tips (MLCT; Veeco, Cambridge, UK) through flexible linkers was carried out according to the protocol of Ebner et al. (20). Aldehyde-polyethylene glycol (PEG)-NHS linkers were bound to the tip and subsequently incubated with 0.2 mg/mL of either MAA or SNA, which preferentially bind terminal sialic acids in α-2,3 and α-2,6 linkages, respectively. The functionalized tips were washed and stored in phosphate-buffered saline at 4°C for up to 2 weeks. Flexible linkers and surface modification allow conformational freedom for the biosensor to orient on the surface (19, 30, 31). The use of the PEG linker in this system also provides a means to distinguish between a specific molecular recognition event and a nonspecific interaction, because the former features a nonlinear stretch due to the flexibility of the linker molecule (32).
Data acquisition and analysis
We used a MultiMode atomic force microscope with a Nanoscope IIIa controller (Veeco, Santa Barbara, CA) in intermittent contact (Tapping) mode to perform high-resolution imaging of single molecules and networks under physiological conditions.
To analyze the presence and characteristics of sialic acids, we used a Dimension atomic force microscope with a Nanoscope IV controller (Veeco) in force volume mode. We acquired force maps using a grid of 32 × 32 measuring points, and a pixel resolution varying from 16 nm to 50 nm. Accompanying topographical images were obtained at 128 × 128 pixel resolution. The simultaneous topographic and force spectroscopy data were used to directly assess the localization, number, and rupture force magnitude of bonds between lectin and the sialic acids. Only force curves that exhibited the signature of PEG stretching were selected. In this analysis, we considered only curves that contained a single rupture. The rupture-distance distributions confirm that the modal separation for rupture is consistent with PEG stretching plus lectin (see Fig. S1 in the Supporting Material). We further evaluated the specificity of lectin-glycoepitope bonds by injecting blocking sugars into the imaging medium. Blocking sugars reversibly compete with the lectin for binding sites on glycoconjugates.
We analyzed each force versus z-piezo separation curve using Scanning Probe Imaging Processor (Image Metrology, Hørsholm, Denmark) to calculate the force magnitudes and distances between the tip and the sample at which unbinding events occurred. The spring constant of each cantilever was calibrated according to the thermal noise method. Standard deviations (SDs) < 10% are in line with those expected for commercial cantilevers (33, 34).
Models for bond rupture under force
Applied force alters the energy landscape of a receptor-ligand complex by lowering the activation energy barrier. Therefore, bond rupture occurs more rapidly under applied force than at zero force (spontaneous dissociation). The Bell model (35) is commonly used to evaluate ligand-receptor interactions and to relate the spontaneous dissociation constant, , to the observed dissociation constant under applied force, F:
| (1) |
where xβ is the bond width potential, which describes the energy difference between the bound and transition states projected along the direction of the force; kB is Boltzmann's constant; and T is the absolute temperature.
In force spectroscopy, however, the force applied to the bond is not instantaneous, but rather increases with time. The loading rate affects the magnitude of the experimentally measured dissociation constant (36, 37, 38). In this part of the study, we applied loading rates of 20–2000 nN/s using cantilevers with spring constants in the range of 0.012–0.175 N/m. Assuming a constant loading rate, r, Evans and Ritchie (38) showed that the rupture force, F, increases proportionally with the logarithm of the loading rate:
| (2) |
Over a wide range of loading rates, and for some receptor-ligand complexes, there is evidence for a series of linear regimes (38, 39), suggesting that a succession of energy barriers, each with its associated bond width potential and dissociation constants, must be overcome before dissociation occurs. In an extension of this concept, and modeling the probability distribution as a function of time, Tees et al. (37) modified Eq. 2 so that the mean of the distribution and the relation between the unbinding force and loading rate are given by
| (3) |
where E1 is the exponential integral. Here, we used a routine written in Mathematica 6 (Wolfram Research, Champaign, IL) to fit a theoretical curve to the experimental data and to derive the single and xβ of the reaction.
To derive the kinetic constants of lectin-sialic acid interactions, we analyzed only force curves that showed single rupture events (i.e., 80% of the total 3120 force curves that contained specific interactions). These would predominantly represent single receptor-ligand unbinding events (40). Following Rinko et al. (36), we used the single-barrier Bell and Tees models, and the Bell-Evans paradigm, which models multiple barriers as a series of linear regimes. We assessed the quality of fit by calculating the sum of least squares of the data from the fitted curves.
Cluster modeling and analysis
Cooperative lectin binding depends on the lectin structure and the presence of appropriately positioned sugar-receptor partners (41). Hence, by studying the distribution of specific unbinding events, we assessed whether sialic acids are randomly distributed or present in clusters on mucin molecules and gels. Interactions were considered to be part of a cluster if they were adjacent to another interaction (i.e., in any of the eight pixels surrounding the central pixel of a 3 × 3 matrix). To assess the likelihood of such clusters occurring by chance, we used a MATLAB routine (The MathWorks, Natick, MA) to calculate the number of clusters of different sizes in events randomly distributed over the same area. This routine was performed on 10,000 randomly generated data sets containing the same number of interactions as each set of experimental data, distributed over an area equal to that of the scan. The mean and SD of clustering in the randomly generated distribution were calculated and compared with the clustering of the experimentally derived data. The 10,000 randomly generated data sets were selected as an adequate representation of the cluster size distribution, after comparisons of 10,000 and 100,000 repeats showed no significant statistical difference (Fig. S2). A group of adjacent interactions in the experimental data set was considered a cluster if its occurrence exceeded the mean + 3 SD of the simulated data at that cluster size.
Results
Imaging
Single mucin molecules secreted by NHC cells form extended, chain-like structures that vary in length from a few nanometers to several microns and have a width of ∼1 nm (Fig. 1 a), as previously described for tissue-derived ocular mucins (12, 14, 42). Fig. 1 b is a tapping-mode image of an ocular impression imaged under identical conditions. The surface is flat, with an average roughness of 0.9 nm.
Figure 1.
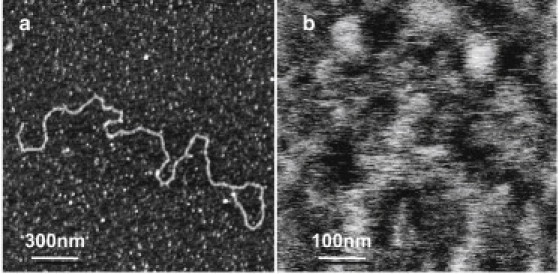
Images of mucins obtained by intermittent contact mode AFM. A purified, hydrated single mucin molecule (a) and an ocular impression (b), imaged in 1 mM HEPES and 5 mM NiCl2 at pH 7.4 on mica are shown. (a) In the single mucin polymer, one can observe topographically high and low regions that may correspond to high- and low-glycosylation domains, respectively (z scale = 3 nm). (b) The impression contains a tangled network of mucins and other glycoconjugates (z scale = 10 nm).
Force measurements and specificity
Preliminary control experiments demonstrate a very low percentage of nonspecific tip-sample interactions. Functionalized cantilevers scanning a 500 nm × 500 nm area of clean mica showed adhesion in only 1% of the force curves, whereas nonfunctionalized cantilevers scanning ocular impressions displayed adhesion events in 2% of the force curves.
Also in force volume mode, we scanned a 500 nm × 500 nm area of an ocular impression in imaging buffer using a tip functionalized with MAA lectin. All of the specific rupture events on a 32 × 32 scan area (n = 1024) were analyzed and plotted as a frequency histogram in Fig. 2 a. To assess the specificity of these interactions, we injected sugars directly into the liquid cell and analyzed the rupture forces on subsequent scans of the same area. First, a 40 μL aliquot of 0.5 mg/mL 6′-sialyllactose (low-affinity sugar) was injected, causing a 20% decrease in the frequency of the interactions (Fig. 2 b). Injection of 40 μL of the specific sugar 3′-sialyllactose caused a threefold larger decrease (61%) in the frequency of interactions (Fig. 2 c). A series of washes to remove the blocking sugar from the imaging chamber restored the frequency of interactions to 67% of the initial value (Fig. 2 d). The recovery of interactions after the inhibiting sugar was removed indicates that lectin recognition is specific. Elimination of all interactions is not expected in a biological system, where the large number of ligands would require an unachievable concentration of blocking sugars.
Figure 2.
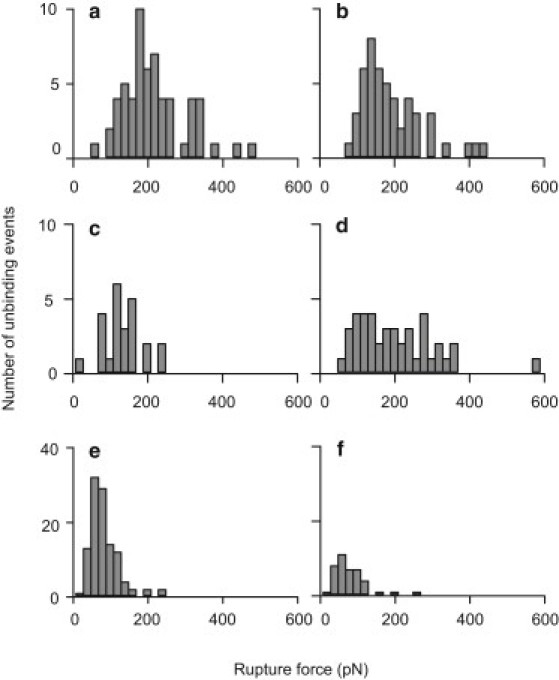
Specificity of lectin-ligand interactions. The frequency distributions of rupture forces between lectins and ocular impressions decreased in the presence of the specific blocking sugar. Interactions of MAA in imaging buffer (a), after injection of 0.02 mg 6′-sialyllactose (b) or 0.02 mg 3′-sialyllactose (preferred sugar) (c), and after extensive washing with imaging buffer (d); and SNA in imaging buffer (e) and after injection of 1.2 mg 6′-sialyllactose (f) are shown.
The specificity between SNA-functionalized tips and ocular impressions was assessed in a similar manner (Fig. 2 e). Because of the high frequency of the interactions, we chose 150 curves at random from three nonoverlapping regions of the scan to ensure that the force curves would be representative of the entire area (data not shown). Injection of 60 μL of 20 mg/mL 6′-sialyllactose results in a 65% decrease in the number of interactions between SNA and α-2,6 sialic acids in the ocular impression (Fig. 2 f).
Kinetics of the lectin-sugar bonds
We performed experiments on single purified mucin molecules and mucin networks under identical conditions and using cantilevers with very similar spring constants (0.031 ± 0.002 nN/nm; mean ± SD) for each tip-sample combination, allowing direct comparisons to be made. When probed with SNA, similar median rupture forces of 123 pN and 121 pN were calculated for single molecules and mucin networks, respectively (Fig. 3 a). With MAA-functionalized tips, the measured median rupture forces were 165 pN for ocular impressions and 172 pN for single molecules (Fig. 3 b). The overlay in Fig. 3 c emphasizes differences between the force distributions of the two lectins. As would be expected, the number of interactions with single molecules is much smaller than with preocular fluid impressions: glycoconjugates largely express similar terminal sugars.
Figure 3.
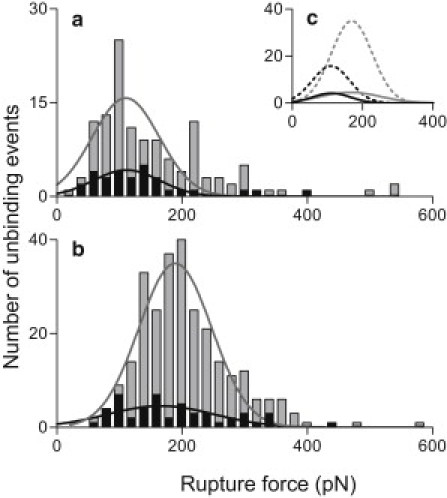
Rupture force distributions on purified mucins and impressions. Distribution and median unbinding forces between lectins and their receptors were similar on isolated mucin molecules and mucin networks. AFM tips functionalized with (a) SNA (n = 150) or (b) MAA (n = 1024); light gray bars represent impressions, dark gray bars represent single molecules. (c) Gaussian curves fitted to each distribution are combined in the inset. Dotted lines: impressions; solid line: single molecules; black symbols: SNA; gray symbols: MAA. All experiments were performed at room temperature in 1 mM HEPES with 5 mM NiCl2 at pH 7.4.
Consistent with Evans and Ritchie (38) and Merkel et al. (39), we observed a dependence of the receptor-ligand unbinding force on the loading rate for MAA- and SNA-sugar interactions. The Bell-Evans model was used to fit two linear regimes, as shown in Fig. 4, a and b, and Table 1. Using the two-regime model, we achieved the best fit (i.e., the lowest sum of least squares) by placing the boundary at 250 nN s−1; of interest, this was the same for both lectins. A single linear regime did not fit as well to the experimental data for either lectin by the same criterion (Fig. S3). When the Tees model was used to fit a single curve to the data, the dissociation constants were similar to those calculated at the high-loading-rate regime: 376 s−1 for MAA and for SNA 877 s−1 (Fig. 4, c and d). All of the xβ-values lie between 0.018 ± 0.003 nm and 0.098 ± 0.022 nm, and are consistent with published data (43, 44).
Figure 4.
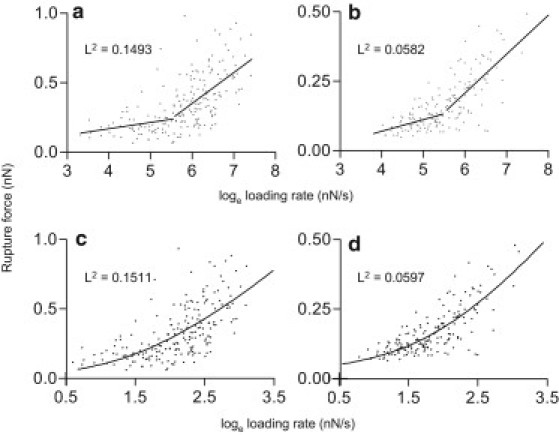
Dependence of the rupture force on the loading rate. The dependence of unbinding forces on loading rates for MAA (a and c) and SNA (b and d) was used to calculate dissociation constants. Data were fitted to the two-energy barrier model (a and b) and the Tees curve (c and d). The least-squares values (L2) suggest the presence of two regimes during unbinding.
Table 1.
Dissociation parameters for lectin-sialic acid bonds
| r (nN s−1) |
Maackia amurensis |
Sambucus nigra |
|||
|---|---|---|---|---|---|
| koff (s−1) | xβ (nm) | koff (s−1) | xβ (nm) | ||
| Single linear fit | 0–3500 | 194 ± 18 | 0.030 ± 0.003 | 466 ± 30 | 0.042 ± 0.003 |
| Double linear fit | 0–250 | 28 ± 16 | 0.093 ± 0.053 | 246 ± 54 | 0.098 ± 0.022 |
| 250–3500 | 371 ± 53 | 0.018 ± 0.003 | 653 ± 85 | 0.030 ± 0.004 | |
| Tees curve | 0–3500 | 376 | 0.015 | 877 | 0.019 |
All errors were calculated by propagation of errors through equations.
Frequency and spatial distribution of specific interactions
Percentage coverage of interactions
Fig. 5, a, c, e, and g, show examples of force maps consisting of overlays of height profiles and a 32 × 32 grid with darkened pixels at the locations where specific interactions were recorded. We used the total surface area of these pixels to calculate the percentage coverage of interactions, assuming that an interaction would occur at any location within the pixel area (Fig. 6 a). This analysis was performed on five independently generated force maps for SNA on single molecules, and eight repeats of each remaining tip-sample combinations. For purified mucin molecules, the percentage coverage of MAA interactions was larger than for SNA, and this ratio was reversed for impressions (Fig. 6 a). MAA coverage was similar on single molecules and impressions (∼10%, analysis of variance with Tukey post hoc tests not statistically different), and, in contrast, the percentage coverage of SNA interactions was 4% on single molecules, but almost 10-fold larger (36%) on impressions (Tukey post hoc test, p < 0.0001). These differences suggest that the ocular surface gel has evolved to package mucin molecules in such a way that only certain ligands are available at the ocular surface.
Figure 5.
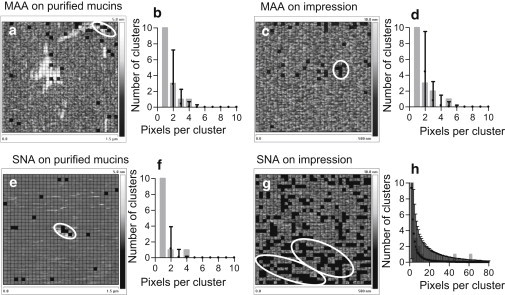
Surface topography and sialic acid affinity mapping. Force maps present height data overlaid with grids showing the location of specific interactions (solid squares) indicating the location of sialic acids: (a) MAA on single molecules, n = 32; (c) MAA on impressions, n = 42; (e) SNA on single molecules, n = 18; and (g) SNA on impressions, n = 289. The corresponding graphs (b, d, f, and h) show the expected number of neighboring interactions (mean ± 3 SD) in a simulated random distribution of equal size. The observed numbers of neighboring interactions are presented as gray bars. These are considered clustered if their number exceeds the mean + 3 SD of the simulated data and are circled in white on the force maps.
Figure 6.
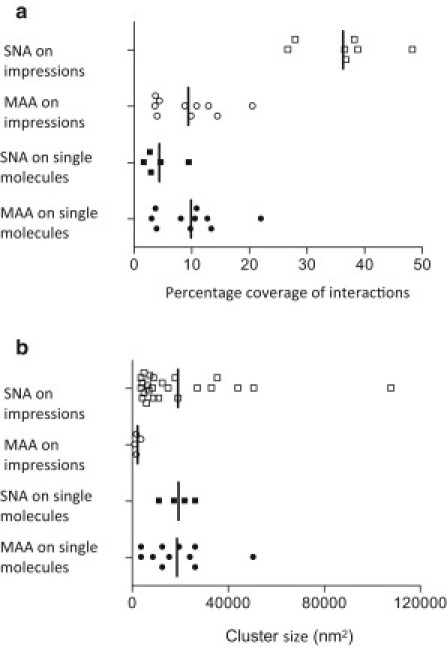
Availability and distribution of sialic acids on single molecules and impressions. Sialic acid availability is represented by the percentage coverage of the surface (a), and the cluster size emphasizes their fragmented distribution (b) for each lectin-sample combination. Circles: MAA; squares: SNA; solid symbols: single mucins; open symbols: preocular gel. Vertical lines represent the means of the distribution.
Clustering of interactions
We compared the experimental data with randomly generated data to determine whether the distribution of sialic acids was a random aggregation of events or included statistically significant clusters. The graphs corresponding to each force volume overlay in Fig. 5, b, d, f, and h, show the randomly generated and experimental results for a number of clusters of a particular size. On single molecules, it is evident that the clusters coincide with higher topographical features, and we attribute this to probing of a highly glycosylated region of the mucin molecule. The low resolution of force volume topographical maps can make it difficult to unambiguously correlate point interactions with nanometer-wide single molecules. The α-2,3 and α-2,6 clusters on purified mucin molecules are very similar in size (Fig. 6 b), and the larger number of MAA clusters most likely reflects the higher availability of α-2,3-linked sialic acids on mucins.
Of interest, the percentage coverage of interactions as shown in Fig. 6 a is not correlated to the size of observed clusters (Fig. 6 b). It is striking that on the impressions, the α-2,6 sialic acid clusters are not only larger but also much more numerous than the sialic acids in the α-2,3 linkage to the preceding sugar in the sequence. The cluster sizes of α-2,3-linked sialic acids on the impressions are significantly smaller than those obtained with any other tip-sample combination, although the percentage coverage is similar. Additionally, despite the significantly larger percentage coverage for α-2,6 linkages on impressions, the clusters are very similar in size to those observed on single molecules. This asymmetry suggests that these epitopes have become fragmented in the preocular fluid; thus, mucins are interspersed with other glycoconjugates at the surface of the mucus gel that either protect or prevent access to mucin glycosylation. This analysis indicates that the impression predominantly presents patches of α-2,6-linked sialic acids with small, dispersed islands of sialic acids in the α-2,3-linkage.
Discussion
Sialic acids are very common terminal sugars in glycosylated molecules, and can serve as receptors for bacteria and viruses. These organisms can be used to distinguish between the different three-dimensional structures resulting from sialic acid linkage to the previous sugar in the oligosaccharide chain. Here, we made use of the exquisite specificity of lectins (6, 45, 46) to detect sialic acids in the two linkages present at the ocular surface, with the goal of mapping their geographic distribution and availability to outside binding partners.
The density and number of glycan epitopes determine binding and cross-linking of lectins as well as their functions in signaling pathways (47, 48, 49, 50). Moreover, the availability of highly glycosylated regions of mucins enhances the binding affinity of lectins either because lectins are able to bind and jump between glycans in close proximity, or because of multivalent interactions (51). The highly glycosylated regions of mucins and the clusters of binding epitopes at the ocular surface may therefore influence host-pathogen interactions. Hence, the arrangement of pro- and antiadhesive epitopes at the ocular surface may be another embodiment of innate defense.
Lectin-sialic acid dissociation
By injecting blocking sugars while monitoring the frequency of specific sugar-lectin bonds, we were able to confirm that the specificity of the tethered lectins was conserved in an environment agitated by the movement of the AFM tip. Rupture force magnitudes were not influenced by mucin purification, the concentration on the mica, or the presence of other sugar-bearing molecules in the immediate vicinity, as shown in Fig. 3. As expected, there were more interactions with sialic acids on ocular impressions than on single mucin molecules, because at the ocular surface, sialic acids are richly present on mucins as well as on other glycosylated molecules. Most lectin-sugar interactions occurred at a tip-sample separation of ∼25 nm, which is consistent with the length of the fully extended linker and lectin (52).
The unbinding kinetics suggests that two energy barriers must be overcome for lectin-sialic acid bond rupture to occur. A similar fit was obtained with the two-barrier model and its generalization, the Tees model, for both MAA and SNA. Our results place this transition at the same loading rate for both lectins, suggesting shared structural features as its cause. Two energy barriers have been observed for biotin-avidin and P- and L-selectins (36, 39, 53). The existence of two dissociation pathways may reflect a conformational change that occurs before unbinding, altering the energy landscape and thus creating the two regimes linked by a discrete transition state. This hypothesis is also supported by the existence of bent and extended conformations of P-selectin domains (54).
Dissociation constant and loading rate
The high loading rates used here (20–2000 nN/s) are relevant for bacteria or viruses colonizing epithelial surfaces that experience large forces, such as during a blink at the ocular surface, where the velocity of the upper lid increases to 205 mm/s (55). The values of the dissociation constants calculated here are larger than those reported for MAA (1.03 × 10⁻³ s−1) (2), reflecting the high loading regimes. This is further corroborated by our single-site force spectroscopy on the same system, performed over lower loading regimes, which yielded a lower dissociation constant (0.17 ± 0.06 s−1; Fig. S4). The variation of dissociation constants of biological bonds with the rate at which force changes is well described in the literature (56, 57, 58, 59). The dissociation constants were higher for SNA-α-2,6 sialic acid bonds than for MAA, irrespective of the theoretical model used. There are no published values for SNA. The dissociation constants obtained in other lectin-glycan systems are similar to the values calculated here: 30 s−1 and 400 s−1 for methyl α- and β-D-glucopyranose-Concanavalin A, respectively (60). Similar force distributions are observed in the overlapping loading regime between the lectin soybean agglutinin and GalNAcα1-O-Ser/Thr residues on pig submaxillary mucin (61). At similarly high loading rates, dissociation constants for antibody-antigen interactions, such as that of the human α5β1 integrins/GRGDSP, ( of 787 s−1) (44) and fibrinogen (αIIbβ3)/HHLGGAKQAGDV ( of 47.58 s−1) (62), are similar to those calculated here, underlining the pronounced effect of the loading rate on the dissociation constant.
Sialic acid distribution
α-2,3 and α-2,6 sialic acids are not equally distributed at the ocular surface (1, 4). In this study, AFM yielded a direct spatial distribution of epitopes that is not obtainable with other methods. We confirmed the predominance of α-2,3 over α-2,6 sialic acids in purified ocular mucins, which was previously found to be close to 4:1 by chemical methods (1). Consistent with results from a glycochip analysis of O-glycans from tears (4), these ratios were reversed in ocular impressions. AFM force volume is therefore a powerful technique to investigate the composition of biological samples, with the added advantage of enabling simultaneous analysis of epitope numbers and patterns.
We show that sialic acids are clustered on single molecules, as expected for the highly glycosylated region of mucins. Clustering is also detected on conjunctival impressions, where the α-2,3 sialic acid clusters are significantly reduced in size compared with α-2,6 sialic acid clusters. In the preocular mucus gel, the α-2,3 sialic acid distribution is fragmented, reflecting the fact that in this gel, mucins are interspersed with other glycoconjugates. Because a reduced cluster size is unfavorable for pathogen adhesion (5), small clusters may be part of a mucosal defensive strategy. The availability of large numbers of α-2,6-linked sialic acid clusters at the ocular surface would imply that pathogens using these clusters as receptors would effectively colonize the ocular surface. However, pathogens adhering to this epitope become entrapped in the mucin network and are removed via the lacrimal drainage system (3, 63), illustrating another mechanism of mucosal antibacterial defense. In the respiratory system, mucins enveloping trapped organisms are eliminated by the mucociliary escalator, whereas contractility fulfils this removal role in the gut.
Conclusions
Single-molecule AFM force measurements reveal the heterogeneity of the mucus gel and the part-exposure of mucin molecules, clarifying the balance of α-2,3 and α-2,6 sialic acids at the ocular surface (moieties that are anti- and proadhesive, respectively) for some pathogenic bacteria and viruses. This surface heterogeneity contributes to the protective function of the preocular fluid by making available for viruses and bacteria a small number of proadhesive epitopes, in small clusters, that discourage adhesion and colonization, and at the same time entrap other organisms by a multiplicity of bonds.
Acknowledgments
The authors thank Professor Michael V. Berry for the Mathematica routine used to fit the Tees model.
This study was supported by the Leverhulme Trust and the Austrian Science Foundation (FWF project SFB-F35).
Editor: Peter Hinterdorfer.
Footnotes
Four figures are available at http://www.biophysj.org/biophysj/supplemental/S0006-3495(11)01120-9.
Supporting Material
References
- 1.Royle L., Matthews E., et al. Carrington S.D. Glycan structure of ocular surface mucins in man, rabbit and dog display species differences. Glycoconj. J. 2008;25:763–773. doi: 10.1007/s10719-008-9136-6. [DOI] [PubMed] [Google Scholar]
- 2.Gondran C., Dubois M.P., et al. Szunerits S. Detection of carbohydrate-binding proteins by oligosaccharide-modified polypyrrole interfaces using electrochemical surface plasmon resonance. Analyst (Lond.) 2008;133:206–212. doi: 10.1039/b714717a. [DOI] [PubMed] [Google Scholar]
- 3.Fleiszig S.M.J., Zaidi T.S., et al. Pier G.B. Modulation of Pseudomonas aeruginosa adherence to the corneal surface by mucus. Infect. Immun. 1994;62:1799–1804. doi: 10.1128/iai.62.5.1799-1804.1994. [DOI] [PMC free article] [PubMed] [Google Scholar]
- 4.Guzman-Aranguez A., Mantelli F., Argüeso P. Mucin-type O-glycans in tears of normal subjects and patients with non-Sjögren's dry eye. Invest. Ophthalmol. Vis. Sci. 2009;50:4581–4587. doi: 10.1167/iovs.09-3563. [DOI] [PMC free article] [PubMed] [Google Scholar]
- 5.Ohyama C., Hosono M., et al. Fukuda M. Carbohydrate structure and differential binding of prostate specific antigen to Maackia amurensis lectin between prostate cancer and benign prostate hypertrophy. Glycobiology. 2004;14:671–679. doi: 10.1093/glycob/cwh071. [DOI] [PubMed] [Google Scholar]
- 6.Varki A. Sialic acids as ligands in recognition phenomena. FASEB J. 1997;11:248–255. doi: 10.1096/fasebj.11.4.9068613. [DOI] [PubMed] [Google Scholar]
- 7.Sheehan J.K., Carlstedt I. Electron microscopy of cervical-mucus glycoproteins and fragments therefrom. The use of colloidal gold to make visible ‘naked’ protein regions. Biochem. J. 1990;265:169–177. doi: 10.1042/bj2650169. [DOI] [PMC free article] [PubMed] [Google Scholar]
- 8.Roberts C.J., Shivji A., et al. Williams P.M. A study of highly purified pig gastric mucin by scanning tunnelling microscopy. Protein Pept. Lett. 1995;2:409–414. [Google Scholar]
- 9.Sheehan J.K., Kesimer M., Pickles R. Innate immunity and mucus structure and function. Novartis Found. Symp. 2006;279:155–166. discussion 167–169, 216–219. [PubMed] [Google Scholar]
- 10.Weisenhorn A.L., Hansma P.K., et al. Quate C.F. Forces in atomic force microscopy in air and water. Appl. Phys. Lett. 1989;54:2651–2653. [Google Scholar]
- 11.Putman C.A.J., Vanderwerf K.O., et al. Greve J. Tapping mode atomic-force microscopy in liquid. Appl. Phys. Lett. 1994;64:2454–2456. [Google Scholar]
- 12.McMaster T.J., Berry M., et al. Miles M.J. Atomic force microscopy of the submolecular architecture of hydrated ocular mucins. Biophys. J. 1999;77:533–541. doi: 10.1016/S0006-3495(99)76910-9. [DOI] [PMC free article] [PubMed] [Google Scholar]
- 13.Berry M., Brayshaw D., McMaster T.J. Dynamic molecular resolution imaging of preocular fluid impressions. Br. J. Ophthalmol. 2004;88:1460–1466. doi: 10.1136/bjo.2003.040121. [DOI] [PMC free article] [PubMed] [Google Scholar]
- 14.Brayshaw D., Berry M., McMaster T. Reducing a polymer to its subunits as an aid to molecular mapping. Nanotechnology. 2004;15:1391–1396. [Google Scholar]
- 15.Round A.N., Berry M., et al. Miles M.J. Glycopolymer charge density determines conformation in human ocular mucin gene products: an atomic force microscope study. J. Struct. Biol. 2004;145:246–253. doi: 10.1016/j.jsb.2003.10.029. [DOI] [PubMed] [Google Scholar]
- 16.Kienberger F., Ebner A., et al. Hinterdorfer P. Molecular recognition imaging and force spectroscopy of single biomolecules. Acc. Chem. Res. 2006;39:29–36. doi: 10.1021/ar050084m. [DOI] [PubMed] [Google Scholar]
- 17.Hinterdorfer P., Baumgartner W., et al. Schindler H. Detection and localization of individual antibody-antigen recognition events by atomic force microscopy. Proc. Natl. Acad. Sci. USA. 1996;93:3477–3481. doi: 10.1073/pnas.93.8.3477. [DOI] [PMC free article] [PubMed] [Google Scholar]
- 18.Hinterdorfer P., Dufrêne Y.F. Detection and localization of single molecular recognition events using atomic force microscopy. Nat. Methods. 2006;3:347–355. doi: 10.1038/nmeth871. [DOI] [PubMed] [Google Scholar]
- 19.Ebner A., Madl J., et al. Hinterdorfer P. Single molecule force microscopy on cells and biological membranes. Curr. Nanosci. 2007;3:49–56. [Google Scholar]
- 20.Ebner A., Wildling L., et al. Gruber H.J. A new, simple method for linking of antibodies to atomic force microscopy tips. Bioconjug. Chem. 2007;18:1176–1184. doi: 10.1021/bc070030s. [DOI] [PubMed] [Google Scholar]
- 21.Sotres J., Lostao A., et al. Baró A.M. Unbinding molecular recognition force maps of localized single receptor molecules by atomic force microscopy. ChemPhysChem. 2008;9:590–599. doi: 10.1002/cphc.200700597. [DOI] [PubMed] [Google Scholar]
- 22.Duman M., Pfleger M., et al. Hinterdorfer P. Improved localization of cellular membrane receptors using combined fluorescence microscopy and simultaneous topography and recognition imaging. Nanotechnology. 2010;21:115504. doi: 10.1088/0957-4484/21/11/115504. [DOI] [PubMed] [Google Scholar]
- 23.Creech J.L., Chauhan A., Radke C.J. Dispersive mixing in the posterior tear film under a soft contact lens. Ind. Eng. Chem. Res. 2001;40:3015–3026. [Google Scholar]
- 24.Darling E.M., Wilusz R.E., et al. Guilak F. Spatial mapping of the biomechanical properties of the pericellular matrix of articular cartilage measured in situ via atomic force microscopy. Biophys. J. 2010;98:2848–2856. doi: 10.1016/j.bpj.2010.03.037. [DOI] [PMC free article] [PubMed] [Google Scholar]
- 25.Gaboriaud F., Parcha B.S., et al. Strugnell R.A. Spatially resolved force spectroscopy of bacterial surfaces using force-volume imaging. Colloids Surf. B Biointerfaces. 2008;62:206–213. doi: 10.1016/j.colsurfb.2007.10.004. [DOI] [PubMed] [Google Scholar]
- 26.Berry M., Ellingham R.B., Corfield A.P. Polydispersity of normal human conjunctival mucins. Invest. Ophthalmol. Vis. Sci. 1996;37:2559–2571. [PubMed] [Google Scholar]
- 27.Egbert P.R., Lauber S., Maurice D.M. A simple conjunctival biopsy. Am. J. Ophthalmol. 1977;84:798–801. doi: 10.1016/0002-9394(77)90499-8. [DOI] [PubMed] [Google Scholar]
- 28.Calonge M., Diebold Y., et al. Herreras J.M. Impression cytology of the ocular surface: a review. Exp. Eye Res. 2004;78:457–472. doi: 10.1016/j.exer.2003.09.009. [DOI] [PubMed] [Google Scholar]
- 29.Dogru M., Okada N., et al. Fujishima H. Atopic ocular surface disease: implications on tear function and ocular surface mucins. Cornea. 2005;24(8, Suppl):S18–S23. doi: 10.1097/01.ico.0000178741.14212.53. [DOI] [PubMed] [Google Scholar]
- 30.Suo Z., Arce F.T., et al. Spangler B. Dendritic structures of poly(ethylene glycol) on silicon nitride and gold surfaces. Langmuir. 2006;22:3844–3850. doi: 10.1021/la053389i. [DOI] [PubMed] [Google Scholar]
- 31.Kim I.H., Lee H.Y., et al. Park J.W. Interactions between signal-transducing proteins measured by atomic force microscopy. Anal. Chem. 2009;81:3276–3284. doi: 10.1021/ac8024366. [DOI] [PubMed] [Google Scholar]
- 32.Hinterdorfer P., Kienberger F., et al. Schindler H. Poly(ethylene glycol): an ideal spacer for molecular recognition force microscopy/spectroscopy. Single Mol. 2000;1:99–103. [Google Scholar]
- 33.Sader J.E., Larson I., et al. White L.R. Method for the calibration of atomic-force microscope cantilevers. Rev. Sci. Instrum. 1995;66:3789–3798. [Google Scholar]
- 34.Butt H.J., Jaschke M. Calculation of thermal noise in atomic-force microscopy. Nanotechnology. 1995;6:1–7. [Google Scholar]
- 35.Bell G.I. Models for the specific adhesion of cells to cells. Science. 1978;200:618–627. doi: 10.1126/science.347575. [DOI] [PubMed] [Google Scholar]
- 36.Rinko L.J., Lawrence M.B., Guilford W.H. The molecular mechanics of P- and L-selectin lectin domains binding to PSGL-1. Biophys. J. 2004;86:544–554. doi: 10.1016/S0006-3495(04)74133-8. [DOI] [PMC free article] [PubMed] [Google Scholar]
- 37.Tees D.F.J., Waugh R.E., Hammer D.A. A microcantilever device to assess the effect of force on the lifetime of selectin-carbohydrate bonds. Biophys. J. 2001;80:668–682. doi: 10.1016/S0006-3495(01)76047-X. [DOI] [PMC free article] [PubMed] [Google Scholar]
- 38.Evans E., Ritchie K. Dynamic strength of molecular adhesion bonds. Biophys. J. 1997;72:1541–1555. doi: 10.1016/S0006-3495(97)78802-7. [DOI] [PMC free article] [PubMed] [Google Scholar]
- 39.Merkel R., Nassoy P., et al. Evans E. Energy landscapes of receptor-ligand bonds explored with dynamic force spectroscopy. Nature. 1999;397:50–53. doi: 10.1038/16219. [DOI] [PubMed] [Google Scholar]
- 40.Tsapikouni T.S., Allen S., Missirlis Y.F. Measurement of interaction forces between fibrinogen coated probes and mica surface with the atomic force microscope: The pH and ionic strength effect. Biointerphases. 2008;3:1–8. doi: 10.1116/1.2840052. [DOI] [PubMed] [Google Scholar]
- 41.Kadono T., Venturi G.M., et al. Tedder T.F. Leukocyte rolling velocities and migration are optimized by cooperative L-selectin and intercellular adhesion molecule-1 functions. J. Immunol. 2002;169:4542–4550. doi: 10.4049/jimmunol.169.8.4542. [DOI] [PubMed] [Google Scholar]
- 42.Round A.N., McMaster T.J., et al. Berry M. The isolated MUC5AC gene product from human ocular mucin displays intramolecular conformational heterogeneity. Glycobiology. 2007;17:578–585. doi: 10.1093/glycob/cwm027. [DOI] [PubMed] [Google Scholar]
- 43.Zhang X.H., Wojcikiewicz E., Moy V.T. Force spectroscopy of the leukocyte function-associated antigen-1/intercellular adhesion molecule-1 interaction. Biophys. J. 2002;83:2270–2279. doi: 10.1016/S0006-3495(02)73987-8. [DOI] [PMC free article] [PubMed] [Google Scholar]
- 44.Kokkoli E., Ochsenhirt S.E., Tirrell M. Collective and single-molecule interactions of α5β1 integrins. Langmuir. 2004;20:2397–2404. doi: 10.1021/la035597l. [DOI] [PubMed] [Google Scholar]
- 45.Van Damme E.J., Barre A., et al. Peumans W.J. The NeuAc(α-2,6)-Gal/GalNAc-binding lectin from elderberry (Sambucus nigra) bark, a type-2 ribosome-inactivating protein with an unusual specificity and structure. Eur. J. Biochem. 1996;235:128–137. doi: 10.1111/j.1432-1033.1996.00128.x. [DOI] [PubMed] [Google Scholar]
- 46.Sharon N., Lis H. History of lectins: from hemagglutinins to biological recognition molecules. Glycobiology. 2004;14:53R–62R. doi: 10.1093/glycob/cwh122. [DOI] [PubMed] [Google Scholar]
- 47.Orr G.A., Rando R.R., Bangerter F.W. Synthetic glycolipids and the lectin-mediated aggregation of liposomes. J. Biol. Chem. 1979;254:4721–4725. [PubMed] [Google Scholar]
- 48.Oyelaran O., Li Q., et al. Gildersleeve J.C. Microarrays with varying carbohydrate density reveal distinct subpopulations of serum antibodies. J. Proteome Res. 2009;8:3529–3538. doi: 10.1021/pr9002245. [DOI] [PMC free article] [PubMed] [Google Scholar]
- 49.Dam T.K., Brewer C.F. Lectins as pattern recognition molecules: the effects of epitope density in innate immunity. Glycobiology. 2010;20:270–279. doi: 10.1093/glycob/cwp186. [DOI] [PubMed] [Google Scholar]
- 50.Dam T.K., Brewer C.F. Multivalent lectin-carbohydrate interactions energetics and mechanisms of binding. Adv. Carbohydr. Chem. Biochem. 2010;63:139–164. doi: 10.1016/S0065-2318(10)63005-3. [DOI] [PubMed] [Google Scholar]
- 51.Dam T.K., Gerken T.A., et al. Brewer C.F. Binding studies of α-GalNAc-specific lectins to the α-GalNAc (Tn-antigen) form of porcine submaxillary mucin and its smaller fragments. J. Biol. Chem. 2007;282:28256–28263. doi: 10.1074/jbc.M704677200. [DOI] [PubMed] [Google Scholar]
- 52.Lis H., Sharon N. Lectins: Carbohydrate-specific proteins that mediate cellular recognition. Chem. Rev. 1998;98:637–674. doi: 10.1021/cr940413g. [DOI] [PubMed] [Google Scholar]
- 53.Evans E., Leung A., et al. Zhu C. Mechanical switching and coupling between two dissociation pathways in a P-selectin adhesion bond. Proc. Natl. Acad. Sci. USA. 2004;101:11281–11286. doi: 10.1073/pnas.0401870101. [DOI] [PMC free article] [PubMed] [Google Scholar]
- 54.Phan U.T., Waldron T.T., Springer T.A. Remodeling of the lectin-EGF-like domain interface in P- and L-selectin increases adhesiveness and shear resistance under hydrodynamic force. Nat. Immunol. 2006;7:883–889. doi: 10.1038/ni1366. [DOI] [PMC free article] [PubMed] [Google Scholar]
- 55.Somia N.N., Rash G.S., et al. Gossman D. A computer analysis of reflex eyelid motion in normal subjects and in facial neuropathy. Clin. Biomech. (Bristol, Avon) 2000;15:766–771. doi: 10.1016/s0268-0033(00)00062-0. [DOI] [PubMed] [Google Scholar]
- 56.Maki T., Kidoaki S., et al. Matsuda T. Dynamic force spectroscopy of the specific interaction between the PDZ domain and its recognition peptides. Langmuir. 2007;23:2668–2673. doi: 10.1021/la0627011. [DOI] [PubMed] [Google Scholar]
- 57.Odorico M., Teulon J.M., et al. Pellequer J.L. Energy landscape of chelated uranyl: antibody interactions by dynamic force spectroscopy. Biophys. J. 2007;93:645–654. doi: 10.1529/biophysj.106.098129. [DOI] [PMC free article] [PubMed] [Google Scholar]
- 58.Pyrpassopoulos S., Shuman H., Ostap E.M. Single-molecule adhesion forces and attachment lifetimes of myosin-I phosphoinositide interactions. Biophys. J. 2010;99:3916–3922. doi: 10.1016/j.bpj.2010.10.043. [DOI] [PMC free article] [PubMed] [Google Scholar]
- 59.Diezemann G., Janshoff A. Dynamic force spectroscopy: analysis of reversible bond-breaking dynamics. J. Chem. Phys. 2008;129:084904. doi: 10.1063/1.2968543. [DOI] [PubMed] [Google Scholar]
- 60.Brewer, C., D. Marcus, …, H. Sternlicht. E. F. 1974. Kinetics and mechanisms of binding of α methyl-d glucopyranose and β methyl-d glucopyranose to concanavalin A as studied by carbon-13 carbon magnetic resonance: a comparison with lysozyme. In Lysozyme. E. F. Osserman, R. E. Canfield, and S. Beychok, editors. Academic Press, New York. 239–250.
- 61.Sletmoen M., Dam T.K., et al. Brewer C.F. Single-molecule pair studies of the interactions of the α-GalNAc (Tn-antigen) form of porcine submaxillary mucin with soybean agglutinin. Biopolymers. 2009;91:719–728. doi: 10.1002/bip.21213. [DOI] [PMC free article] [PubMed] [Google Scholar]
- 62.Lee I., Marchant R.E. Molecular interaction studies of hemostasis: fibrinogen ligand-human platelet receptor interactions. Ultramicroscopy. 2003;97:341–352. doi: 10.1016/S0304-3991(03)00059-7. [DOI] [PubMed] [Google Scholar]
- 63.McNamara N.A., Andika R., et al. Fleiszig S.M. Interaction of Pseudomonas aeruginosa with human tear fluid components. Curr. Eye Res. 2005;30:517–525. doi: 10.1080/02713680590969456. [DOI] [PubMed] [Google Scholar]
Associated Data
This section collects any data citations, data availability statements, or supplementary materials included in this article.