

Abstract
The force model of protein-mediated membrane fusion hypothesizes that fusion is driven by mechanical forces exerted on the membranes, but many details are unknown. Here, we investigated by x-ray diffraction the consequence of applying compressive force on a stack of membranes against the hydration barrier. We found that as the osmotic pressure increased, the lamellar phase transformed first to a new phase of tetragonal lattice (T-phase) over a narrow range of relative humidity, and then to a phase of rhombohedral lattice. The unit cell structure changed from parallel bilayers to a bent configuration with a point contact between adjacent bilayers and then to the stalk hemifusion configuration. The T-phase is discussed as a possible transition state in the membrane merging pathway of fusion. We estimate the work required to form the T-phase and the subsequent hemifusion-stalk-resembling R-phase. The work for the formation of a stalk is compatible with the energy estimated to be released by several SNARE complexes.
Introduction
In at least one type of membrane fusion mediated by soluble N-ethylmaleimide-sensitive factor attachment protein receptors (SNAREs), the formation of protein complexes is thought to transduce force to cause the merger of lipid bilayers (1, 2, 3, 4, 5, 6, 7). However, there are still open questions about how fusion proteins direct the contact and merger between the two participating membranes (3, 4, 8, 9, 10, 11, 12). Here, we test the hypothesis that the bilayers merge as a result of applying compressive force to the juxtaposed bilayers (1, 2, 6, 7, 13, 14). We studied this problem by applying osmotic pressure to a stack of lipid bilayers in water, which is equivalent to applying mechanical pressure to the lipid bilayers to squeeze out the water from the interface (15, 16). We found that the ensuing phase transition revealed a new state in which two bilayers were in point contact. The point contact then evolved to a stalk state, as discovered previously (17), in which contacting monolayers merged in hemifusion. The work required to create a stalk is in the range of 50–100 kcal/mol, depending on the lipid composition. The area of lipid bilayer required for creating a stalk (the fusion zone) is ∼64 nm2. These results suggest that membranes would merge in a predictable manner to the stalk hemifusion state by a compressive force applied to a fusion zone, and such a force can potentially be delivered by the formation of SNARE complexes randomly distributed at an appropriate concentration (6).
A major problem of membrane fusion research has been the difficulty of trapping and determining the structures at the various stages of fusion. Freeze-fracture electron microscopy has not been able to reveal the transforming structures of membranes (18) (see also Siegel and Epand (19)). Thus, despite the knowledge of crystalline structures for various fusion proteins (6, 20), it is difficult to perceive the actions performed by these proteins after the initial step of forming complexes that brings two membranes into close proximity (2, 4, 8, 21, 22). So far, the structure of one intermediate lipidic state of membrane fusion has been identified. Based on accumulated evidence from fluorescence and other experiments, it has been widely believed that most, if not all, biological membrane fusion proceeds through a hemifusion intermediate in which the two contacting leaflets of apposed bilayers merge but the distal leaflets and aqueous compartments remain separated (1, 10, 23, 24, 25, 26). The membrane structure of this hemifusion intermediate called a stalk has been captured in a phase of phospholipids under osmotic pressure and revealed by x-ray diffraction (17). The experimental confirmation of this intermediate structure has helped to make the stalk hemifusion pathway a key concept for interpreting the data of membrane fusion in recent years, e.g., (8, 12, 22, 26, 27).
However, the molecular process from the separate bilayers to the state of hemifusion is still unknown (3, 4, 8, 9, 10, 12, 26, 28, 29). Thus, there are various proposals explaining how the separation may be closed by protein-induced membrane curvature, including possibly nipples or microprotrusions (3, 4, 8, 9, 10, 11, 12, 30). Upon closing the separation, the merging still requires a transition through the potential barrier that normally maintains the structural integrity of lipid bilayers (28, 29, 30). It is experimentally well established that there is a phenomenological repulsive force between two approaching (parallel) lipid bilayers, whose strength exponentially increases as the approaching distance decreases to within a few nanometers (called the hydration force) (16, 31). How fusion proteins transition through this potential barrier is unclear. Is it an intrinsic property of fusion proteins that they deform lipids, the physicochemical properties of the lipids themselves, or some combination of both? Recent theoretical work has suggested the existence of a prestalk transition state as a relevant lipid configuration pathway toward the formation of a stalk (28, 29). Thus, we seek experimental verification of a prestalk transition state.
One possible mechanism for merging is that during the formation of fusion protein complexes the process exerts a mechanical force on membranes (1, 2, 6, 7). Accordingly, we examined the physical configurations of compressed lipid bilayers by x-ray diffraction on an equivalent system of bilayers under osmotic pressure. Here, we report the discovery of an intermediate phase between the lamellar and the stalk phases. The unit cell of the new phase shows lipid bilayers in a docking state wherein the two bilayers contact at a point. The structure suggests a precursor state that initiates membrane merging, thus showing the lipid-structure pathway from separate bilayers to a stalk. The results allow us to estimate the energy required for hemifusion, as well as the size of a fusion zone.
Experiment
Grazing-angle multiwavelength anomalous diffraction
1,2-distearoyl(9-10dibromo)-sn-glycero-3-phosphocholine (di18:0(9,10Br)PC) was purchased from Avanti Polar Lipids (Alabaster, AL). This lipid was chosen because the bromine atoms allow the use of the multiwavelength anomalous dispersion (MAD) method for diffraction-phase analysis (32). It has been shown that the property of a Br substitution is equivalent to that of a methyl group CH3; the CH3-Br exchange does not alter the crystalline structures of glycerides (33). We have found that even though its chains are saturated, di18:0(9,10Br)PC is similar to DOPC in its phase behavior (34, 35, 36) and in its interactions with peptides (34, 37).
Multilamellar samples were prepared as described in Ludtke et al. (38). Briefly, the lipid was dissolved in 1:1 trifluoroethanol-chloroform solvent and uniformly deposited on a thoroughly cleaned silicon wafer. The organic solvent was evaporated in vacuum and then the deposit was hydrated with saturated water vapor at 35°C until the lipid film appeared smooth, uniform, and flat. The sample was 1 mg of lipid spread over an area 10 × 20 mm2. During the x-ray experiment, the sample was kept in a humidity-temperature chamber as described in Yang and Huang (39).
Diffraction data were collected at the beamline X21 of the National Synchrotron Light Source, Brookhaven National Laboratory (Upton, NY). Grazing-angle x-ray diffraction was performed as previously described (39). Aligned multilayers of di18:0(9,10Br)PC on a flat substrate were scanned at a grazing incident angle (∼0.3° relative to the substrate) in the range of temperature 15°–35°C and relative humidity (RH) 40%–100%. The diffraction patterns were recorded on a 2D detector perpendicular to the incident x ray.
The technical detail for the MAD method has been described in previous works (32, 34, 35). First, the absorption spectrum of bromine in the actual sample was measured (K-edge at 13.474 keV). By a standard procedure, the real and the imaginary parts of the Br atom's anomalous scattering factor were determined (35). Ten subedge x-ray energies were chosen such that the values of at successive chosen energies differ by in the unit of electron (see Table 1 of Qian et al. (34)). Each diffraction pattern was measured at these 10 chosen x-ray energies.
Table 1.
Data for the unit cell reconstruction
| No. | (H,K,L) | |F2| | |F0| | -F0/F2 | ε | F2 phase |
|---|---|---|---|---|---|---|
| 1 | (±1,0,3) (0,±1,3) | 8.9 | 2.7 | 0.31 | 0.969 | −1 |
| 2 | (±1,0,5) (0,±1,5) | 4.2 | 3.9 | −0.91 | −0.957 | −1 |
| 3 | (±1,0,7) (0,±1,7) | 19.9 | 10.9 | −0.55 | −0.990 | +1 |
| 4 | (±1,0,9) (0,±1,9) | 3.3 | 2.6 | −0.81 | −0.893 | −1 |
| 5 | (±1,0,11) (0,±1,11) | 35.4 | 16.3 | −0.46 | −0.990 | +1 |
| 6 | (±1,0,13) (0,±1,13) | 2.9 | 2.3 | −0.79 | −0.867 | +1 |
| 7 | (±1,0,15) (0,±1,15) | 23.0 | 18.9 | −0.82 | −0.964 | −1 |
| 8 | (±1,0,17) (0,±1,17) | 5.2 | 4.4 | −0.84 | −0.909 | −1 |
| 9 | (±1,±1,2) | 2.8 | 1.4 | 0.50 | 0.913 | −1 |
| 10 | (±1,±1,6) | 2.8 | 2.4 | −0.84 | −0.925 | +1 |
| 11 | (±1,±1,10) | 3.3 | 1.9 | −0.60 | −0.946 | −1 |
| 12 | (±2,0,12) (0,±2,12) | 2.5 | 1.8 | −0.73 | −0.961 | −1 |
| 13 | (±1,±2,13) (±2,±1,13) | 5.5 | 3.4 | −0.62 | −0.810 | +1 |
| 14 | (0,0,4) | 57.8 | 11.4 | 0.284 | 0.995 | −1 |
| 15 | (0,0,8) | 20.1 | 14.9 | −0.558 | −0.986 | −1 |
| 16 | (0,0,12) | 23.1 | 11.9 | −0.511 | −0.998 | −1 |
| 17 | (0,0,16) | 8.3 | 11.2 | −0.979 | −0.952 | −1 |
Results of multiwavelength anomalous dispersion analysis for the T phase of di18:0(9,10Br)PC at 56.5% RH, 15°C. Seventeen independent diffraction peaks, denoted by crystal indices (H,K,L), were detected. |F2|, |F0|, and –F0/F2 were obtained from the linear fits shown in Fig. 2. ε is the correlation coefficient of the linear fit.
Results and Analysis
Discovery of a tetragonal phase
In the temperature range studied, 15°–35°C, the lipid at full hydration (zero osmotic pressure) was in a fluid lamellar (L) phase (Fig. 1 A). Lamellar diffraction as analyzed previously (32) showed parallel bilayers separated by the phosphate-group-to-phosphate-group (P-P) distance of ∼2 nm. This P-P distance steadily decreased as the osmotic pressure increased (decreasing RH). At ∼64% RH (25°C), the lipid-water system underwent a phase transition. The new phase appeared in a periodic lattice of tetragonal symmetry (space group I41 (Fig. 1 B)). As the humidity level further decreased to ∼60% RH, the tetragonal (T) phase transformed to a rhombohedral (R) phase of lattice symmetry (Fig. 1 C). Below 60% RH, the system remained in the R phase and no further phase transition was observed.
Figure 1.
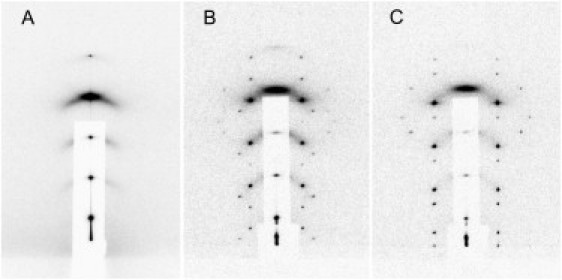
Grazing-angle diffraction patterns of di18:0(9,10Br)PC as a function of osmotic pressure (expressed by RH) at 25°C in (A) the L phase at humidity levels >64% RH, (B) the T phase at humidity between 64% and 60% RH, and (C) the R phase at humidity <60% RH.
The same L, T, and R phases appeared in each temperature between 15° and 35°C as a function of RH (see phase diagram in the Supporting Material). The phase boundaries have a small positive slope in the plot of RH versus temperature; otherwise, the diffraction patterns in each phase (Fig. 1) are closely similar at different temperatures. Strongest diffraction patterns were obtained at 15°C, which were used for analysis. The primitive unit cell of the T phase has dimensions a × a × 4c, with a = 7.99 nm and c = 5.06 nm. The unit cell consists of four square bilayer units. If the center of the first bilayer unit is at the origin (x = 0, y = 0, z = 0), the centers of the second, third, and fourth square bilayer units are, respectively, at for righthand screw symmetry, or at for lefthand screw symmetry. Both would give the same diffraction patterns. Seventeen independent diffraction peaks were detected (Fig. 1 B) and measured at 15°C and 56.5% RH. (At 15°C, the L/T transition is at ∼58% RH and the T/R transition at ∼54% RH.)
Br MAD analysis
Data reduction for the Br-MAD method has been described in previous articles (32, 34, 35). Symmetry-related peaks are grouped as one independent peak and their intensities averaged. Seventeen independent peaks are listed in Table 1. The integrated intensities of the diffraction peaks were reduced to the relative magnitudes of the diffraction amplitude at 10 different x-ray wavelengths, λ.
Let Fλ (Q) be the Fourier transform of the electron density within one square lipid-bilayer unit (1/4 of the unit cell). We denote the normal diffraction amplitudes of the whole system as F0, the normal diffraction amplitudes of the Br atoms alone as F2, and the scattering factor of Br as . Then the measured diffraction amplitude, Fλ, is given by . The T-lattice is not centrosymmetric. However, the lipidic structure in each bilayer unit arose spontaneously from symmetric bilayers. Therefore, the average molecular distribution in the bilayer unit is most likely approximately centrosymmetric. We assume this is the case, and the assumption will be directly tested and validated by the data. Under the assumption of centrosymmetry, the amplitudes F0 and F2 are real quantities, which leads to the equation , On the righthand side of this equation, the second term is ∼1% of the first term, due to the fact that at energies below the K edge, the values of are ∼10% of (34). Therefore, we obtained the approximate relation
| (1) |
The data versus show high degrees of linearity (Fig. 2). Therefore, from Eq. 1, the magnitudes of F0, F2, and their relative phase can be obtained by a linear fit. From the straight-line fitting in each panel of Fig. 2, the intercept of the fitted line gives ; the magnitude of the slope gives ; and the sign of the slope gives the sign of . The results for 17 independent Bragg peaks are listed in Table 1. The strong correlations of the linear fits (the correlation coefficients of the linear fits are in Table 1) indicate excellent quality of the data and, most importantly, justify the assumption of centrosymmetry in the lipid bilayer unit, since the linear relation Eq. 1 would not be valid without this assumption.
Figure 2.
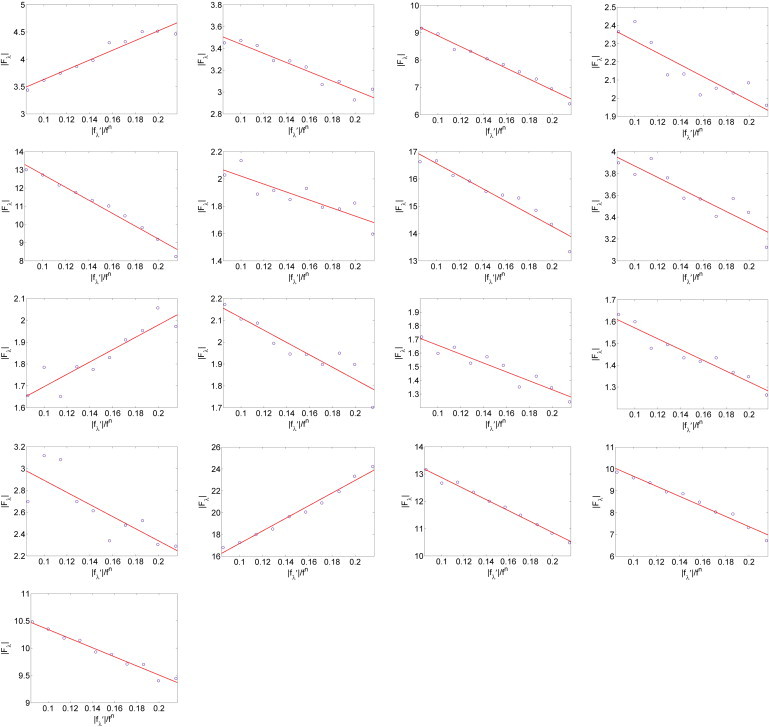
Multiwavelength anomalous dispersion analyses for the detected peaks. For each independent peak, the square root of the integrated intensity, , is plotted as a function of . The data are fit with a straight line, from which , , and the ratio are obtained. The results are shown in Table 1.
Phase determination
Our method yielded two sets of corresponding diffraction amplitudes, one for the whole lipid system and another for the Br atoms alone, as well as their relative phases (Table 1). Of significant importance, the result also validated the assumption that within the experimental resolution the electron density distribution in each bilayer unit is centrosymmetric. The centrosymmetry limits the phase of each diffraction amplitude to either 0 or π. This allowed us to examine all the possible phase combinations to determine the structure that makes physical sense. For a given choice of phases for F0 or F2, the unit cell structure for the whole system (if F0 is used) or for the Br distribution (if F2 is used) is given by
| (2) |
where the unit-cell form factor and . In principle, the Fourier synthesis with each term in the unit-cell form factor will reconstruct the electron density of the corresponding bilayer unit in the unit cell. Thus, the electron density of the bilayer unit with its center at the origin is obtained by replacing the form factor by 1 in Eq. 2. The unit cell is then built with four bilayer units arranged by a 41 screw operation.
A lipidic structure is defined by a continuous atomic (and molecular) distribution rather than by discrete atomic positions as in protein crystals. This is why the diffractions of lipidic structures are limited to low resolution (34). Only the high-electron-density groups, i.e., the distribution of Br atoms, and the distribution of phosphate headgroups are clearly identifiable in our case. In the last few years we have used the Br-MAD method to solve the structures of the hexagonal phase (35), the distorted hexagonal phase (36), and two different transmembrane pore structures in the R phase (34, 37). To solve the phase problems for these structures, we have made use of the Patterson function (34, 35, 36), the swelling method (37), and modeling methods (34, 35, 36). Through this experience, we have realized that we could have chosen the correct phases by examining all the possible phase combinations and obtained the same results.
This is possible because the correct electron distributions must satisfy considerable constraints. First, the phases for F0 and F2 are correlated in the sense that if one were chosen incorrectly, the other would also be incorrect. Second, we know that lipid molecules with water always form continuous layers (40). The requirements that 1), the Br distribution constructed from F2 and the whole lipid distribution constructed from F0 must be mutually consistent, and 2), the Br distribution and the phosphate distribution must constitute continuous, parallel layers provide sufficiently stringent conditions to determine the correct phases. We inspected all the possible combinations of phase choices and found the only structure that satisfied these two requirements, as shown in Fig. 3 (details in the Supporting Material). The corresponding phases are given in Table 1.
Figure 3.
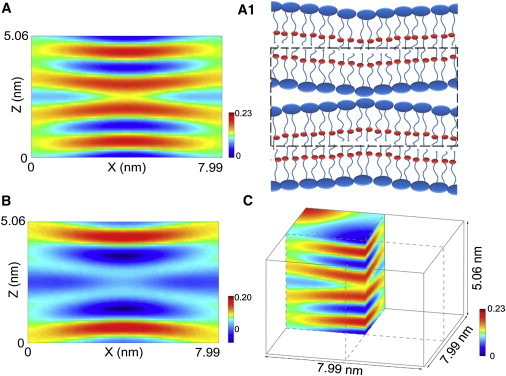
Electron density distributions in one bilayer unit consisting of the two contacting leaflets of merging bilayers. (A) Density distribution of the whole lipid obtained from F0. (A1) is the schematic of lipid distribution in A; the bilayer unit is enclosed by the dashed line; the red dots represent Br atoms. (B) Density distribution of Br atoms alone obtained from F2, corresponding to A; both shown on the y = 0 cross section. The multiwavelength anomalous dispersion method yields the two densities separately, but the phases must be chosen so that the results are consistent with each other (note the consistency between A and B). (C) One-fourth of one bilayer unit of whole lipid is shown in three dimensions with the boundary of the bilayer unit in solid lines 7.99 × 7.99 × 5.06 nm3.
The T-phase structure
The T phase electron density distribution in a bilayer unit showed that two adjacent lipid bilayers curved toward each other to form point contact (Fig. 3). The ridgeline of the electron density distribution representing the phosphate layer marks the positions of phosphorus (P) atoms. The shortest P-P distance between the two bilayers is 0.90 nm. Perhaps the two headgroups (the phosphorylcholines) are in contact, but there is no direct proof. For the convenience of discussion, we call the configuration of the two lipid bilayers in T phase in point contact. Outside of this region of point contact, the P-P distance gradually increased to 1.61 nm at the edge of the unit cell. Lipid bilayers abruptly transformed to this configuration of point contact from a parallel configuration in the lamellar phase where the P-P distance was a uniform value of 1.20 nm, right before the phase transition. Starting from the fully hydrated L phase where the P-P distance was ∼2 nm (32), osmotic pressure applied to the multilamellae monotonically decreased the P-P distance without changing the parallel configuration until the P-P distance reached this critical value of 1.20 nm. At this point, a slight increase in osmotic pressure transformed the parallel bilayers to a configuration of multiple contact points, one contact point for every (7.99)2 nm2 area. Most surprisingly, this point-contact configuration between lipid bilayers is sufficiently stable to form a periodic lattice. As the osmotic pressure further increased, the lipid configuration at each contact point abruptly transformed to a stalk (17, 39), and the stalks rearranged into a rhombohedral lattice of crystal axes a1 = (a, 0, 0) and , with lattice constants a = 7.58 nm and c = 5.00 nm (Fig. 3 C).
Discussion
Existence of a prestalk transition state
The R phase was discovered in an earlier study (17) and subsequently found in most bilayer-forming phospholipids with unsaturated chains, for example, DOPC (41) or its mixtures with DOPE (41) or with cholesterol (36, 42). The resolved electron density distribution of its unit cell showed that the adjacent leaflets of two apposed bilayers merged to form an hourglass-like connection (17). This discovery confirmed the long-speculated stalk intermediate state (43). The T phase had escaped discovery until recently (34) and is analyzed here for the first time, to our knowledge. In other lipid compositions, e.g., DOPC/DOPE mixtures, the T phase might be among the coexisting phases observed between the L phase and the R phase (41), and it would require a fine control of RH and a careful search to find it (an example for DOPC/DOPE 1:2 is shown in the Supporting Material). Typical phase boundaries exhibited multiple coexisting phases over an ∼2% range in RH. Therefore, it is difficult to isolate a phase if it exists within a range ≲2% in RH. The T phase of di18:0(9,10Br)PC has a range of 4% in RH.
Although in many cases the T phase may exist in too narrow an RH range between the L and R phases to be isolated, the changes from the L to T to R phases are the logical structural transitions for bilayer-forming phospholipids under increasing osmotic pressure (41). It is important to note (and it has been demonstrated experimentally (15, 16)) that applying osmotic pressure is entirely equivalent to applying mechanical pressure to the lipid bilayers, allowing the water to be squeezed out. Therefore, it is conceivable that these transitions can also occur between two parallel lipid bilayers subject to a compressive force, as in membrane fusion. Indeed, in a separate experiment, we injected a small volume of polymer solution in the vicinity of two closely positioned giant lipid vesicles (radius ∼10 μm) to provide an osmotic-depletion attractive force (44) between the two adjacent lipid bilayers. We found that hemifusion between the two vesicles would occur if the vesicles were made of lipids of negative spontaneous curvature (45).
When two lipid bilayers are forced to approach each other, there is an exponentially increasing potential energy resisting further decrease of the separation distance (16). However, at a certain distance, the energy of the system could be lowered by developing a contact region whereby the water molecules originally in the space occupied by the contact region are redistributed to increase the separation distance outside the contact region, provided that the contact region is no longer subject to the exponential hydration force. This argument was given by Kozlovsky et al. (46) as the energetic reason for the formation of the stalk phase. The hydration force (16) is a macroscopic phenomenon between hydrophilic surfaces. It may not operate between two small surfaces each consisting of a few lipid molecules. If this were true, small contact regions would develop in a stack of multiple bilayers at a sufficiently high osmotic pressure as we observed, according to the argument given by Kozlovsky et al. The existence of the T phase structure essentially proves that the point contact between bilayers is a low-energy state. Theoretical estimates and molecular dynamics simulations have suggested possible bilayer-bilayer contacts by a point-protrusion from a bilayer (28) or by two hydrocarbon chains of a single lipid inserting into the opposing membranes (29). Although such point contacts are consistent with our result, it is beyond the resolution of diffraction to confirm or disprove such microscopic structures.
Merging of lipid bilayers by force
Most significantly, our results show that there is a definitive merging pathway for a pair of lipid bilayers under a compression force against the hydration barrier. This result supports the force model of Jahn and Scheller (6), i.e., SNARE assemblies exert a compressive force on the juxtaposed membranes, perhaps by the zippering of SNARE complexes toward the linker regions (2, 6, 7, 13, 14, 26). As an illustration, consider a fusion reaction initiated by the assembly of SNARE complexes at a concentration of one complex/∼64 nm2 (the size of the T-phase unit cell) in the plane of juxtaposed membranes. Assuming that the complexes are randomly distributed, there will be a high probability for a protein-free region of ∼64 nm2 to be surrounded by approximately four SNARE complexes (Fig. 4). Then, if the SNARE complexes exert a sufficient compressive pressure, the bilayers within the area would spontaneously develop a point contact, which would further evolve into a hemifusion stalk. Thus, in this model, no mechanism is required to ring the proteins around a fusion zone.
Figure 4.
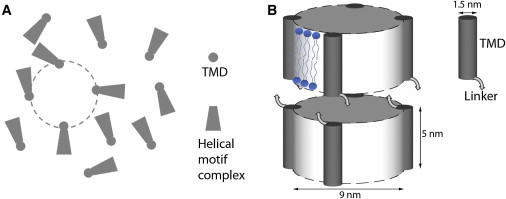
Schematic of a fusion zone: a stalk develops in an area ∼64 nm2. (A) If SNARE complexes are assembled at a concentration of one complex/∼64 nm2 in the plane of juxtaposed membranes, there is a high probability for a protein-free region ∼64 nm2 (dashed circle) randomly surrounded by approximately four SNARE complexes. (B) Side view of the area circled in A. The zippering of the complexes compresses the two membranes to hemifuse.
We can also estimate the energy required for a stalk formation. The osmotic pressure is given by , which is equivalent to a mechanical pressure P applied to the lipid bilayers while allowing water access to an external reservoir (15, 16, 31) (kB is the Boltzmann constant, T the absolute temperature, vw the molecular volume of water). At 64% RH (25°C), when the point contacts develop, the equivalent pressure on the lipid bilayers is P = 6.1 × 10⁸ dynes/cm2. The repulsive pressure by the hydration force between lipid bilayers is empirically expressed as , where P0 and λ are fitting parameters and dw is the water-layer thickness (16, 31). There is no clear definition for the water-layer thickness between lipid bilayers when its value is in the range ≲2 nm, because there is no planar separation of water and lipid. Thus, the value of λ depends on the definition of dw, which was fully discussed in Rand and Parsegian (31). P0 and λ have been measured for a wide range of lipids, e.g., for DOPC, and P0 = 1010.2 dynes/cm2, λ = 1.8 Å for DOPC/DOPE 1:3 (31).
By the empirical expression, the work done by the compressive force is , where A is the area to which the pressure is applied. (Note that to calculate W we do not need to use a value for dw, the correct value of which is difficult to determine (16, 31).)
Thus, the work done to overcome the hydration barrier for each contact region (64 nm2) is 118 kcal/mol (using λ = 2.1 Å). This is essentially the work done for producing a stalk, because very little work was done in the transition from the T phase (the point-contact phase) to the stalk phase. This energy depends on the lipid composition. For DOPC/DOPE (1:1), the L-to-R transition occurs near 80% RH (41); the work done for overcoming the hydration barrier to produce each stalk is ∼60 kcal/mol. Addition of cholesterol is known to raise the RH for the L-to-R transition (36, 42). Thus, it is reasonable to estimate that in general, the energy required for producing a stalk is in the range 50–100 kcal/mol (a precise value can be measured for each lipid composition). This energy range is compatible with the∼20 kcal/mol energy estimated to be released by each SNARE complex formation (47), since apparently multiple SNARE complexes are involved in each fusion reaction (6, 20).
Thus, our result suggests a distinct possibility that the formation of trans-SNARE complexes delivers a compressive force that initiates and completes the partial merger of membranes to the stalk hemifusion state. Merging by compressive force follows a definitive pathway: a point contact develops spontaneously between membranes that leads to a stalk. Recent evidence showed that hemifusion is a stable intermediate that may be used to prime synaptic vesicles for speedy response to calcium during synaptic transmission (14, 23, 26). Our studies (osmotic-pressure-induced phase transitions (41)) did not indicate that compressive force alone could advance fusion beyond stalk hemifusion. Additional actions on the membranes are likely needed to complete the remaining merging process to full fusion.
Acknowledgments
We thank Lin Yang for experimental assistance and discussions and James A. McNew for helpful comments.
This work was supported by National Institutes of Health Grant GM55203 and Robert A. Welch Foundation Grant C-0991. The experiment was carried out in part at the National Synchrotron Light Source, Brookhaven National Laboratory, which was supported by the U.S. Department of Energy under Contract No. DE-AC02-98CH10886.
Editor: Lukas Tamm.
Footnotes
Phase diagram of di18:0(9,10Br)PC, T phase in DOPC/DOPE mixtures, solution to the diffraction phase problem, and three figures are available at http://www.biophysj.org/biophysj/supplemental/S0006-3495(11)05360-4.
Supporting Material
References
- 1.Südhof T.C., Rothman J.E. Membrane fusion: grappling with SNARE and SM proteins. Science. 2009;323:474–477. doi: 10.1126/science.1161748. [DOI] [PMC free article] [PubMed] [Google Scholar]
- 2.Stein A., Weber G., et al. Jahn R. Helical extension of the neuronal SNARE complex into the membrane. Nature. 2009;460:525–528. doi: 10.1038/nature08156. [DOI] [PMC free article] [PubMed] [Google Scholar]
- 3.Rizo J., Rosenmund C. Synaptic vesicle fusion. Nat. Struct. Mol. Biol. 2008;15:665–674. doi: 10.1038/nsmb.1450. [DOI] [PMC free article] [PubMed] [Google Scholar]
- 4.Wickner W., Schekman R. Membrane fusion. Nat. Struct. Mol. Biol. 2008;15:658–664. doi: 10.1038/nsmb.1451. [DOI] [PMC free article] [PubMed] [Google Scholar]
- 5.Kloepper T.H., Kienle C.N., Fasshauer D. An elaborate classification of SNARE proteins sheds light on the conservation of the eukaryotic endomembrane system. Mol. Biol. Cell. 2007;18:3463–3471. doi: 10.1091/mbc.E07-03-0193. [DOI] [PMC free article] [PubMed] [Google Scholar]
- 6.Jahn R., Scheller R.H. SNAREs—engines for membrane fusion. Nat. Rev. Mol. Cell Biol. 2006;7:631–643. doi: 10.1038/nrm2002. [DOI] [PubMed] [Google Scholar]
- 7.Hanson P.I., Roth R., et al. Heuser J.E. Structure and conformational changes in NSF and its membrane receptor complexes visualized by quick-freeze/deep-etch electron microscopy. Cell. 1997;90:523–535. doi: 10.1016/s0092-8674(00)80512-7. [DOI] [PubMed] [Google Scholar]
- 8.Martens S., McMahon H.T. Mechanisms of membrane fusion: disparate players and common principles. Nat. Rev. Mol. Cell Biol. 2008;9:543–556. doi: 10.1038/nrm2417. [DOI] [PubMed] [Google Scholar]
- 9.McMahon H.T., Kozlov M.M., Martens S. Membrane curvature in synaptic vesicle fusion and beyond. Cell. 2010;140:601–605. doi: 10.1016/j.cell.2010.02.017. [DOI] [PubMed] [Google Scholar]
- 10.Kozlov M.M., McMahon H.T., Chernomordik L.V. Protein-driven membrane stresses in fusion and fission. Trends Biochem. Sci. 2010;35:699–706. doi: 10.1016/j.tibs.2010.06.003. [DOI] [PMC free article] [PubMed] [Google Scholar]
- 11.Chernomordik L.V., Kozlov M.M. Protein-lipid interplay in fusion and fission of biological membranes. Annu. Rev. Biochem. 2003;72:175–207. doi: 10.1146/annurev.biochem.72.121801.161504. [DOI] [PubMed] [Google Scholar]
- 12.Chernomordik L.V., Kozlov M.M. Mechanics of membrane fusion. Nat. Struct. Mol. Biol. 2008;15:675–683. doi: 10.1038/nsmb.1455. [DOI] [PMC free article] [PubMed] [Google Scholar]
- 13.Pobbati A.V., Stein A., Fasshauer D. N- to C-terminal SNARE complex assembly promotes rapid membrane fusion. Science. 2006;313:673–676. doi: 10.1126/science.1129486. [DOI] [PubMed] [Google Scholar]
- 14.Sørensen J.B., Wiederhold K., et al. Fasshauer D. Sequential N- to C-terminal SNARE complex assembly drives priming and fusion of secretory vesicles. EMBO J. 2006;25:955–966. doi: 10.1038/sj.emboj.7601003. [DOI] [PMC free article] [PubMed] [Google Scholar]
- 15.Parsegian V.A., Rand R.P., et al. Rau D.C. Osmotic stress for the direct measurement of intermolecular forces. Methods Enzymol. 1986;127:400–416. doi: 10.1016/0076-6879(86)27032-9. [DOI] [PubMed] [Google Scholar]
- 16.Leikin S., Parsegian V.A., et al. Rand R.P. Hydration forces. Annu. Rev. Phys. Chem. 1993;44:369–395. doi: 10.1146/annurev.pc.44.100193.002101. [DOI] [PubMed] [Google Scholar]
- 17.Yang L., Huang H.W. Observation of a membrane fusion intermediate structure. Science. 2002;297:1877–1879. doi: 10.1126/science.1074354. [DOI] [PubMed] [Google Scholar]
- 18.Kanaseki T., Kawasaki K., et al. Ohnishi S. Structural features of membrane fusion between influenza virus and liposome as revealed by quick-freezing electron microscopy. J. Cell Biol. 1997;137:1041–1056. doi: 10.1083/jcb.137.5.1041. [DOI] [PMC free article] [PubMed] [Google Scholar]
- 19.Siegel D.P., Epand R.M. The mechanism of lamellar-to-inverted hexagonal phase transitions in phosphatidylethanolamine: implications for membrane fusion mechanisms. Biophys. J. 1997;73:3089–3111. doi: 10.1016/S0006-3495(97)78336-X. [DOI] [PMC free article] [PubMed] [Google Scholar]
- 20.Brunger A.T. Structure and function of SNARE and SNARE-interacting proteins. Q. Rev. Biophys. 2005;38:1–47. doi: 10.1017/S0033583505004051. [DOI] [PubMed] [Google Scholar]
- 21.Su Z., Ishitsuka Y., et al. Shin Y.K. The SNARE complex from yeast is partially unstructured on the membrane. Structure. 2008;16:1138–1146. doi: 10.1016/j.str.2008.03.018. [DOI] [PMC free article] [PubMed] [Google Scholar]
- 22.Rizo J., Chen X., Araç D. Unraveling the mechanisms of synaptotagmin and SNARE function in neurotransmitter release. Trends Cell Biol. 2006;16:339–350. doi: 10.1016/j.tcb.2006.04.006. [DOI] [PubMed] [Google Scholar]
- 23.Schaub J.R., Lu X., et al. McNew J.A. Hemifusion arrest by complexin is relieved by Ca2+-synaptotagmin I. Nat. Struct. Mol. Biol. 2006;13:748–750. doi: 10.1038/nsmb1124. [DOI] [PubMed] [Google Scholar]
- 24.Lu X., Zhang F., et al. Shin Y.K. Membrane fusion induced by neuronal SNAREs transits through hemifusion. J. Biol. Chem. 2005;280:30538–30541. doi: 10.1074/jbc.M506862200. [DOI] [PubMed] [Google Scholar]
- 25.Xu Y., Zhang F., et al. Shin Y.K. Hemifusion in SNARE-mediated membrane fusion. Nat. Struct. Mol. Biol. 2005;12:417–422. doi: 10.1038/nsmb921. [DOI] [PubMed] [Google Scholar]
- 26.Vrljic M., Strop P., et al. Brunger A.T. Molecular mechanism of the synaptotagmin-SNARE interaction in Ca2+-triggered vesicle fusion. Nat. Struct. Mol. Biol. 2010;17:325–331. doi: 10.1038/nsmb.1764. [DOI] [PMC free article] [PubMed] [Google Scholar]
- 27.Kozlov M.M. Biophysics: joint effort bends membrane. Nature. 2010;463:439–440. doi: 10.1038/463439a. [DOI] [PubMed] [Google Scholar]
- 28.Efrat A., Chernomordik L.V., Kozlov M.M. Point-like protrusion as a prestalk intermediate in membrane fusion pathway. Biophys. J. 2007;92:L61–L63. doi: 10.1529/biophysj.106.103341. [DOI] [PMC free article] [PubMed] [Google Scholar]
- 29.Smirnova Y.G., Marrink S.J., et al. Knecht V. Solvent-exposed tails as prestalk transition states for membrane fusion at low hydration. J. Am. Chem. Soc. 2010;132:6710–6718. doi: 10.1021/ja910050x. [DOI] [PubMed] [Google Scholar]
- 30.Kuzmin P.I., Zimmerberg J., et al. Cohen F.S. A quantitative model for membrane fusion based on low-energy intermediates. Proc. Natl. Acad. Sci. USA. 2001;98:7235–7240. doi: 10.1073/pnas.121191898. [DOI] [PMC free article] [PubMed] [Google Scholar]
- 31.Rand R.P., Parsegian V.A. Hydration forces between phospholipid bilayers. Biochim. Biophys. Acta. 1989;988:351–376. [Google Scholar]
- 32.Wang W., Pan D., et al. Huang H.W. Method of x-ray anomalous diffraction for lipid structures. Biophys. J. 2006;91:736–743. doi: 10.1529/biophysj.105.080267. [DOI] [PMC free article] [PubMed] [Google Scholar]
- 33.Larsson K. The crystal structure of the beta-form of triglycerides. Proc. Chem. Soc. 1963 (March):87–88. [Google Scholar]
- 34.Qian S., Wang W., et al. Huang H.W. Structure of the alamethicin pore reconstructed by x-ray diffraction analysis. Biophys. J. 2008;94:3512–3522. doi: 10.1529/biophysj.107.126474. [DOI] [PMC free article] [PubMed] [Google Scholar]
- 35.Pan D., Wang W., et al. Huang H.W. Chain packing in the inverted hexagonal phase of phospholipids: a study by X-ray anomalous diffraction on bromine-labeled chains. J. Am. Chem. Soc. 2006;128:3800–3807. doi: 10.1021/ja058045t. [DOI] [PMC free article] [PubMed] [Google Scholar]
- 36.Wang W., Yang L., Huang H.W. Evidence of cholesterol accumulated in high curvature regions: implication to the curvature elastic energy for lipid mixtures. Biophys. J. 2007;92:2819–2830. doi: 10.1529/biophysj.106.097923. [DOI] [PMC free article] [PubMed] [Google Scholar]
- 37.Qian S., Wang W., et al. Huang H.W. Structure of transmembrane pore induced by Bax-derived peptide: evidence for lipidic pores. Proc. Natl. Acad. Sci. USA. 2008;105:17379–17383. doi: 10.1073/pnas.0807764105. [DOI] [PMC free article] [PubMed] [Google Scholar]
- 38.Ludtke S., He K., Huang H. Membrane thinning caused by magainin 2. Biochemistry. 1995;34:16764–16769. doi: 10.1021/bi00051a026. [DOI] [PubMed] [Google Scholar]
- 39.Yang L., Huang H.W. A rhombohedral phase of lipid containing a membrane fusion intermediate structure. Biophys. J. 2003;84:1808–1817. doi: 10.1016/S0006-3495(03)74988-1. [DOI] [PMC free article] [PubMed] [Google Scholar]
- 40.Luzzati V., Gulik-Krzywicki T., et al. Rand R.P. X-ray study of model systems: structure of the lipid-water phases in correlation with the chemical composition of the lipids. J. Gen. Physiol. 1968;51(5, Suppl):37S. [PubMed] [Google Scholar]
- 41.Yang L., Ding L., Huang H.W. New phases of phospholipids and implications to the membrane fusion problem. Biochemistry. 2003;42:6631–6635. doi: 10.1021/bi0344836. [DOI] [PubMed] [Google Scholar]
- 42.Aeffner S., Reusch T., et al. Salditt T. Membrane fusion intermediates and the effect of cholesterol: an in-house X-ray scattering study. Eur Phys J E Soft Matter. 2009;30:205–214. doi: 10.1140/epje/i2009-10466-x. [DOI] [PubMed] [Google Scholar]
- 43.Markin V.S., Kozlov M.M., Borovjagin V.L. On the theory of membrane fusion. The stalk mechanism. Gen. Physiol. Biophys. 1984;3:361–377. [PubMed] [Google Scholar]
- 44.Kuhl T., Guo Y., et al. Hui S.W. Direct measurement of polyethylene glycol induced depletion attraction between lipid bilayers. Langmuir. 1996;12:3003–3014. [Google Scholar]
- 45.Sun Y., Lee C.C., Huang H.W. Adhesion and merging of lipid bilayers: a method for measuring the free energy of adhesion and hemifusion. Biophys. J. 2011;100:987–995. doi: 10.1016/j.bpj.2011.01.013. [DOI] [PMC free article] [PubMed] [Google Scholar]
- 46.Kozlovsky Y., Efrat A., et al. Kozlov M.M. Stalk phase formation: effects of dehydration and saddle splay modulus. Biophys. J. 2004;87:2508–2521. doi: 10.1529/biophysj.103.038075. [DOI] [PMC free article] [PubMed] [Google Scholar]
- 47.Li F., Pincet F., et al. Tareste D. Energetics and dynamics of SNAREpin folding across lipid bilayers. Nat. Struct. Mol. Biol. 2007;14:890–896. doi: 10.1038/nsmb1310. [DOI] [PubMed] [Google Scholar]
Associated Data
This section collects any data citations, data availability statements, or supplementary materials included in this article.