Abstract
Background
Recently, matrix-assisted laser desorption/ionization time-of-flight mass spectrometry (MALDI-TOF MS) technology has been applied to the exploration of biomarkers for early cancer diagnosis, but more effort is required to identify a single sensitive and specific biomarker. For early diagnosis, a proteomic profile is the gold standard, but inconvenient for clinical use since the profile peaks are quantitative. It would therefore be helpful to find a minimized profile, comprising fewer peaks than the original using an existing algorithm and compare it with other traditional statistical methods.
Methods
In the present study, principal component analysis (PCA) in the ClinProt-Tools of MALDI-TOF MS was used to establish a mini-optimized proteomic profile from gastric cancer patients and healthy controls, and the result was compared with t-test and Flexanalysis software.
Results
Eight peaks were selected as the mini-optimized proteomic profile to help differentiate between gastric cancer patients and healthy controls. The peaks at m/z 4212 were regarded as the most important peak by the PCA algorithm. The peaks at m/z 1866 and 2863 were identified as deriving from complement component C3 and apolipoprotein A1, respectively.
Conclusions
PCA enabled us to identify a mini-optimized profile consisting of significantly differentiating peaks and offered the clue for further research.
Keywords: MALDI-TOF MS, mini-profile, PCA, proteomics
1. Introduction
Recently, MALDI-TOF MS technology has mostly been applied to the search for biomarkers [1–3] for early cancer diagnosis[4,5]. The advantages of this technology include its low-cost, accurate mass/charge measurement, larger affinity surface, and good reproducibility[6–9]. To date, however, this technology has revealed no biomarker for clinical use that has been validated in patients on a large scale[10,11]. More effort is therefore needed to identify a single sensitive and specific biomarker[12–14]. For early diagnosis[15,16], a proteomic profile consisting of many differentiated peaks remains the gold standard, but it is inconvenient for clinical use because the profile peaks are quantitative and too many are unidentified[17,18]. Although more and more peaks have been revealed, it is not clear which are the most meaningful peak according to the traditional algorithm[19,20]. Therefore, it would be necessary to establish a minimized profile for convenient clinical use, only comprising fewer peaks than the original, and using an existing algorithm to compare it with other statistical methods. Meanwhile, the peak(s) most useful as potential biomarker(s) would finally be identified.
In the past, two main methods were generally used to identify the differential peaks in a MALDI-TOF MS spectrum. One was to analyze different groups of spectra using Flexanalysis software, which is related to ClinProt-Tools software but independent of it. Flexanalysis allows different groups of peaks to be compared visually, with some peaks directly selected with it[21]. However, most other peaks which could not be selected for lack of statistical support had key information which may have been lost from the results[22,23]. Fortunately, those peaks were to be confirmed as differential peaks using p values obtained by t-tests/ANOVA in ClinProt-Tools which enhanced accuracy. However, too many peaks were obtained according to the p value and, because of the limitations of the t-test algorithm itself, some significantly differential peaks might have been overlooked [18], too. To solve the problem, the present study describes the use of an existing statistical method, and principle component analysis (PCA) for identifying the significantly differential peaks in the spectral data. PCA is a widely used mathematical technique designed to extract, display and rank the variance within a data set[24]. The overall goal of PCA is to reduce the dimensionality of a data set, simultaneously retaining the information present in the data. In data sets with many groups of variables, different variables often show similar behavior so they contain redundant information. In the case of mass spectra, the variables are the intensities at defined masses. Depending on the resolution, there can be many of them. PCA reduces the number of dependent variables in the spectral set by replacing groups of intercorrelated variables with a single new variable. This generates a set of new variables, so-called principal components (PCs).
The PCA algorithm was adapted to the Clinprot-tools software in MALDI-TOF MS. This method calculated the spectral data comprehensively, yielding many principle components for analysis. However, PCA still gave an immense amount of information; in clinic more typical and generalized information is required. Fortunately, the first three principle components (PC1, PC2, PC3) differentiated the samples remarkably well from pre-established groups and they were also convenient for representing dimensionally. The loading values provided by PCA made it easy to select the contributing peaks for further analysis. During the calculation of PCs, the variables (peaks) are given different loadings depending on the amount of variance of a PC they explain. In dependence on their contribution to the explained variance of a PC, the loadings values are between −1 and 1.
In the present study, for the training group, 34 gastric cancer patients and 18 healthy volunteers with no evidence of disease were selected to use for the original profile and peaks were collected in the MS range m/z 1–13,000 by MALDI-TOF MS. PCA integrated in ClinProTools software was used to generate a mini-optimized profile consisting of peaks that appeared to be specifically differentiating on the basis of the loading values. The p values of those peaks were determined by t-tests in ClinProTools software. Flexanalysis software, independent of ClinProTools, was used to compare the different spectra macroscopically in a stack view. Those peaks derived from PCA could also be compared with the result of Flexanalysis and t-tests/ANOVA.
2. Materials and Methods
2.1 Patients and samples
The serum samples were collected from all gastric cancer in-patients in the general hospital of PLA between January and November 2009. All samples were obtained with patient consent and institutional review board approval. Whole blood was collected and centrifuged at 3500 rpm at room temperature for 7 min. The serum samples were immediately stored as aliquots at −80°C until use. A total of 72 serum specimens were collected. The control specimens (n = 18) were from 18 volunteers with no evidence of disease. The cancer specimens from 54 patients with gastric cancer were divided into two groups; training group (n =34) for the original profile, testing group (n =20) for the validation. These cancers had been confirmed pathologically before treatment was initiated or serum collected. Tumor Node Metastasis (TNM) staging information was available on 54 gastric cancer samples. The distribution was T3N1Mx n=6, T3N0Mx n=5, T2N1Mx n= 8, T2N0Mx n= 10, T1N1Mx n= 11, and T1N0Mx n=14. The mean ages (±SD) of the groups were healthy controls 48.5±11.5 and gastric cancer patients’ 58±8.6 years.
MALDI-TOF MS Serum samples (5 μL) were processed using a magnetic bead-based weak cation exchanger (WCX, Bruker Daltonics, Germany) according to the manufacturer’s protocols. The WCX was supplied as part of a kit, with standard protocol and binding and washing buffer provided. In brief, a 5 μL serum sample was mixed with 10 μL binding solution in a standard thin-wall PCR tube, then 10 μL WCX was added and the solution was mixed carefully by pipetting up and down several times. To separate the unbound solution, the tube was placed in a magnetic bead separator and the supernatant was removed carefully using a pipette. The magnetic beads were then washed three times with 100 μL washing buffer. After binding and washing, the bound proteins/peptides were eluted from the magnetic beads using 5 μL 50% acetonitrile. A portion of the eluted sample was diluted 1:10 in matrix solution comprising of α-cyano-4-hydroxycinnamic acid (0.3 g/L in 2:1 ethanol: acetone). Then 0.5 μL of the resulting mixture was spotted on to a sample support (AnchorChip target, Bruker Daltonics) and allowed to air-dry for approximately 5 min at room temperature. The samples were analyzed on a MALDI-TOF mass spectrometer (MicroFlex, Bruker Daltonics). Ionization was achieved by irradiation with a nitrogen laser (λ = 337 nm) operating at 20 Hz. An average of 50 shots at each of 10 positions was collected for a total of 500 shots/spot; Anchorchip plate locations were calibrated prior to each run. Positive ions were accelerated at 19 kV with 80 ns pulsed ion extraction delay. Each spectrum was recorded in linear positive mode and was externally calibrated using a standard mixture of peptides. In order to increase detection sensitivity, excess matrix was removed with 10 shots at a laser power of 80% prior to acquisition of spectra with 100 shots at a fixed laser power of 20%. One hundred and forty mass spectra were acquired using FlexControl software (Bruker Daltonics, Germany) and each spectrum consisted of about m/z 10,000 values with the corresponding intensities in the mass range of 1–13,000.
2.2 Peak detection in MALDI spectra
All the spectra were compiled and normalized to the total ion current of an m/z value ranging from 1–13,000 and the baselines were subtracted. The part of the spectrum with m/z values less than 1,000 was not used for analysis because signals generally interfered with peak detection in this area. Peaks with m/z values between 1,000 and 13,000 were auto-detected with a signal-to-noise ratio of 5. We first split the data into a training set (including 34 pre-operative samples) and testing set (including 20 pre-operative samples). Each sample spectrum was introduced to Flexcontrol software, and the classification algorithm (reference to p value of t-tests/ANOVA, etc.) was automatically performed to yield the set difference. Flexanalysis Software was used for macroscopic comparisons of different spectra in the stack view. Principle component analysis (PCA, ClinprotTool 2.0; Bruker Daltonics) was used to analyze the proteomic features of the data (MALDI spectra). For simplified analysis, peaks with the higher single contribution (SC) derived from loading value were selected for further determination of the mini-optimized profile.
2.3 MALDI-TOF MS/MS
Peptides were sequenced on a 4800 MALDI analyzer (Applied Biosystems, CA) with positive ion mode in both reflector and MS/MS acquisitions and with a laser repetition rate of 200 Hz. In both modes, reflector spectra were obtained for the peptide mixture in the 800–4000 Da mass range. In MS/MS mode, 2 kV collision energy (with CID gas ON) was used to fragment the peptides. Databases were searched for peptide identification using MASCOT Distiller 2.1 (Matrix Science, http://www.matrixscience.com). No enzyme was used in this search and both MS and MS/MS tolerances were 0.3 Da.
2.4 Quality control of MALDI spectra
The reproducibility of the MALDI spectra was estimated by using two representative serum samples: one from a healthy control and the other from a cancer patient. To assess intrachip variability, each serum sample was loaded on to three spots of an Anchorchip. To assess interchip variability, the same samples were assayed three times independently. Six peaks were selected randomly over the course of the study and used to calculate the intra-array and inter-array coefficients of variance (CV).
3. Results
3.1 Detection of MALDI spectra
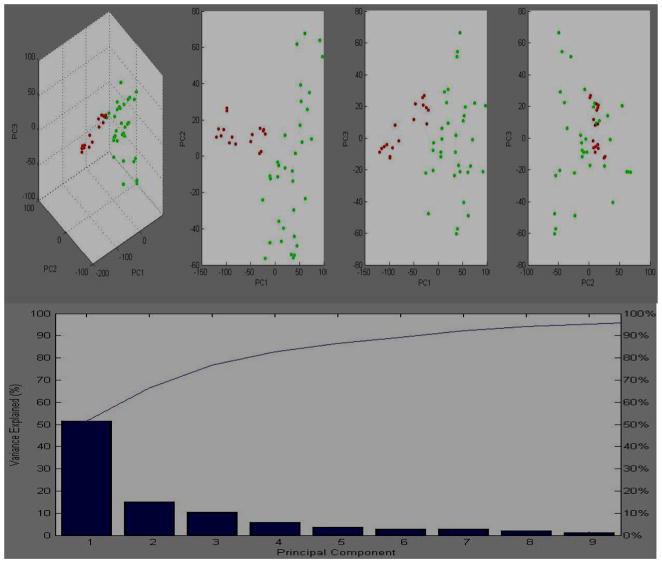
The MALDI-TOF MS spectra (Bruker Daltonics, Germany) were imported into ClinProTools software for post-processing and generation of proteomic profiles. Normalizing, baseline subtracting, peak defining, recalibrating and comparison of multiple spectra were performed automatically by the ClinProTools software. The classification algorithm was used to determine the rate of cross-validation and recognition capability between the gastric cancer and control groups. The cross-validation and recognition capability were 96.97% and 97.06% in the 34 gastric cancer patients and 18 controls, respectively. The state of classification of the two sets of samples was demonstrated in the first three principal components model of PCA (Fig. 1A).
Figure 1.
The dimensional image from PCA shows the distinction between 34 gastric cancer patients and 18 healthy controls. A: the classification of disease and healthy controls in the first three principal component model (PC1, PC2, PC3 ). B: the contribution of nine principal components to the profiling classification in plot of percentage explained variance of PC. The contributions of PC1, PC2, and PC3 were approximately 52%, 15%, and 12%, respectively. Red dot: healthy controls; green dot, disease group.
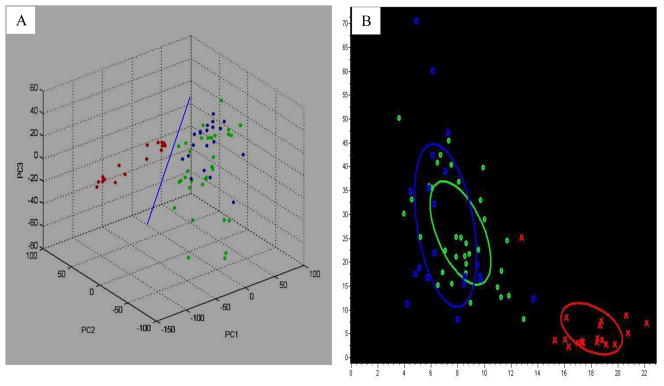
The contributions of PC1, PC2, and PC3 to the generation of profile in a percentage plot of the variance explained were approximately 52%, 15%, and 12%, respectively (Fig 1B). To validate the original profile, another 20 gastric cancer patients were selected for PCA. In the validation process, the 20 gastric cancer patients were used to validate the model established from the previous 34 gastric cancer patients and 18 healthy controls. The accuracy was 94.5% (Fig 2).
Figure 2.
The dimensional (A) and planar (B) images show the distribution of 20 pre-operative samples in the original profiling. The accuracy of the distribution was 94.5%. A: the dimensional image of PCA analysis; B: the planar image of distinction derived from two peaks, m/z 1866 and 4212. Red: controls; green: 34 pre-operative patients; blue: another 20 pre-operative patients.
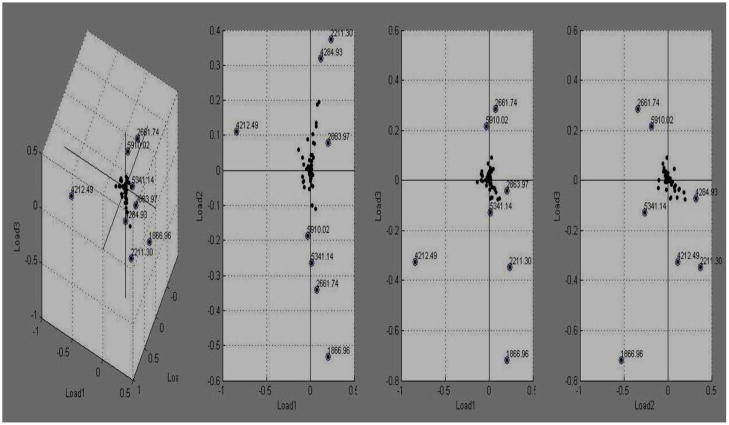
Using Clinprot-Tools, t-tests of the peak intensity difference enabled us to rank a series of 53 differentiated peaks (p<0.05) (data not shown). To determine the minimized differential peaks set, PCA analysis was used to generate a dimensional view of the differential peak dot. It revealed eight dots representing different peaks of mean masses m/z1866, m/z 2211, m/z 2661, m/z2863, m/z 4284, m/z4212, m/z5341, and m/z5910 (Fig. 3).
Figure 3.
The dots show the corresponding spatial scattering state of the differential peaks in loading mode. Each dot indicates the intensity value of a peaks; mean masses 1866m/z, 2211m/z, 2661m/z, 2863m/z, 4284m/z, 4212m/z, 5341m/z, and 5910m/z were the differential peaks since its position was away from the center. The peaks were differential up to the loading value corresponding to the loading (Loading1, Loading 2, Loading 3) model in three binary images.
In the loading model (Loading 1, Loading 2, Loading 3); the loading values of each peak were obtained during the calculation of PCs. The peaks were given a different loadings value, depending on the amount of variance of a PC they explained, and the value size was in dependence on their contribution to the explained variance of a PC. The loadings values were between -1 and 1. According to the calculation of the PCA algorithm, each peak could obtain loading values which originate from the calculation of PCs. In this text, a peak was given three loading values originated from three PCs (PC1, PC2, and PC3) calculation. Meanwhile, the contributions of PC1, PC2, and PC3 to the generation of profile in a percentage plot of the variance explained were approximately 52%, 15%, and 12%, respectively. Thus, the single contribution (SC) of a peak through a PC to the profile was equal to the product of loading value and contribution of PC. The total contribution (TC) of each peak to the profile was the sum of three SC values of each peak. The absolute value of TC determined the significance of a peak (Table 1).
Table 1.
The TC values of the eight peaks in PCA. The absolute value standing for the scattering degree to a certain PC is indicated with “-” standing for the direction. The sum of absolute values of peaks shows the significance of difference. Therefore, the rank of eight peaks was 4212 (TC=47.33), 1866 (TC=28.79), 2212 (TC=23.02), 2661(TC=19.9), 4284 (TC=17.88), 2863 (TC=14.67), 5909 (TC=6.41), and 5341 (TC=6.1). SC: single contribution, SC= loading value ×contribution of PC×100, (PC1=52%, PC2=15%, PC3=12%); TC: the sum of absolute value from SC.
| m/z | 1866 | SC | 2212 | SC | 2661 | SC | 2863 | SC | 4212 | SC | 4284 | SC | 5341 | SC | 5909 | SC |
|---|---|---|---|---|---|---|---|---|---|---|---|---|---|---|---|---|
| Loading 1 | 0.23 | 11.96 | 0.25 | 13 | 0.22 | 11.44 | 0.24 | 12.48 | −0.8 | −4.16 | 0.24 | 12.48 | 0.01 | 0.52 | −0.02 | −1.04 |
| Loading 2 | −0.53 | −7.95 | 0.38 | 5.7 | −0.34 | −5.1 | 0.09 | 1.35 | 0.11 | 1.65 | 0.32 | 4.8 | −0.26 | −3.9 | −0.19 | −2.85 |
| Loading 3 | −0.74 | −8.88 | −0.36 | −4.32 | 0.28 | 3.36 | −0.07 | −0.84 | −0.34 | −4.08 | −0.05 | −0.6 | −0.14 | −1.68 | 0.21 | 2.52 |
| TC | 28.79 | 23.02 | 19.9 | 14.67 | 47.33 | 17.88 | 6.1 | 6.41 |
The loading values of peaks close to the axis were not apparently significant for the minimized profile (data not shown). The p values of t-tests and the average value of the eight peaks identified by PCA are shown in table 2.
Table 2.
The p values of the eight peaks obtained from the t-tests algorithm. Index, sequence of peak; Mass, m/z; PTTA, p value of t-test (two classes); PWKW, p value of Wilcoxon test (>two classes); PAD, p-value of Anderson-Darling test, which gives information about normal distribution; range 0…1; 0: not normal distribution; 1: normal distribution; AVE1: the average value of group 1 (healthy controls); AVE2: the average value of group 2 (gastric cancer).
| Index | Mass | PTTA | PWKW | PAD | Ave1 | Ave2 |
|---|---|---|---|---|---|---|
| 15 | 2863 | <0.000001 | <0.000001 | 0.0228 | 6.8 | 29.11 |
| 1 | 1866 | <0.000001 | <0.000001 | 3.54E-06 | 6.95 | 43.22 |
| 42 | 4212 | <0.000001 | <0.000001 | 0.00128 | 149.88 | 66.5 |
| 10 | 2211 | 0.000186 | 7.07E-05 | <0.000001 | 11.96 | 34.29 |
| 12 | 2661 | 0.00203 | 0.0102 | <0.000001 | 19.13 | 33.54 |
| 57 | 5341 | 0.00203 | 0.0102 | 0.00387 | 10.73 | 20.52 |
| 46 | 4284 | 0.0395 | 0.91 | <0.000001 | 6.58 | 14.73 |
| 61 | 5910 | 0.817 | 0.928 | 0.00124 | 18.26 | 19.49 |
According to the average value, seven of these peaks (m/z1866, m/z2211, m/z2661, m/z 2863, m/z4284, m/z5341, and m/z5910) were up-regulated and the other (m/z4212) was down-regulated when the peak intensities were compared.
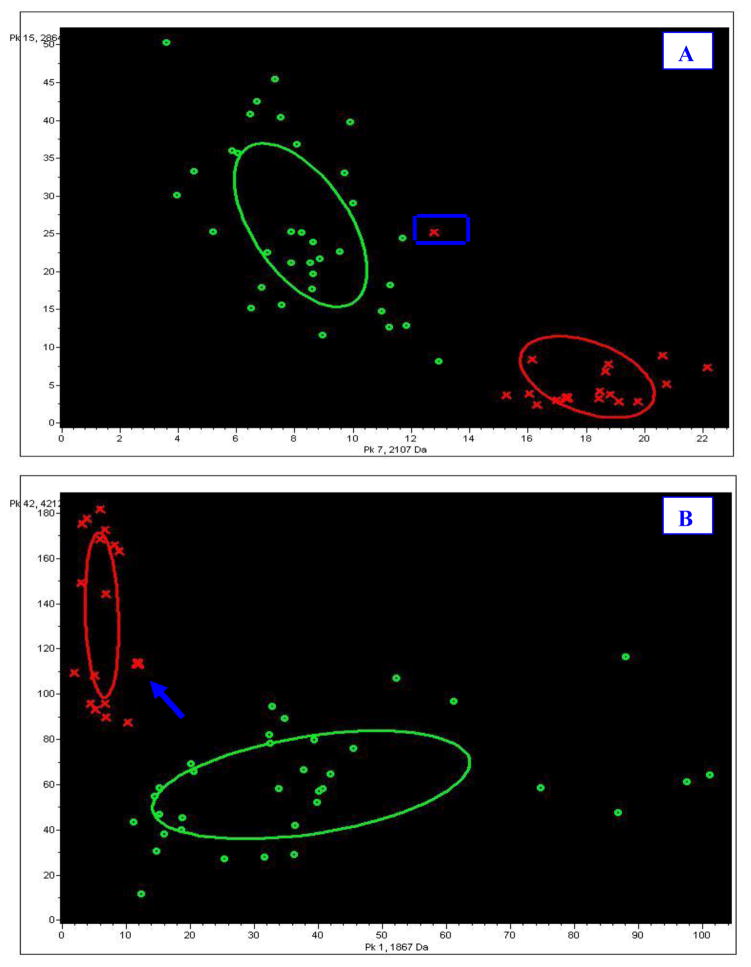
To compare the abilities of t-test and PCA to classify the peaks, the first two peaks (peak No.15, m/z 2863; peak No.7, m/z 2107) in the t-test p value list and two peaks significant in PCA (peak No.42, m/z 4212, total contribution TC=47.33; peak No.1, m/z1866, total contribution=28.79) were selected as the peak combination to distinguish the disease from the control group in a binary image. The combination of peaks from PCA gave the more definite distinction (Fig 4).
Figure 4.
Comparison of effects of different peak combinations on classification. From the image, one sample signified by a blue frame was transferred to the disease group, as the blue arrow in B shows. A: classification effect of the first two peaks (pk15, 2863 Da; pk7, 2107 Da) from list of p values; B: classification effect of two significant peaks (pk 42, 4212 Da, sum contribution=47.33; pk1, 1866Da, sum contribution=28.79) according to the sum contribution value. Crosses dot: healthy control; circles dot: disease group sample.
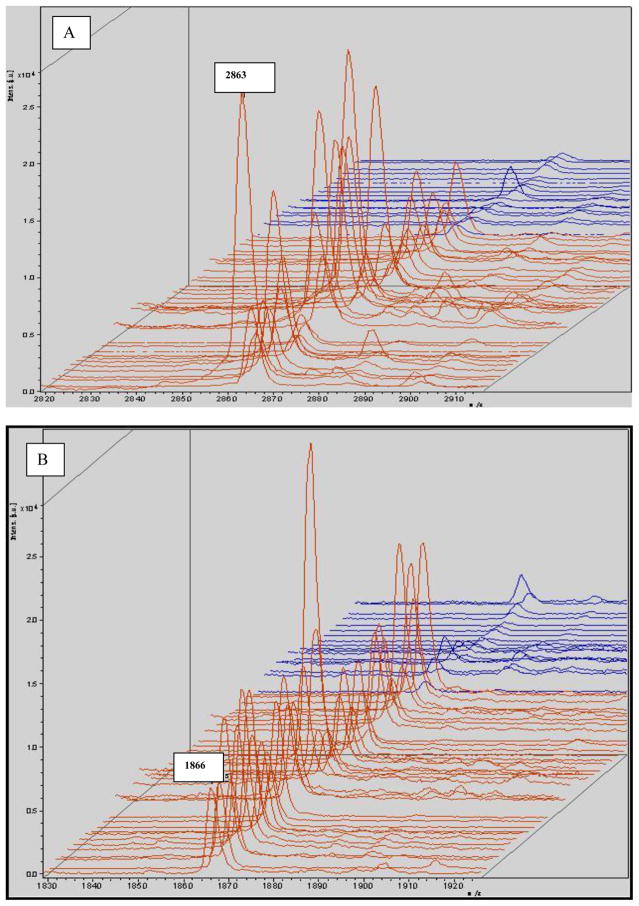
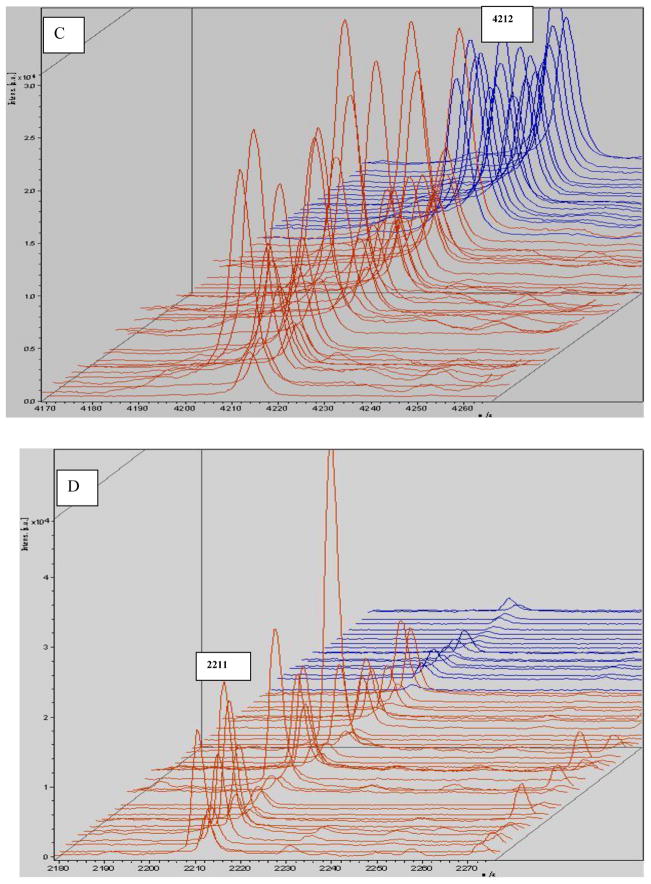
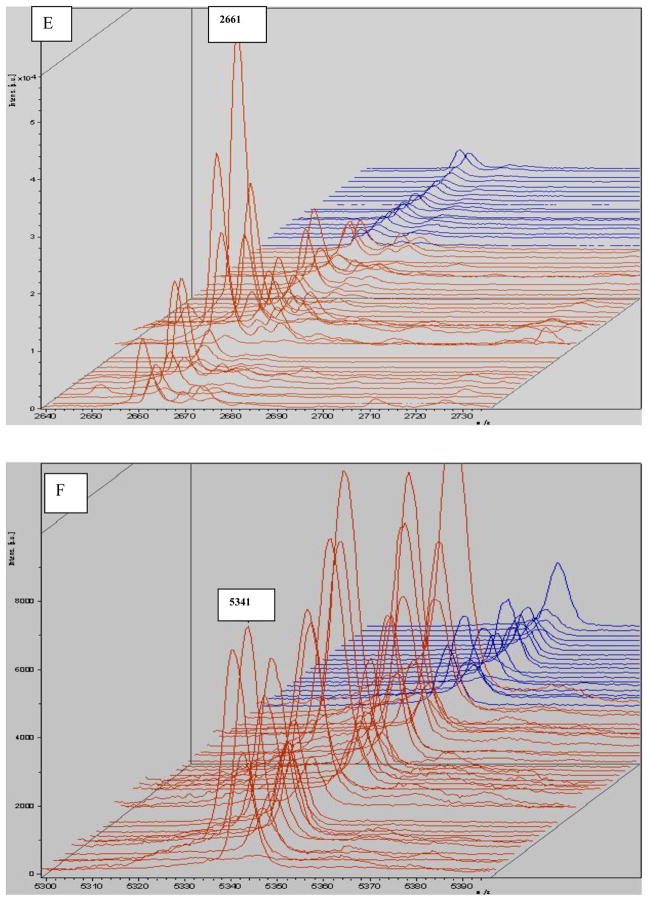
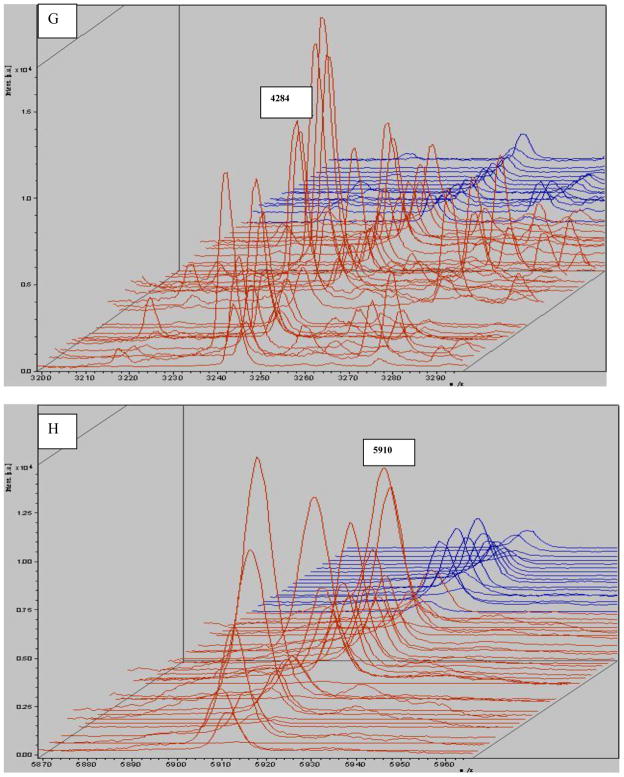
Allowing for some peaks was selected directly by the Flexanalysis analysis; the same spectra were imported into Flexanalysis and the eight significant peaks derived from PCA were visualized in the stack view (Fig 5).
Figure 5.
MALDI-TOF mass spectral stack view of selected peaks derived from the original profile according to PCA analysis. The monoisotopic mass (m/z) is shown for each peptide ion peak (A: m/z 2863; B: m/z 1866; C: m/z 4212; D: m/z 2211; E: m/z 2661; F: m/z 5341; G: m/z 4284; H: m/z 5910). Eight peptides were selected to illustrate group-specific differences in normalized intensities. Seven of those were up-regulated. The exception was m/z4212, which was down-regulated. Red: gastric cancer; blue: control.
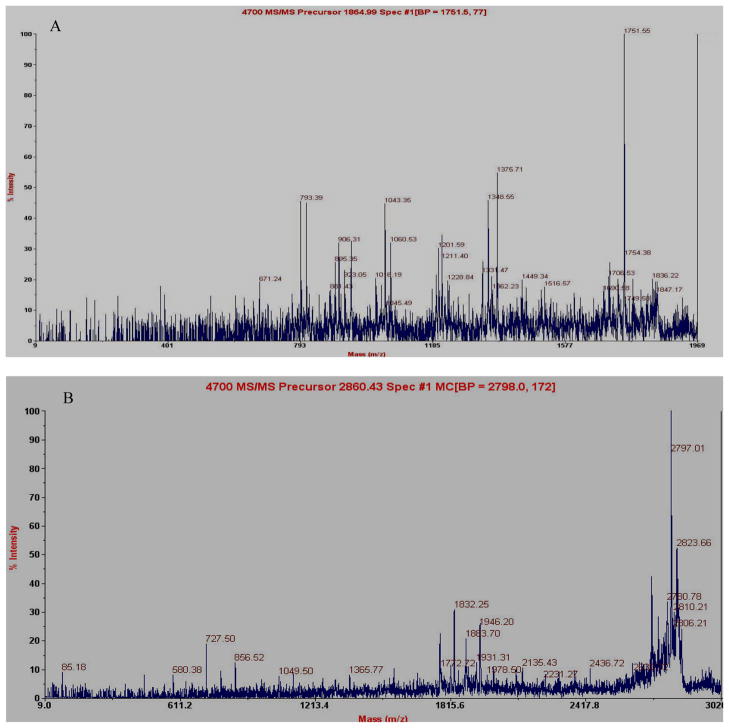
MALDI MS/MS technology was used to identify the m/z 1866 and 2863 peaks. These were shown to derive from the complement component of C3 (SSKITHRIHWESASLL) and from apolipoprotein A1(K.VSFLSALEEYTKKLNTQ), respectively (Fig 6).
Figure 6.
MALDI-TOF MS/MS Identification of serum peptide 1866 and 2863 as the fragment of complement component 3 and apolipoprotein A1, respectively. The fragments shown here were taken from a Mascot MS/MS search of the human segment of NR database that retrieved a sequence A:(SSKITHRIHWESASLL) and B: (K.VSFLSALEEYTKKLNTQ), respectively.
The within-day reproducibility of the serum spectral profiles was evaluated with the data. Variability was calculated to be between 6% and 12% with an average CV of 9%. The inter-day reproducibility study, including sample processing and mass spectral analysis, was conducted on three different days. Inter-day variability was calculated to be between 9% and 15%, with an average CV of 12%.
4. Discussion
In Clinprot-Tools software, a subset of relevant peaks was selected to establish clusters and to build a model using the intensities of those peaks. The data were analyzed using more and more complicated statistical algorithms; some of them explored independently of the MALDI machine[25,26]. The improvement of algorithms brought a high recognition rate, but ignored usefully differentiated peaks that may represent a potential biomarker[27,28]. Furthermore, the whole profile, which comprises too many subtly differentiated peaks, is inconvenient for clinical use in that the profile peaks are quantitative. It is therefore necessary to find a mini-optimized profile comprising fewer peaks than the original using a simple statistical algorithm. For this purpose, principle component analysis (PCA) in Clinprot-Tools software was used to generate a mini-profile and select the potential biomarker peaks.
A group of samples were selected randomly to form the training set and the result was demonstrated on the image of PCA. From the dimensional view of the first three loading values model from PCA (Loading1, Loading2, Loading3) (Fig 3), eight black dots standing for the different m/z peaks were selected as the mini-profile peaks according to loading values and SC values (Table 1), respectively. The most significant peaks were identified by the TC values. Remarkably, in the algorithm of PCA, the most substantial peak was m/z 4212 (TC=47.33, amplified 100-fold) (Table 1). Meanwhile, its p value showed a significant difference according to the t-test, which indicated the consistency of two sets of algorithm to a certain extent. However, the peak at m/z 4212 was third in the list of p values in the comparison of eight peaks and even lower in the 53 differentiated peaks. This phenomenon indicated that m/z 4212 possesses different significance between the algorithm of t-test and PCA. In general, a peak in the first position in the list of p value may be the most significant difference peak. In fact, the weight of the peak was dependent on the ability of classification of peak group itself. So, a comparative experiment of peak-weight was carried out with the first two peaks derived from t-test and PCA, respectively. The effect on detection of peak-weight is shown in Fig. 4. The first two substantial peaks derived from PCA gave a better classification than those derived from the p values. This indicated that the differential peaks obtained from PCA possessed much better classification ability than those from t-test. A simple explanation may be that the PCA algorithm referred more factors than t-test, such as down-regulation (AVE value, Table 2) of m/z 4212, the most differential peak in PCA, which was given a greater weighting than the other peaks in the analysis of PCA. Comparing with t-test and PCA, all the p values of the selected eight peaks were matched to significant differences in the visual comparison using Flexanalysis software, except for m/z 4212, which may be discarded in the Flexanalysis because it showed less difference in protein expression (Fig 5, m/z 4212). Hence, one cannont select the peak with Flexanalysis only. Additionally, eight peaks derived from PCA for the mini-profile had a corresponding visual image in the Flexanalysis, but not every peak derived from p values ( p<0.05) could be found in the Flexanalysis.
In brief, PCA generated the substantial peaks constituting the mini-optimized profile. The number of these peaks (n=8) was lower than from the p values (n=53) and easy to analyze in view of the small scale of the peaks. It was a better method than that based on p values, where too many peaks were significantly different (p<0.05). Sometimes it was difficult to determine the most likely potential biomarker, though the peak in the first position in the p value list may traditionally be considered the most valuable. To solve this problem, PCA gave the optimum choice to select the most valuable peak to be the potential biomarker according to the TC value. Therefore PCA was the first choice for the analysis of spectral data.
On further examination of the peaks of interest, m/z 1866 and 2863 were identified as deriving from complement component C3 and from Apolipoprotein A1, respectively. In the human complement system (C), C3 is the core component that interacts with at least 25 different proteins to protect an individual; e.g. xenografts and microbial pathogens. To produce the functional component, C3 is cleaved into C3a and C3b fragments which mediate target cell lysis[29]. In fact, C3a or C3b are such substantial fragments in the serum that they are commonly identified by SELDI. In this study, the m/z 1866 extracted by MALDI (this was precisely the advantage of MALDI) was also determined as C3, which was consistent with the belief that small C3 fragments are degraded into a sequence ladder by exoproteases. In additional, the sample used for MALDI was serum, not plasma, which excludes the possibility of heparin-induced complement activation [30]. The human complement system is regarded as an important defense against malignant cells in early stage cancer, but the further molecular mechanism is unknown. A previous study showed that the complement concentration increases in a patient with digestive tract cancer, which indicates that C3 participates in cancer pathology.
An interesting phenomenon was observed in our relevant study. The peak at m/z 1866 was more highly expressed in gastric cancer patients than in healthy controls in the original MALDI profiles. After operation, m/z 1866 was down-regulated, indicating decreased complement activation and metabolism. A possible explanation is that the removal of tumor tissue leads to less inflammatory factor release and hence to decreased complement activation (sample collection after operation 1 day). There was a contrary change in m/z 2863, which was identified as apolipoprotein A1 (apoAI). This peak was up-regulated in the post-operative serum and Apolipoprotein AI, a 243 aa polypeptide chain, is the principal protein constituent of high density lipoproteins and plays a key role in human cholesterol homeostasis. Epidemiological studies have shown that high density lipoprotein (HDL) and its major protein component, apolipoprotein AI, are protective against atherosclerosis and coronary artery disease. It is generally accepted that HDL removes unesterified (free) cholesterol (FC) and other lipids from peripheral cells and delivers them to the liver for catabolism. Along this reverse cholesterol transport pathway, apolipoprotein AI can exist in multiple conformations related to its degree of lipid association[31]. For the alteration of apolipoprotein A1, a possible hypothesis was that the need for recovery against the trauma of operation resulted in increased apolipoprotein A1.
In summary, the statistical method of principal component analysis (PCA) offered the opportunity to establish a mini-optimized profile in MALDI-TOF MS. The peaks derived from PCA comprehensively reflected the characteristics of data from MALDI. The determination of a potential biomarker peak by PCA was an important clue for further study.
Acknowledgments
This work was supported by the Ministry of Science and Technology of China (2006FY230300) and a Beijing Capital Development grant (2007-2043) and NIH grant (5R GM62077-3).
References
- 1.Lo LH, Huang TL, Shiea J. Acid hydrolysis followed by matrix-assisted laser desorption/ionization mass spectrometry for the rapid diagnosis of serum protein biomarkers in patients with major depression. Rapid Commun Mass Spectrom. 2009;23(5):589–598. doi: 10.1002/rcm.3908. [DOI] [PubMed] [Google Scholar]
- 2.Huang Z, Shi Y, Cai B, Wang L, Wu Y, Ying B, Qin L, Hu C, Li Y. Rheumatology (Oxford) 2009;48(6):626–631. doi: 10.1093/rheumatology/kep058. http://rheumatology.oxfordjournals.org/content/48/6/626.abstract . [DOI] [PubMed]
- 3.Ressom HW, Varghese RS, Goldman L, An Y, Loffredo CA, Abdel-Hamid M, Kyselova Z, Mechref Y, Novotny M, Drake SK, Goldman R. Analysis of MALDI-TOF mass spectrometry data for discovery of peptide and glycan biomarkers of hepatocellular carcinoma. J Proteome Res. 2008;7(2):603–610. doi: 10.1021/pr0705237. [DOI] [PMC free article] [PubMed] [Google Scholar]
- 4.Pietrowska M, Marczak L, Polanska J, Behrendt K, Nowicka E, Walaszczyk A, Chmura A, Deja R, Stobiecki M, Polanski A, Tarnawski R, Widlak P. Mass spectrometry-based serum proteome pattern analysis in molecular diagnostics of early stage breast cancer. J Transl Med. 2009;7:60. doi: 10.1186/1479-5876-7-60. [DOI] [PMC free article] [PubMed] [Google Scholar]
- 5.Qiu F, Liu HY, Dong ZN, Feng YJ, Zhang XJ, Tian YP. Searching for Potential Ovarian Cancer Biomarkers with Matrix-Assisted Laser Desorption/Ionization Time-of-Flight Mass Spectrometry. Am J Biomed Sci. 2009;1(1):80–90. doi: 10.5099/aj090100080. [DOI] [PMC free article] [PubMed] [Google Scholar]
- 6.Penno MA, Ernst M, Hoffmann P. Optimal preparation methods for automated matrix-assisted laser desorption/ionization time-of-flight mass spectrometry profiling of low molecular weight proteins and peptides. Rapid Commun Mass Spectrom. 2009;23(17):2656–2662. doi: 10.1002/rcm.4167. [DOI] [PubMed] [Google Scholar]
- 7.Karbassi ID, Nyalwidhe JO, Wilkin sCE, Cazares LH, Lance RS, Semmes OJ, Drake RR. Proteomic expression profiling identification of serum proteins using immobilized trypsin beads with MALDI-TOF/TOF. J Proteome Res. 2009;8(9):4182–92. doi: 10.1021/pr800836c. [DOI] [PubMed] [Google Scholar]
- 8.Gatlin-Bunai CL, Cazares LH, Cooke WE, Semmes OJ, Malyarenko DI. Optimization of MALDI-TOF MS detection for enhanced sensitivity of affinity-captured proteins spanning a 100 kDa mass range. J Proteome Res. 2007;6(11):4517–4524. doi: 10.1021/pr0703526. [DOI] [PMC free article] [PubMed] [Google Scholar]
- 9.Bruegel M, Planert M, Baumann S, Focke A, Bergh FT, Leichtle A, Ceglarek U, Thiery J, Fiedler GM. Standardized peptidome profiling of human cerebrospinal fluid by magnetic bead separation and matrix-assisted laser desorption/ionization time-of-flight mass spectrometry. J Proteomics. 2009;72(4):608–615. doi: 10.1016/j.jprot.2008.11.018. [DOI] [PubMed] [Google Scholar]
- 10.Fiedler GM, Leichtle AB, Kase J, Baumann S, Ceglarek U, Felix K, Conrad T, Witzigmann H, Weimann A, Schütte C, Hauss J, Büchler M, Thiery J. Serum peptidome profiling revealed platelet factor 4 as a potential discriminating Peptide associated with pancreatic cancer. Clin Cancer Res. 2009;15(11):3812–3809. doi: 10.1158/1078-0432.CCR-08-2701. [DOI] [PubMed] [Google Scholar]
- 11.Timms JF, Cramer R, Camuzeaux S, Tiss A, Smith C, Burford B, Nouretdinov I, Devetyarov D, Gentry-Maharaj A, Ford J, Luo Z, Gammerman A, Menon U, Jacobs I. Peptides generated ex vivo from serum proteins by tumor-specific exopeptidases are not useful biomarkers in ovarian cancer. Clin Chem. 2010;56(2):262–271. doi: 10.1373/clinchem.2009.133363. [DOI] [PubMed] [Google Scholar]
- 12.Pitteri SJ, Hanash SM. Proteomic approaches for cancer biomarker discovery in plasma. Expert Rev Proteomics. 2007;4(5):589–590. doi: 10.1586/14789450.4.5.589. [DOI] [PubMed] [Google Scholar]
- 13.Diamandis EP. Oncopeptidomics: a useful approach for cancer diagnosis? Clin Chem. 2007;53(6):1004–1006. doi: 10.1373/clinchem.2006.082552. [DOI] [PubMed] [Google Scholar]
- 14.Diamandis EP, van der Merwe DE. Plasma protein profiling by mass spectrometry for cancer diagnosis: opportunities and limitations. Clin Cancer Res. 2005;11(3):963–965. [PubMed] [Google Scholar]
- 15.Gillette MA, Mani DR, Carr SA. Place of pattern in proteomic biomarker discovery. J Proteome Res. 2005;4(4):1143–1154. doi: 10.1021/pr0500962. [DOI] [PubMed] [Google Scholar]
- 16.Conrads TP, Hood BL, Issaq HJ, Veenstra TD. Proteomic patterns as a diagnostic tool for early-stage cancer: a review of its progress to a clinically relevant tool. Mol Diagn. 2004;8(2):77–85. doi: 10.1007/BF03260049. [DOI] [PubMed] [Google Scholar]
- 17.Findeisen P, Neumaier M. Mass spectrometry-based clinical proteomics profiling: current status and future directions. Expert Rev Proteomics. 2009;6(5):457–459. doi: 10.1586/epr.09.67. [DOI] [PubMed] [Google Scholar]
- 18.Hortin GL. The MALDI-TOF mass spectrometric view of the plasma proteome and peptidome. Clin Chem. 2006;52(7):1223–1237. doi: 10.1373/clinchem.2006.069252. [DOI] [PubMed] [Google Scholar]
- 19.Ressom HW, Varghese RS, Abdel-Hamid M, Eissa SA, Saha D, Goldman L, Petricoin EF, Conrads TP, Veenstra TD, Loffredo CA, Goldman R. Analysis of mass spectral serum profiles for biomarker selection. Bioinformatics. 2005;21(21):4039–4045. doi: 10.1093/bioinformatics/bti670. [DOI] [PubMed] [Google Scholar]
- 20.Yasui Y, Pepe M, Thompson ML, Adam BL, Wright GL, Qu Y, Potter JD, Winget M, Thornquist M, Feng Z. A data-analytic strategy for protein biomarker discovery: profiling of high-dimensional proteomic data for cancer detection. Biostatistics. 2003;4(3):449–463. doi: 10.1093/biostatistics/4.3.449. [DOI] [PubMed] [Google Scholar]
- 21.Li J, Orlandi R, White CN, Rosenzweig J, Zhao J, Seregni E, Morelli D, Yu Y, Meng XY, Zhang Z, Davidson NE, Fung ET, Chan DW. Independent validation of candidate breast cancer serum biomarkers identified by mass spectrometry. Clin Chem. 2005;51(12):2229–2235. doi: 10.1373/clinchem.2005.052878. [DOI] [PubMed] [Google Scholar]
- 22.Callesen AK, Madsen JS, Vach W, Kruse TA, Mogensen O, Jensen ON. Serum protein profiling by solid phase extraction and mass spectrometry: a future diagnostics tool? Proteomics. 2005;9(6):1428–1441. doi: 10.1002/pmic.200800382. [DOI] [PubMed] [Google Scholar]
- 23.Villanueva J, Nazarian A, Lawlor K, Tempst P. Monitoring peptidase activities in complex proteomes by MALDI-TOF mass spectrometry. Nat Protoc. 2009;4(8):1167–1183. doi: 10.1038/nprot.2009.88. [DOI] [PMC free article] [PubMed] [Google Scholar]
- 24.Han H. Nonnegative principal component analysis for mass spectral serum profiles and biomarker discovery. BMC Bioinformatics. 2010;11(Suppl 1):S1. doi: 10.1186/1471-2105-11-S1-S1. [DOI] [PMC free article] [PubMed] [Google Scholar]
- 25.Cao Y, Wang N, Ying X, Li A, Wang H, Zhang X, Li W. BioSunMS: a plug-in-based software for the management of patients information and the analysis of peptide profiles from mass spectrometry. BMC Med Inform Decis Mak. 2009;9:13. doi: 10.1186/1472-6947-9-13. [DOI] [PMC free article] [PubMed] [Google Scholar]
- 26.Wang QT, Li YZ, Liang YF, Hu CJ, Zhai YH, Zhao GF, Zhang J, Li N, Ni AP, Chen WM, Xu Y. Construction of a multiple myeloma diagnostic model by magnetic bead-based MALDI-TOF mass spectrometry of serum and pattern recognition software. Anat Rec (Hoboken) 2009;292(4):604–610. doi: 10.1002/ar.20871. [DOI] [PubMed] [Google Scholar]
- 27.Listgarten J, Emili A. Statistical and computational methods for comparative proteomic profiling using liquid chromatography-tandem mass spectrometry. Mol Cell Proteomics. 2005;4(4):419–434. doi: 10.1074/mcp.R500005-MCP200. [DOI] [PubMed] [Google Scholar]
- 28.Fung ET, Enderwick C. ProteinChip clinical proteomics: computational challenges and solutions. Biotechniques. 2002;(Suppl 34–38):40–41. [PubMed] [Google Scholar]
- 29.Fischer WH, Hugli TE. Regulation of B cell functions by C3a and C3a(desArg): suppression of TNF-alpha, IL-6, and the polyclonal immune response. J Immunol. 1997;159(9):4279–4286. [PubMed] [Google Scholar]
- 30.Koomen JM, Li D, Xiao LC, Liu TC, Coombes KR, Abbruzzese J, Kobayashi R. Direct tandem mass spectrometry reveals limitations in protein profiling experiments for plasma biomarker discovery. J Proteome Res. 2005;4(3):972–981. doi: 10.1021/pr050046x. [DOI] [PubMed] [Google Scholar]
- 31.Davidson WS, Hazlett T, Mantulin WW, Jonas A. The role of apolipoprotein AI domains in lipid binding. Proc Natl Acad Sci U S A. 1996;93(24):13605–13610. doi: 10.1073/pnas.93.24.13605. [DOI] [PMC free article] [PubMed] [Google Scholar]


