

Abstract
A central challenge in motility research is to quantitatively understand how numerous molecular building blocks self-organize to achieve coherent shape and movement on cellular scales. A classic example of such self-organization is lamellipodial motility in which forward translocation is driven by a treadmilling actin network. Actin polymerization has been shown to be mechanically restrained by membrane tension in the lamellipodium. However, it remains unclear how membrane tension is determined, what is responsible for retraction and shaping of the rear boundary, and overall how actin-driven protrusion at the front is coordinated with retraction at the rear. To answer these questions, we utilize lamellipodial fragments from fish epithelial keratocytes which lack a cell body but retain the ability to crawl. The absence of the voluminous cell body in fragments simplifies the relation between lamellipodial geometry and cytoskeletal dynamics. We find that shape and speed are highly correlated over time within individual fragments, whereby faster crawling is accompanied by larger front-to-rear lamellipodial length. Furthermore, we find that the actin network density decays exponentially from front-to-rear indicating a constant net disassembly rate. These findings lead us to a simple hypothesis of a disassembly clock mechanism in which rear position is determined by where the actin network has disassembled enough for membrane tension to crush it and haul it forward. This model allows us to directly relate membrane tension with actin assembly and disassembly dynamics and elucidate the role of the cell membrane as a global mechanical regulator which coordinates protrusion and retraction.
Keywords: cell motility, keratocyte fragments
Understanding the large-scale coordination of molecular processes into coherent behavior at the cellular level is one of the central challenges in cell biology. Actin-based motility involves numerous molecular players with complex interactions (1) that span a wide-range of scales from the molecular level to the cellular one. Despite substantial progress in characterizing the molecular details involved (2), we still do not understand the remarkable self-organization of these molecular components into a moving cell. The complex interplay between biochemical reactions and biophysical forces plays a central role in this self-organization. In particular, the mechanical feedback between the cell membrane and the dynamic actin network has been shown to have a substantial effect on cell protrusion (3, 4), and a significant role in coordinating protrusion over cellular scales (5, 6). However, quantitative understanding of the coupling between the cell membrane and the motility machinery is still lacking; it is unknown what determines membrane tension and how membrane tension is related to the protrusion and retraction dynamics. Elucidating this dynamic interplay is essential for understanding how overall cell morphology and movement emerge from the underlying molecular processes.
Fish epithelial keratocytes are widely used for studying the dynamics of the motility process (5, 7–10); they are one of the fastest moving animal cells with average speeds of up to 1 μm/s, yet their motion is extremely persistent with hardly any change in cell shape, speed, or direction over many minutes. Keratocytes, as well as other motile cell types (11), can spontaneously detach cytoplasmic fragments which move with speed and persistence similar to whole-cells (12–14). These lamellipodial fragments, which lack nuclei, microtubules, and most organelles, are likely the simplest natural model system for studying actin-based cell motility. As such, this system has been used to gain insight into the minimal requirements for establishing polarity in motile cells (12, 13). Here we utilize this simplified model system to study how the interplay between actin dynamics and the plasma membrane lead to shape and movement of the lamellipodium as a whole. The lack of a cell body in fragments facilitates measurements of geometry and movement of the rear boundary, allowing us to focus on the important question of how retraction at the rear is coordinated with protrusion at the front.
We combine experimental characterization and modeling and propose a self-consistent biophysical model of the lamellipodial motility module. We show that membrane tension mechanically couples edge dynamics along the cell boundary; at the rear, membrane tension provides the force needed for retraction and actin network disassembly, whereas a force balance between actin polymerization and membrane tension shapes the leading edge (5). Overall, our model explains in a quantitative and self-consistent manner how global shape and speed of the lamellipodium emerge from the underlying dynamics of the actin treadmill within an inextensible membrane bag, and provides values for membrane tension as an output of the model rather than incorporating tension as an input parameter.
Results
Keratocyte Fragments as a Model System for Lamellipodial Motility.
Lamellipodial fragments are naturally produced at low frequency in keratocyte cultures and remain viable for hours. By inducing fragment formation (see Materials and Methods), a large population of fragments can be obtained from primary keratocyte cultures (Fig. 1). The fragment population exhibits substantial morphological variability, similar to that seen in a population of whole-cells (5) (Fig. 1A). The spectrum of shapes can be described to a large extent (∼90%) by two orthogonal shape modes (Fig. 1B). Roughly, these modes can be described as measuring the projected area (mode 1), and the front-to-rear lamellipodial length (mode 2). Fragments are typically smaller than cells, and their movement is somewhat slower (Fig. S1).
Fig. 1.

Fragment shape and movement resembles that of whole keratocytes. (A) Phase-contrast images of live fragments (Top) and whole keratocytes (Bottom) are shown. Fragments exhibit a similar spectrum of lamellipodial shape variation as cells. (B) The first two principal modes of shape variation, as determined by principal components analysis of aligned outlines of 122 live fragments (Top) and 148 cells (Bottom), are shown. Essentially the same modes—cell area (Mode 1) and front-to-rear lamellipodial length (Mode 2)—are found for both fragments and cells. These two modes capture approximately 90% of the shape variation in the populations. For each mode, the mean cell shape is shown together with reconstructions of shapes one and two standard deviations away from the mean in each direction along the given mode. The variation accounted for by each mode is indicated.
The actin network organization in fragments (13, 14) is similar to that found in whole keratocytes (5, 9). Along the leading edge, the actin filament density is peaked at the center and decreases toward the sides (Fig. 2 A and B) as in cells (5, 8). Perpendicular to the leading edge, the network density is highest near the leading edge and decreases approximately exponentially toward the rear (Fig. 2C) (13, 14). Measurements of the actin network dynamics in fragments using quantitative fluorescent speckle microscopy (15) show that the network is nearly stationary in the lab frame of reference, and hence flows rearward in the cell frame of reference (Fig. 2 D–E, Movie S1). Similar flow patterns were observed in whole keratocytes, with the important difference that in whole-cells a myosin II-dependent inward actin flow was prominent near the rear boundary (7, 16). This difference is likely due to the higher quantity of myosin II in cells (9) compared to fragments (13), which are typically generated from lamellipodia that are relatively poor in myosin (9). Importantly, myosin appears to be dispensable for steady-state fragment motility as myosin inhibition with blebbistatin has essentially no effect on fragment shape or speed (Fig. 2F).
Fig. 2.

Actin organization and dynamics in fragments. (A) A fluorescence image of a fragment which was fixed and stained with fluorescent phalloidin to visualize actin filament distribution. (B–C) The filament distribution was measured for a population of fixed fragments (N = 115). Data for individual fragments normalized to the mean intensity within that fragment (gray lines) is shown together with the population average (black). (B) The actin filament density profile along the leading edge (Top) and trailing edge (Bottom) are shown. The intensity is plotted as a function of the relative position along the boundary. The filament density along the leading edge is peaked at the center, whereas the density along the trailing edge is essentially flat. (C) The density along a cross section perpendicular to the leading edge is plotted as a function of the normalized distance from the leading edge (front-to-rear distance = 1). The actin filament density is peaked near the leading edge and decreases toward the rear. (D) Phase-contrast and fluorescence images of a fragment labeled with low levels of fluorescent phalloidin (Movie S1). (E) Actin network flow maps obtained by fluorescent speckle microscopy for the fragment shown in D are depicted in the lab frame of reference (Top) and in the cell frame of reference (Bottom). The magnitude of the flow is indicated by both the length and the color of the flow vectors. The actin network is nearly stationary in the lab frame of reference, and exhibits rearward flow within the lamellipodium in the cell frame of reference. (F) Myosin inhibition by blebbistatin has little effect on fragment shape and speed. The average shape and speed for a population of fragments (N = 40) before and after treatment with blebbistatin are depicted. (G) A phase-contrast image (Upper Left) from a time-lapse movie of a live fragment and a fluorescence image (Lower Left) of the same fragment after fixation and phalloidin staining are shown (Movie S2). The actin network density along a cross section from front-to-rear (Right) is well-fit by an exponential function with the decay length as a fit parameter. The characteristic actin disassembly time (equal to the model parameter τ) is measured as the ratio between the decay length of the actin density and fragment speed. (H) A histogram of the characteristic actin disassembly times measured as in G for a population of fragments (N = 11).
Together, the observations that (i) the actin network density decays approximately exponentially as a function of distance from the leading edge, and (ii) the actin network remains nearly stationary with respect to the substrate, imply that the treadmilling actin network exhibits net disassembly at a constant rate per unit time (SI Text). We measure this disassembly rate by combining time-lapse microscopy of live fragments with rapid fixation and staining of the actin network within the same fragments (Fig. 2 G and H, Movie S2). The disassembly time is equal to the ratio between the decay length of the actin density from front-to-rear (Fig. 2G) and fragment speed. We find an average disassembly time of 30 ± 12 s (mean ± standard deviation, N = 11; Fig. 2H), which is comparable with the relevant data for cells (17). The disassembly time varies widely (over threefold) between different fragments (Fig. 2H), likely reflecting cell-to-cell variability in the concentration of proteins such as actin depolymerizing factor (ADF)/cofilin involved in actin disassembly.
Different cells or fragments may possess varying amounts of specific proteins, lipids, or other materials, but the biochemical and biophysical rules governing the interactions of those constituents are the same. Thus, characterization of the natural phenotypic variation across a population reveals the spectrum of possible functional states of the system, and has led to substantial insights into the mechanism of shape determination in motile keratocytes (5, 8). However, variation within a population (e.g., in the actin disassembly rate as shown above) can mask important correlations. In particular, although speed is perhaps the most fundamental characteristic of motile cells, previous work failed to find a tight connection between speed and morphology. To overcome this difficulty we focus on variations within individual fragments over time. We expect the biochemical composition of fragments to remain nearly constant on the relatively short timescales considered here (seconds to several minutes). The extent of variation in speed and morphology in fragments during this time frame is substantially smaller than the variation within a population (Fig. S2). Nonetheless, as shown below, following the dynamics within individual fragments and in particular the correlation between speed and morphology over time allows us to gain unique insight into the system, regardless of the cell-to-cell variability.
Fragment Shape and Speed Vary in a Correlated Manner over Time.
To identify characteristic features in individual fragments that correlate with motility, we use high-resolution time-lapse microscopy (Movies S3 and S4) to quantify the morphology and speed of motile fragments over time. We find that the area of individual fragments remains remarkably stable over time (Fig. S2), suggesting that the total area of the plasma membrane is constant and that the membrane is stretched taut by the expanding actin network. This notion is further supported by perturbation experiments in which fragments are treated with high osmolarity medium and their area remains unchanged (Fig. S3).
Importantly, we find that speed and front-to-rear lamellipodial length are strongly correlated within individual fragments over time (Fig. 3): As fragments slow down their front-to-rear distance decreases, whereas faster movement is accompanied by larger front-to-rear distance. Furthermore, we find that changes in leading edge protrusion speed precede changes in the front-to-rear distance by a few seconds, whereas changes in the speed of the trailing edge tend to follow changes in the front-to-rear distance (Fig. 3D). Similar correlations are observed in whole keratocytes (Fig. S4), indicating that the same mechanisms govern movement of fragments and cells.
Fig. 3.

Fragment shape and speed vary in a correlated manner. Forty-five fragments were followed over > 10 min at 3 s time intervals. Data is shown for two typical fragments (Movies S3 and S4). (A) Phase-contrast images of the fragments. (B) Traces of the front-to-rear distance and speed over time for both fragments show clear temporal correlation. (C) Scatter plots of speed as a function of front-to-rear distance for the two fragments are shown. Larger front-to-rear distance correlates with faster movement. (D) The normalized cross-covariance between the front-to-rear distance and the speed of the leading edge (Top) and between the front-to-rear distance and the speed of the trailing edge (Bottom) are depicted as a function of time lag for individual fragments (gray lines). The mean cross-covariance functions averaged over all 45 fragments are also shown (black lines).
The correlation between front-to-rear lamellipodial length and speed is suggestive of an actin disassembly clock mechanism (18) in which the front-to-rear distance is defined by the time needed for the actin network to disassemble to the point where membrane tension can crush the weakened network at the rear. According to this model the front-to-rear distance will scale as fragment speed multiplied by the time needed for sufficient network disassembly, so the front-to-rear distance is predicted to correlate with speed (Fig. 3 B and C). Furthermore, changes in front-to-rear distance are expected to follow changes in actin assembly (and hence speed) at the leading edge, whereas the rear is expected to react to these changes with a delay, as observed (Fig. 3D). As described below, the actin disassembly clock model can be formulated mathematically and yields a self-consistent set of equations that define fragment shape and speed as well as membrane tension.
Disassembly Clock Model Predicts Fragment Shape, Speed, and Membrane Tension.
We consider a treadmilling actin network within an inextensible membrane bag and assume local force balance between the forces imposed by the motility machinery from within and those generated by the surrounding membrane (Fig. 4). Because membrane tension equilibrates rapidly, we assume that tension is spatially homogenous along the boundary (5, 19). The lamellipodial rear is defined by where the force needed to retract the rear is equal to the force generated by membrane tension. We make the simplest assumptions that the resistance to rear retraction is mainly due to the actin network and that the strength of the actin network is proportional to its density. Under these assumptions, the force needed to retract the rear boundary is linearly proportional to the local network density there. Along the leading edge, the force imposed by the membrane is distributed locally among the pushing filaments (4), so the load force per filament is equal to the tension divided by the local filament density (5). The value of the membrane tension is a dynamic variable which depends on the spatio-temporal organization of the actin network and at the same time influences it. At steady-state, the membrane tension is determined self-consistently by the system.
Fig. 4.

The disassembly clock model. (A) A schematic illustration of the two-dimensional disassembly clock model. Membrane tension generates a constant force per unit length along the perimeter. At the front corners, the force per filament, which is equal to the membrane tension divided by the local filament density, reaches the stall force. Along the rear boundary, the force needed to crush the network is equal to the membrane tension. (B) Speed as a function of time is depicted for the fragment shown in Fig. 2G (gray points). The data is well-fit by the model prediction, 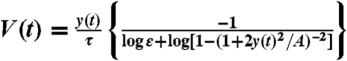 , using the measured actin disassembly time τ and area A for this fragment (black line). The data and model prediction are smoothed with σ = 6 s and the best-fit ε is determined for each fragment. (Inset) A histogram of the values of the model parameter ε obtained from fitting the speed as a function of time for individual fragments (N = 11) is shown. The mean value ε ∼ 0.3 agrees with an independent estimate for ε extracted from the actin distribution in fixed fragments (Fig. S7). (C) The effect of jasplakinolide treatment on fragments. The speed and front-to-rear displacement time (equal to the front-to-rear distance divided by speed) are depicted as a function of time for a fragment before and after adding jasplakinolide to the media. As predicted by the disassembly clock model, the front-to-rear displacement time, which is nearly constant prior to the perturbation, increases following the addition of jasplakinolide to the media, whereas speed decreases in response to the perturbation. (Inset) The mean shape of the fragment before and after treatment (averaged over 5 min). Similar results were obtained for four different jasplakinolide-treated fragments.
The disassembly clock model can be made quantitative by coupling the force-density relations for actin polymerization at the leading edge and disassembly at the rear (Fig. 4, SI Text). We consider a two-dimensional model, denoting the front-to-rear distance (at the center) y and the side-to-side distance 2x (Fig. 4A). Because fragments are approximately rectangular, we estimate the total length of the front and sides of the leading edge by 2L = 2(x + y) and area by A = 2xy. The actin filament density along the leading edge has an approximately parabolic distribution, peaked at the center (Fig. 2B, Fig. S5). Thus, we express the filament density distribution by B(l) = BC(1 - l2/L2), where l is the position along the leading edge (l = 0 at the center) and BC is the actin filament density at the center of the leading edge (5, 8, 20). We assume that the front corners, which form the boundary between the protruding leading edge and the stalled sides, are defined by where the load force per filament reaches the stall force for polymerization (21). The force imposed by the membrane tension, T, is then equal to the stall force per filament multiplied by the filament density at the corners (5): T = fstallB(x). We can express this force balance by an equation relating cell geometry (front-to-rear distance, y) and mechanics (membrane tension, T):
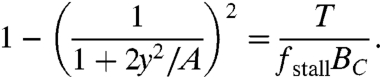 |
[1] |
Both the front-to-rear distance and membrane tension are unknown variables in Eq. 1. We obtain another independent relation between these two variables by considering the force balance at the rear. The actin network disassembles at a constant rate 1/τ, where τ is the characteristic disassembly time. For a fragment moving at a speed V, the constant disassembly rate translates into an exponential decrease in filament density as a function of distance from the leading edge, s, so that: B(s) = BC exp(-s/Vτ) (SI Text). The rear edge is defined as where the membrane-imposed force reaches the threshold force per filament needed to crush the actin network (break filaments and/or detach crosslinking and adhesion proteins associated with them) denoted by k. The force balance relation at the rear boundary (s = y) is hence given by, T = kB(y), which can be rewritten as:
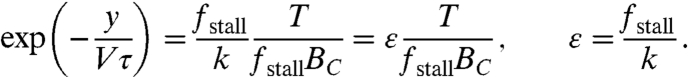 |
[2] |
Because membrane tension is uniform along the boundary (5, 19), the disassembly clock model predicts that the actin density along the rear edge will be approximately constant. Indeed, whereas the actin density profile along the leading edge is peaked, the measured profile along the rear boundary is flat (Fig. 2B), lending further support to the model. Note that an alternative model in which the rear boundary is shaped by a force balance between contractility of the actin-myosin bundle at the rear and membrane tension (19, 22) (Fig. S6) is inconsistent with our data: Myosin inhibition with blebbistatin leads to essentially no shape change and in particular no change in rear shape (Fig. 2F).
Together, Eq. 1 and Eq. 2 self-consistently determine both fragment shape and membrane tension. By combining them, we obtain an equation that determines the front-to-rear distance:
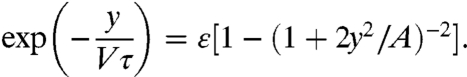 |
[3] |
The stall force per filament is expected to be smaller than the force required to break a filament, so we expect, 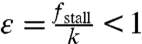 . Eq. 3 has a simple approximate solution for ε < < 1:
 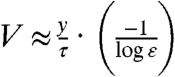 . More precisely we obtain
 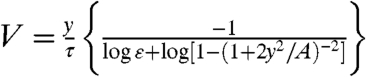 (SI Text). Fitting the last formula to the V vs. y time series for individual fragments, using the measured values for the area A and actin disassembly time τ for each fragment, gives excellent results and allows estimating ε in each fragment (Fig. 4B). We find that ε has a mean value of ε = 0.3 ± 0.15 (mean ± standard deviation, N = 11; see also Fig. S7), so we predict that the breaking force per filament is approximately three times greater than the stall force, which is approximately 2–3 pN (21). Furthermore, we can use the model to estimate the membrane tension in each fragment; taking typical values we find T ∼ 150–300 pN/μm (SI Text).
The disassembly clock model can be further tested by modifying actin dynamics in live cells with pharmacological agents and observing the concurrent changes in morphology and speed. Jasplakinolide is a cell-permeable drug which stabilizes actin filaments and slows their disassembly (23). Jasplakinolide-treated fragments exhibit a decrease in speed and an increase in the front-to-rear displacement time (y/V, i.e., the time it takes the front to reach the rear boundary) (Fig. 4C), as expected from the disassembly clock model for increased values of τ. Inhibition of the actin nucleator Arp2/3 (24) which decreases actin filament density at the leading edge leads to the expected reduction in speed (Fig. S8C). Arp2/3 inhibition also significantly slows down actin disassembly (Fig. S8 A and B), most likely due to the structural changes in the actin network. As a result, and in accordance with the disassembly clock model, we also observe an increase in the front-to-rear displacement time (Fig. S8C).
The detailed fragment shape, and in particular the curvature of the leading edge, can be predicted from the model if we incorporate a force-velocity relation for actin-network polymerization. Experimentally, we find that the leading edge curvature is highly correlated with the front-to-rear distance (Fig. 5, Fig. S4). Measurements of the force-velocity relation of protruding actin networks in the lamellipodium of motile keratocytes (25) have shown that protrusion is more sensitive to load at higher forces; at weak loads protrusion is nearly insensitive to force, whereas at greater loads, approaching the stall force, speed decreases rapidly. Specifically, we assume that the force-velocity relation is given by 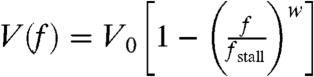 , where V0 is the free polymerization rate and w = 8. From the density distribution of actin filaments along the leading edge B(l), we can estimate the local force per filament f(l) = T/B(l). Based on the force-velocity relation, we obtain the local protrusion rate V(l), which according to the graded radial extension model (5, 10) defines the shape of the leading edge (SI Text). Qualitatively, larger front-to-rear distance correlates with an increase in the load force per filament due to membrane tension at the leading edge (Eq. 1). At larger front-to-rear distances and higher loads, the local protrusion rate becomes more sensitive to changes in the load force due to the laterally decreasing actin network density along the leading edge. According to the graded radial extension model (5, 10), this higher sensitivity implies that the curvature of the leading edge will increase. The model-predicted correlation between front-to-rear distance and curvature of the leading edge is in excellent agreement with the observed curvature-distance correlations both in a population and within individuals over time (Fig. 5C, Fig. S9).
Fig. 5.

The disassembly clock model predicts correlation between curvature of the leading edge and front-to-rear distance. (A) Traces of the front-to-rear distance and the curvature of the leading edge over time are depicted for the two fragments shown in Fig. 3A. The front-to-rear distance is correlated with the curvature of the leading edge. (B) The normalized cross-covariance between the front-to-rear distance and the front curvature is depicted as a function of time lag for individual fragments (gray lines), together with the mean cross-covariance function averaged over all 45 fragments (black line). (C) The normalized front curvature is shown as a function of the normalized front-to-rear distance. Normalization is done using the square root of fragment area as the length unit. Data is depicted for the time series of the two fragments shown in Fig. 3A (blue and green, respectively) and for a population of live fragments (gray). The data is well-fit by the predictions of the disassembly clock model (black lines).
Discussion
Through extensive analysis of the correlated behavior of individual fragments over time, we developed an essentially complete model of this autonomous motility module consisting of an actin network treadmilling within an inextensible membrane bag. The relative simplicity of fragments enabled us to reveal phenomena that are hidden or obscured in more complex model systems. Moreover, focusing on the behavior of individuals allowed us to observe correlations that would otherwise be masked by the natural cell-to-cell variability. Our self-consistent model couples global mechanical regulation by membrane tension with the self-organized dynamics of the actin network yielding testable predictions which are in quantitative agreement with our experimental results (Figs. 3–5).
Fragments exhibit actin assembly at the front and disassembly at a constant rate away from the leading edge. Shape and speed of the leading edge are determined by a force balance between the collective pushing of the polymerizing actin filaments and the load imposed by the membrane (Fig. S10A). At the sides, actin filament density is lower so protrusion is stalled by the membrane load. Finally, the actin network at the rear, weakened by disassembly processes and dissociation of various actin-binding and adhesion proteins, is crushed by membrane tension leading to rear retraction (Fig. S10B). Altogether, membrane tension, which is dynamically determined by the system, couples protrusion at the front with retraction at the rear with an actin disassembly clock setting the front-to-rear distance. Analogous actin dynamics with assembly at the front and disassembly at a constant rate characterize comet-tail motility (26) in which comet-tail length is proportional to speed due to a similar disassembly clock mechanism. However, in the absence of a surrounding membrane, the mechanical coupling between actin assembly and disassembly is lacking in comet tails.
The actin monomer concentration and the density of filaments at the leading edge are taken as constant model parameters. We speculate that the semioscillatory dynamics we observe in fragment shape and speed are related to changes in these parameters over time. In the SI Text we present a model which incorporates these parameters as dynamic variables and illustrates how lamellipodial shape and actin organization can self-organize and evolve into a unique stable asymmetric state. Future modeling should incorporate explicitly the spatio-temporal dynamics of actin assembly and disassembly processes, including actin filament nucleation, growth and capping, ADF-cofilin-induced filament breaking and Arp2/3 detachment, as well as thymosin and profilin monomer shuttling (2).
This work highlights the role of membrane tension in rear retraction, which naturally leads to mechanical coupling between retraction and protrusion. Myosin contraction can contribute to rear retraction as well as promote motility by enhancing actin disassembly (7) and inducing forward directed fluid flow (27). However, it is not required; knockouts and inhibition experiments have shown that although myosin II typically promotes movement and increases cell speed, it is not essential for motility in many cell types including keratocytes (5, 7, 27), Acanthamoeba (28), and Dictyostelium discoideum (29). Here we show that myosin II has a negligible role in rear retraction in keratocyte fragments (Fig. 2F). These results also imply that myosin is not essential for building a minimal actin-based artificial moving cell; membrane tension is sufficient for inducing rear retraction and coordinating protrusion and retraction.
Different combinations of redundant motility modules can explain all known modes of cell locomotion (30), and it is important to characterized each of these modules. We focus here on the basic actin treadmill in a membrane bag module which plays a central role in lamellipodial fragments and whole keratocytes (2, 9). Experimental evidence in more complex cells suggests that this basic module participates in their motile behavior as well: Switching off certain pathways converts the stubby and short uropod of Dictyostelium into a flat keratocyte-like rear (31), whereas the extended and long tail characteristic of motile fibroblasts often snaps also becoming a keratocyte-like rear (32). Moreover, upon myosin inhibition, spreading fibroblasts acquire a C-like shape, with a convex edge that protrudes and stretches the membrane, and a concave edge that is retracted by the tension generated in the membrane (33), similar to what we observe in motile fragments.
Additional modules, most prominently adhesion- and signaling-related, are known to play important roles in more complex cells (34). Adhesion is obviously essential for lamellipodial motility. Moreover, recent evidence suggests that the balance between adhesion and contraction significantly affects cell shape and motile behavior in whole keratocytes (6). Although we do not incorporate adhesion dynamics explicitly here, adhesion assembly and turnover are strongly coupled to actin dynamics so the net actin disassembly rate incorporated in our model likely depends on adhesion turnover as well (35, 36) (Fig. S11). The role of biochemical signaling modules in fragments and whole keratocytes is still unclear. Our results indicate that the lamellipodium is self-organizing, rather than being organized by signals from the cell body (which is absent in fragments). However, biochemical signaling within the lamellipodium may still play a role in shaping actin assembly and disassembly dynamics.
The importance of mechanical forces and feedbacks in cell biology in general and in cell motility in particular is becoming apparent. However, quantitative understanding of the interplay between mechanical forces and biochemical processes in the cell remains an outstanding challenge. Our work presents an important step forward in this respect; we integrate membrane mechanics with actin dynamics into a single self-consistent biophysical model of lamellipodial motility which is in excellent quantitative agreement with the experimental data. Membrane tension equilibrates rapidly across the cell and provides essentially instantaneous coupling between actin assembly and disassembly events occurring at distal locations along the cell boundary through the mechanical loads imposed by the plasma membrane. In this manner, membrane tension acts as a global mechanical regulator of actin dynamics, effectively coordinating molecular processes over cellular scales. Such mechanical feedbacks provide rapid and robust means for communication at the cellular level and likely play an important role in many other cellular processes.
Materials and Methods
Primary cultures are prepared from the Central American cichlid Hypsophrys nicaraguensis as described previously (5, 8). Sheets of keratocytes are detached from the substrate by treatment with 0.1% trypsin (Gibco BRL) and replated onto a new coverslip. Cell fragment formation is induced by incubation in 1 mL of culture media supplemented with 100 nM staurosporine (Sigma) at 35 °C for 30 min with the lid half open. Live cell imaging is performed on glass-bottom petri dishes (fluorodish; World Precision Instruments Ltd.) at room temperature on a Zeiss Axio-Observer inverted microscope and acquired with a CoolSnap HQ2 CCD camera (Photometrics) using a 63× objective (N.A. = 1.4). Actin dynamics are measured as in ref. 7, and actin distribution is measured by fixation and phalloidin staining as in ref. 5. Quantitative image analysis is done using the cell-tool package developed by Pincus and coworkers (5, 37), and custom code written in Python and Matlab. Further details on the materials and methods used can be found in the SI Materials and Methods.
Supplementary Material
Acknowledgments.
We thank Zach Pincus for help with analysis using the cell-tool package and comments on the manuscript. We thank Cyrus Wilson and Gaudenz Danuser for providing the MatLab code used to track actin network movement in motile fragments. We thank Erez Braun, Erin Barnhart, Patricia Yam, Greg Allen, Michael Kozlov, Aretha Fiebig, and Yariv Kafri for fruitful discussions and comments on the manuscript. This work was supported by a Levi Eshkol fellowship from the Israel Science Ministry (N.O.), a European Research Council starting grant and Marie Curie International Reintegration Grant from the European Research Council (K.K.), a grant from the United States-Israel Binational Science Foundation (K.K. and A.M.), and by National Institutes of Health Grant GM068952 (to A.M.).
Footnotes
The authors declare no conflict of interest.
This article is a PNAS Direct Submission.
See Commentary on page 20275.
This article contains supporting information online at www.pnas.org/lookup/suppl/doi:10.1073/pnas.1105333108/-/DCSupplemental.
References
- 1.Ridley AJ, et al. Cell migration: Integrating signals from front to back. Science. 2003;302:1704–1709. doi: 10.1126/science.1092053. [DOI] [PubMed] [Google Scholar]
- 2.Pollard TD, Borisy GG. Cellular motility driven by assembly and disassembly of actin filaments. Cell. 2003;112:453–465. doi: 10.1016/s0092-8674(03)00120-x. [DOI] [PubMed] [Google Scholar]
- 3.Raucher D, Sheetz MP. Cell spreading and lamellipodial extension rate is regulated by membrane tension. J Cell Biol. 2000;148:127–136. doi: 10.1083/jcb.148.1.127. [DOI] [PMC free article] [PubMed] [Google Scholar]
- 4.Schaus TE, Borisy GG. Performance of a population of independent filaments in lamellipodial protrusion. Biophys J. 2008;95:1393–1411. doi: 10.1529/biophysj.107.125005. [DOI] [PMC free article] [PubMed] [Google Scholar]
- 5.Keren K, et al. Mechanism of shape determination in motile cells. Nature. 2008;453:475–480. doi: 10.1038/nature06952. [DOI] [PMC free article] [PubMed] [Google Scholar]
- 6.Barnhart EL, Lee KC, Keren K, Mogilner A, Theriot JA. An adhesion-dependent switch between mechanisms that determine motile cell shape. PLoS Biol. 2011;9:e1001059. doi: 10.1371/journal.pbio.1001059. [DOI] [PMC free article] [PubMed] [Google Scholar]
- 7.Wilson CA, et al. Myosin II contributes to cell-scale actin network treadmilling through network disassembly. Nature. 2010;465:373–377. doi: 10.1038/nature08994. [DOI] [PMC free article] [PubMed] [Google Scholar]
- 8.Lacayo CI, et al. Emergence of large-scale cell morphology and movement from local actin filament growth dynamics. PLoS Biol. 2007;5:e233. doi: 10.1371/journal.pbio.0050233. [DOI] [PMC free article] [PubMed] [Google Scholar]
- 9.Svitkina TM, Verkhovsky AB, McQuade KM, Borisy GG. Analysis of the actin-myosin II system in fish epidermal keratocytes: Mechanism of cell body translocation. J Cell Biol. 1997;139:397–415. doi: 10.1083/jcb.139.2.397. [DOI] [PMC free article] [PubMed] [Google Scholar]
- 10.Lee J, Ishihara A, Theriot JA, Jacobson K. Principles of locomotion for simple-shaped cells. Nature. 1993;362:167–171. doi: 10.1038/362167a0. [DOI] [PubMed] [Google Scholar]
- 11.Keller HU, Bessis M. Migration and chemotaxis of anucleate cytoplasmic leukocyte fragments. Nature. 1975;258:723–724. doi: 10.1038/258723a0. [DOI] [PubMed] [Google Scholar]
- 12.Euteneuer U, Schliwa M. The function of microtubules in directional cell movement. Ann NY Acad Sci. 1986;466:867–886. doi: 10.1111/j.1749-6632.1986.tb38473.x. [DOI] [PubMed] [Google Scholar]
- 13.Verkhovsky AB, Svitkina TM, Borisy GG. Self-polarization and directional motility of cytoplasm. Curr Biol. 1999;9:11–20. doi: 10.1016/s0960-9822(99)80042-6. [DOI] [PubMed] [Google Scholar]
- 14.Okeyo KO, Adachi T, Hojo M. Dynamic coupling between actin network flow and turnover revealed by flow mapping in the lamella of crawling fragments. Biochem Biophys Res Commun. 2009;390:797–802. doi: 10.1016/j.bbrc.2009.10.052. [DOI] [PubMed] [Google Scholar]
- 15.Danuser G, Waterman-Storer CM. Quantitative fluorescent speckle microscopy of cytoskeleton dynamics. Annu Rev Biophys Biomol Struct. 2006;35:361–387. doi: 10.1146/annurev.biophys.35.040405.102114. [DOI] [PubMed] [Google Scholar]
- 16.Theriot JA, Mitchison TJ. Actin microfilament dynamics in locomoting cells. Nature. 1991;352:126–131. doi: 10.1038/352126a0. [DOI] [PubMed] [Google Scholar]
- 17.Watanabe N, Mitchison TJ. Single-molecule speckle analysis of actin filament turnover in lamellipodia. Science. 2002;295:1083–1086. doi: 10.1126/science.1067470. [DOI] [PubMed] [Google Scholar]
- 18.Mogilner A, Rubinstein B. Actin disassembly clock and membrane tension determine cell shape and turning: A mathematical model. J Phys Condens Matter. 2010;22:194118. doi: 10.1088/0953-8984/22/19/194118. [DOI] [PMC free article] [PubMed] [Google Scholar]
- 19.Kozlov MM, Mogilner A. Model of polarization and bistability of cell fragments. Biophys J. 2007;93:3811–3819. doi: 10.1529/biophysj.107.110411. [DOI] [PMC free article] [PubMed] [Google Scholar]
- 20.Grimm HP, Verkhovsky AB, Mogilner A, Meister JJ. Analysis of actin dynamics at the leading edge of crawling cells: Implications for the shape of keratocyte lamellipodia. Eur Biophys J. 2003;32:563–577. doi: 10.1007/s00249-003-0300-4. [DOI] [PubMed] [Google Scholar]
- 21.Kovar DR, Pollard TD. Insertional assembly of actin filament barbed ends in association with formins produces piconewton forces. Proc Natl Acad Sci USA. 2004;101:14725–14730. doi: 10.1073/pnas.0405902101. [DOI] [PMC free article] [PubMed] [Google Scholar]
- 22.Bar-Ziv R, Tlusty T, Moses E, Safran SA, Bershadsky A. Pearling in cells: A clue to understanding cell shape. Proc Natl Acad Sci USA. 1999;96:10140–10145. doi: 10.1073/pnas.96.18.10140. [DOI] [PMC free article] [PubMed] [Google Scholar]
- 23.Holzinger A. Jasplakinolide. An actin-specific reagent that promotes actin polymerization. Methods Mol Biol. 2001;161:109–120. doi: 10.1385/1-59259-051-9:109. [DOI] [PubMed] [Google Scholar]
- 24.Nolen BJ, et al. Characterization of two classes of small molecule inhibitors of Arp2/3 complex. Nature. 2009;460:1031–1034. doi: 10.1038/nature08231. [DOI] [PMC free article] [PubMed] [Google Scholar]
- 25.Heinemann F, Doschke H, Radmacher M. Keratocyte lamellipodial protrusion is characterized by a concave force-velocity relation. Biophys J. 2011;100:1420–1427. doi: 10.1016/j.bpj.2011.01.063. [DOI] [PMC free article] [PubMed] [Google Scholar]
- 26.Theriot JA, Mitchison TJ, Tilney LG, Portnoy DA. The rate of actin-based motility of intracellular listeria monocytogenes equals the rate of actin polymerization. Nature. 1992;357:257–260. doi: 10.1038/357257a0. [DOI] [PubMed] [Google Scholar]
- 27.Keren K, Yam PT, Kinkhabwala A, Mogilner A, Theriot JA. Intracellular fluid flow in rapidly moving cells. Nat Cell Biol. 2009;11:1219–1224. doi: 10.1038/ncb1965. [DOI] [PMC free article] [PubMed] [Google Scholar]
- 28.Sinard JH, Pollard TD. Microinjection into Acanthamoeba castellanii of monoclonal antibodies to myosin II slows but does not stop cell locomotion. Cell Motil Cytoskeleton. 1989;12:42–52. doi: 10.1002/cm.970120106. [DOI] [PubMed] [Google Scholar]
- 29.Wessels D, et al. Cell motility and chemotaxis in Dictyostelium amebae lacking myosin heavy chain. Dev Biol. 1988;128:164–177. doi: 10.1016/0012-1606(88)90279-5. [DOI] [PubMed] [Google Scholar]
- 30.Lammermann T, Sixt M. Mechanical modes of amoeboid cell migration. Curr Opin Cell Biol. 2009;21:636–644. doi: 10.1016/j.ceb.2009.05.003. [DOI] [PubMed] [Google Scholar]
- 31.Asano Y, et al. Keratocyte-like locomotion in amiB-null Dictyostelium cells. Cell Motil Cytoskeleton. 2004;59:17–27. doi: 10.1002/cm.20015. [DOI] [PubMed] [Google Scholar]
- 32.Lewis L, et al. The relationship of fibroblast translocations to cell morphology and stress fibre density. J Cell Sci. 1982;53:21–36. doi: 10.1242/jcs.53.1.21. [DOI] [PubMed] [Google Scholar]
- 33.Cai Y, et al. Cytoskeletal coherence requires myosin-IIA contractility. J Cell Sci. 2010;123:413–423. doi: 10.1242/jcs.058297. [DOI] [PMC free article] [PubMed] [Google Scholar]
- 34.Insall RH, Machesky LM. Actin dynamics at the leading edge: From simple machinery to complex networks. Dev Cell. 2009;17:310–322. doi: 10.1016/j.devcel.2009.08.012. [DOI] [PubMed] [Google Scholar]
- 35.Choi CK, et al. Actin and α-actinin orchestrate the assembly and maturation of nascent adhesions in a myosin II motor-independent manner. Nat Cell Biol. 2008;10:1039–1050. doi: 10.1038/ncb1763. [DOI] [PMC free article] [PubMed] [Google Scholar]
- 36.Lee J, Jacobson K. The composition and dynamics of cell-substratum adhesions in locomoting fish keratocytes. J Cell Sci. 1997;110:2833–2844. doi: 10.1242/jcs.110.22.2833. [DOI] [PubMed] [Google Scholar]
- 37.Pincus Z, Theriot JA. Comparison of quantitative methods for cell-shape analysis. J Microsc. 2007;227:140–156. doi: 10.1111/j.1365-2818.2007.01799.x. [DOI] [PubMed] [Google Scholar]
Associated Data
This section collects any data citations, data availability statements, or supplementary materials included in this article.