

Abstract
Cyclic nucleotide-regulated ion channels are present in bacteria, plants, vertebrates, and humans. In higher organisms, they are closely involved in signaling networks of vision and olfaction. Binding of cAMP or cGMP favors the activation of these ion channels. Despite a wealth of structural and studies, there is a lack of structural data describing the gating process in a full-length cyclic nucleotide-regulated channel. We used high-resolution atomic force microscopy (AFM) to directly observe the conformational change of the membrane embedded bacterial cyclic nucleotide-regulated channel MlotiK1. In the nucleotide-bound conformation, the cytoplasmic cyclic nucleotide-binding (CNB) domains of MlotiK1 are disposed in a fourfold symmetric arrangement forming a pore-like vestibule. Upon nucleotide-unbinding, the four CNB domains undergo a large rearrangement, stand up by ∼1.7 nm, and adopt a structurally variable grouped conformation that closes the cytoplasmic vestibule. This fully reversible conformational change provides insight into how CNB domains rearrange when regulating the potassium channel.
Keywords: conformational changes, cyclic nucleotide gating, membrane protein, MloK1, single-molecule imaging
Potassium channels are tetrameric membrane proteins that facilitate the permeation of potassium ions through the membrane with high specificity and high-throughput rates. These channels are central to the electrical activity of cells in humans and are, therefore, of fundamental importance for the function of nervous and muscular systems. The major mode of functional regulation in potassium channels is gating, a conformational change that occurs on the intracellular regions of the ion pore domain and involves an iris-like movement of the C-terminal transmembrane helices and a widening of the intracellular pore. Gating in potassium channels is induced by a variety of stimuli, including membrane voltage, intracellular calcium concentration, and cyclic nucleotide levels (1). These stimuli are sensed by a separate domain from the ion pore domain, inducing a conformational change that is then propagated to the gate of the channel.
The MlotiK1 potassium channel, from the bacterium Mesorhizobium loti, belongs to the family of channels that is regulated by cyclic nucleotides and includes eukaryotic cyclic nucleotide-gated (CNG) and hyperpolarization activated cyclic nucleotide-gated (HCN) channels (2, 3). These channels have C-terminal cytoplasmic cyclic nucleotide-binding (CNB) domains and upon binding of cAMP or cGMP, these domains undergo a conformational change that favors the opening of the gate of the channel. The major difference between the MlotiK1 channel and the CNG or HCN channels is the linker that connects the gate to the CNB domains. This helical linker (C linker) is roughly 80 residues long in CNG and HCN channels and only ∼20 residues long in the MlotiK1 channel.
The MlotiK1 channel has been the focus of structural and functional studies with the aim of understanding channel regulation by cyclic nucleotides. X-ray and NMR structures of the CNB domain in the cAMP-bound and -unbound conformations have been reported (4–6). Together with other CNB domain structures (7–9), the MlotiK1 studies have provided molecular details of ligand-binding and defined associated conformational changes. The structure of the full-length MlotiK1 channel, in detergent, has been reported at 3.1 Å resolution. This X-ray structure revealed the membrane-buried channel regions in the closed state, whereas the disordered CNB domains could not be observed (10). Electron microscopy of full-length channels in the presence of cAMP, either as 2D crystals in lipid bilayers or as single particles solubilized in detergent, produced a 9-Å resolution projection map (11) and a 16-Å resolution 3D structural model (12), respectively. The single-particle reconstruction shows the ligand-binding domains disposed in a fourfold symmetric arrangement. Despite this structural information, there is still a lack of understanding about the conformational changes that occur in the MlotiK1 channel upon ligand-binding.
Atomic force microscopy (AFM) has been established to observe the surfaces of membrane proteins at high resolution (0.5–2 nm) in their native state (13, 14). Importantly for biological applications, AFM requires no labeling or staining and allows imaging of membrane proteins in the lipid membrane, in buffer solution, and at ambient temperature (15, 16). With time-lapse AFM, it is possible to image single-membrane proteins at work (15, 17–19), as well as diffusing and assembling into higher complexes (20, 21).
To better understand the mechanism of gating in full-length cyclic nucleotide-regulated channels, we applied time-lapse AFM to characterize the conformational changes induced in the MlotiK1 channel by ligand-binding and -unbinding. AFM topographs show that upon cAMP-unbinding, the CNB domains of MlotiK1 undergo large conformational changes and move ∼1.7 nm. These conformational changes are reversed upon rebinding of cyclic nucleotide.
Results
High-Resolution AFM Imaging of Bound-State MlotiK1 Channels.
Wild-type (wt) MlotiK1 channels reconstituted at high protein:lipid ratio in polar Escherichia coli lipid membranes were adsorbed onto freshly cleaved mica and imaged by AFM in the presence of cAMP (Fig. S1). AFM topographs showed the 3D surface of lipid membranes, having diameters up to several tens of micrometers and islands of densely packed MlotiK1 channels. The height of the lipid membranes above the mica support was 4.0 ± 0.5 nm (n = 81), whereas the height of MlotiK1 containing membranes was 10.2 ± 0.8 nm (n = 176).
At higher resolution, AFM topographs of the densely packed protein assemblies revealed single MlotiK1 channels (Fig. 1) that showed a fourfold symmetric arrangement protruding 3.2 ± 0.5 nm (n = 100) from the lipid surface. Previous structural studies suggest that only the relatively large cytoplasmic CNB domains can protrude that far from the membrane surface (4, 11, 12). In contrast, the extracellular surface of MlotiK1 is expected to protrude less. Indeed, AFM topographs showed shallow fourfold symmetric protein surfaces that protruded only 1.8 ± 0.5 nm (n = 48) between the higher protruding tetrameric MlotiK1 channels (Fig. 1B and Fig. S2). This alternate disposition of MlotiK1 channels exposing either their cytoplasmic or extracellular surface is consistent with the previously described “up-and-down” packing of MlotiK1 channels reconstituted into 2D crystals (11, 12). A schematic figure (Fig. S3) shows the arrangement of the MlotiK1 channels and the heights measured by AFM. From these observations, we conclude that the four high protrusions of MlotiK1 represent the cytoplasmic cAMP-binding domains.
Fig. 1.

High-resolution AFM topographs of the wt cyclic nucleotide-regulated potassium channel MlotiK1. (A) Overview of a membrane patch of densely packed MlotiK1 channels. (B) MlotiK1 channels imaged at higher resolution. Each of the light colored tetramers corresponds to a channel viewed from the cytoplasmic side. Individual protrusions correspond to individual CNB domains that protrude 3.2 ± 0.5 nm (n = 100) from the lipid bilayer. In between the highly protruding (or light colored) channels, lower-lying tetramers (dashed circles) exposing the extracellular surface of the channel can be observed. These lower tetramers protrude 1.8 ± 0.5 nm (n = 48) from the lipid bilayer. A gallery of these lower-protruding MlotiK1 channels is shown in Fig. S2. Correlation average (C) and SD map (D) calculated from 54 highly protruding MlotiK1 tetramers show details of the CNB domains. AFM topographs show full-color levels corresponding to vertical height scale of 12 nm (A), 5 nm (B), 4 nm (C), and 0.6 nm (D). Imaging buffer was 50 mM KCl, 200 μM cAMP, and 20 mM Tris-HCl (pH 7.5).
To gain further insights into the disposition of CNB domains, we calculated a correlation-averaged topography of the MlotiK1 tetramer (Fig. 1C). The average shows that each CNB domain is oriented radially from the axis of the tetramer. At the center, the tetramer shows a vestibule with an inner diameter of ∼1.5 ± 0.5 nm and a depth of ∼1.4 ± 0.3 nm (n = 54). The SD map (22) shows the structural variability of the CNB domains (Fig. 1D).
MlotiK1 Membranes Increase Thickness in the Absence of cAMP.
It is expected that changing the functional state of MoltiK1 because of binding or unbinding of cyclic nucleotide causes the potassium channel to undergo a conformational change. Unfortunately, we could not use the wt MlotiK1 channel for imaging this change. The CNB domain of the wt MlotiK1 channel shows a high binding affinity for cAMP (KD, ∼80 nM) (23). Therefore, removal of nucleotide from the CNB domain by dialysis or by exchanging the buffer is an extremely slow and inefficient process (4, 6, 23). Accordingly, wt MlotiK1 membranes showed no significant changes in the absence of cAMP (Fig. S1 a–c). This observation was not altered after extensive washing steps and storage of wt MlotiK1 membranes for 4 d in cAMP-free buffer solution at room temperature (Fig. S4). High-resolution AFM topographs of wt MlotiK1 channels recorded in the absence of cAMP did not reveal conformational changes (Figs. S4b and S5). wt MlotiK1 membranes that were dialyzed for 9 d against cAMP-free buffer (Materials and Methods) showed no structural changes as well (Fig. S6a).
To study the conformational change that occurs upon ligand-binding and -unbinding, we used the R348A mutant of MlotiK1 that has lower affinity for cAMP (KD, ∼18 μM) and can be prepared both in the bound and unbound states (23). We had previously reported that this mutant was not activated by cAMP (4), but by decreasing the background noise of the radioactivity uptake assay, we are now able to detect nucleotide-dependent channel activity (Fig. 2 and Materials and Methods). R348A mutant channel has a substantially lower maximal activity than the wt channel (Fig. 2, inset), with a K1/2 of activation (10.0 ± 4.4 μM) 100-fold higher than wt MlotiK1 (Fig. 2). These results are consistent with previous cAMP-binding studies that show the CNB domain of the R348A mutant to bind cAMP at lower affinity (23).
Fig. 2.

cAMP-dependent activity of the wt and R348A mutant MlotiK1 channels. Uptake of 86Rb+ into liposomes containing R348A mutant channel was measured in dependence of cAMP. The uptake activity was examined in duplicate at each cAMP concentration, from a common stock of liposomes. Raw values were first normalized by valinomycin uptake in the same vesicles and subsequently normalized by uptake at the maximum value (1 mM cAMP). The experiment was conducted twice (with different purifications), yielding four data points at each concentration. The solid curve shows a fit of the R348A data (triangles) with a Hill equation, yielding a K1/2 of activation of 10 ± 4 μM and Hill coefficient of 1.1 ± 0.6. The dashed curve illustrates the fitted curve of similar experiments published on wt MlotiK1 (5), with K1/2 of 110 nM and Hill coefficient of 1.3. The inset shows normalized radioactivity cpm for wt and mutant MlotiK1 at saturating cAMP concentrations (100 μM for wt; 1 mM for R348A) or in the absence of cAMP (R348A, 0 mM). The raw data (R348A) show mean values, and bars indicate SEs. The wt data were taken from ref. 4.
We first imaged the R348A mutant in the presence of a saturating concentration of 900 μM cAMP (Fig. 3 A–C). Within the resolution achieved (1.5–2 nm), the mutant channel is indistinguishable from wt MlotiK1 (Fig. 1). Additionally, these mutant MlotiK1 membranes showed the same height 10.1 ± 0.8 nm (n = 156) as observed for wt MlotiK1 membranes (Fig. S1D). This agrees with the functional characterization that shows that the mutant is active (Fig. 2). To characterize the changes induced by cAMP release, we replaced the AFM imaging buffer for a cAMP-free buffer and reimaged the mutant MlotiK1 membranes after an incubation time of >3 h (Fig. S1 d and e). Mutant MlotiK1 membranes significantly increased heights (∼1.7 nm) upon removal of cAMP, protruding 11.8 ± 0.8 nm (n = 147) from the mica support. This height change was reversed by the addition of 900 μM cAMP (Fig. S1f and Table S1).
Fig. 3.

High-resolution AFM topographs of the R348A mutant cyclic nucleotide-regulated potassium channel MlotiK1. (A) Mutant potassium channels imaged in the presence of cAMP. Single MlotiK1 tetramers protrude 3.1 ± 0.5 nm (n = 57) from the lipid bilayer. (B and C) Correlation average (B) and SD map (C) of 73 MlotiK1 tetramers showing details of the CNB domains. (D) Mutant potassium channels imaged in the absence of cAMP. The topograph shows single protrusions that correspond to individual MlotiK1 tetramers and extend 4.9 ± 0.6 nm (n = 148) from the lipid bilayer. (E) Single-particle average of 256 protrusions. (F) SD map of E showing the high structural variability of the protrusions in the unbound state. (G) Mutant Mlotik1 imaged after readdition of cAMP shows single tetramers that protrude 3.2 ± 0.5 nm (n = 45) from the lipid bilayer. AFM topographs have full-color levels corresponding to vertical height scales of 4 nm (A, B, and G), 0.6 nm (C), 6 nm (D and E) and 1.5 nm (F). Imaging buffer was 50 mM KCl, 900 μM cAMP (A and G), no cAMP (D), and 20 mM Tris-HCl (pH 7.5).
We also imaged mutant MlotiK1 membranes that underwent a long dialysis step (9 d, with several dialysis-buffer changes) against cAMP-free buffer after protein reconstitution and before adsorption to the mica support. These membranes, imaged in cAMP-free buffer, showed an even larger height increase relative to the bound-state channel membranes, now protruding 13.5 ± 0.7 nm (n = 153) from the support (Fig. S6b). The cAMP-dependent height differences of the differently prepared mutant samples (Table S1) depend on the adsorption to mica. In samples already adsorbed to the mica support, the CNB domains in contact with the mica (Fig. S3) are hardly accessible to buffer exchange, do not loose the ligand, and, therefore, do not undergo a conformational change. Accordingly, removal of cAMP causes a ∼1.7 nm height increase per membrane leaflet. Table S1 gives an overview of all heights measured for wt and mutant MlotiK1 membranes, and Fig. S7 illustrates the nucleotide-dependent height changes of the membrane leaflets.
Nucleotide-Binding Domains Undergo Drastic Conformational Changes.
To characterize in detail the structural changes occurring with ligand-unbinding, we imaged the membranes containing mutant MlotiK1 channels at higher resolution. In cAMP-free buffer, we observed that the potassium channels protruded by 4.9 ± 0.6 nm (n = 148) from the lipid surface (Fig. 3D and Figs. S8 and S9). The characteristic fourfold symmetric structure of MlotiK1 observed in the cAMP-bound state (Figs. 1 and 3 A and B and Fig. S5), with four CNB domains surrounding the vestibule, was lost and each channel showed a single protrusion (Fig. 3 D and E). Importantly, at the single-molecule level, the protrusions do not show any obvious structural feature. This was reflected in the correlation-averaged topography (Fig. 3E). The SD map of the cAMP-unbound CNB domains showed much higher values (Fig. 3F) than that observed in presence of cAMP (Fig. 3C). This indicates an increased structural variability (or conformational flexibility) (22) of the CNB domains in the absence of ligand. Possibly because of this flexibility, substructural details of nucleotide-free MlotiK1 could not be contoured by the scanning AFM tip. Moreover, the AFM topographs showed that some protrusions appear to become more continuous between neighboring channels as if the CNB domains in the cAMP-unbound state could group with CNB domains from adjacent channels (Fig. 3D and Figs. S8 and S9). This change probably reflects an enhanced structural flexibility of the CNB domains, which allows them to explore a larger area and to interact with adjacent CNB domains provided by the densely packed potassium channels.
Upon readdition of saturating cAMP concentrations of 900 μM (Fig. 2), all CNB domains (∼99%) collapsed back onto the membrane and adopted the cAMP-bound conformation (Fig. 3G). To image densely packed MlotiK1 membranes that show both bound and unbound channel conformations, we incubated mutant MlotiK1 membranes with cAMP-free buffer. Verification that the CNB domains switched to their cAMP-unbound conformation was performed by AFM imaging the height changes of MlotiK1 membranes. After this, we readded 600 μM cAMP, which did not fully saturate the CNB domains, and imaged the mutant MlotiK1 channels at a higher resolution (Figs. S8 and S9). It was observed that the majority, but not all, of channels collapsed back to the cAMP-bound conformation. The AFM topographs showing the coexistence of both cAMP-unbound and cAMP-bound conformations suggest that the conformational change of MlotiK1 channels is not cooperative between neighboring channels. Most importantly, however, these topographs directly show the height difference between the cAMP-unbound and cAMP-bound mutant MlotiK1 channels of ∼1.7 nm (Figs. S8 and S9) and confirm the same height difference detected upon switching the conformation of all mutant channels of a membrane by cAMP (Fig. 3 and Tables S1 and S2).
Table S2 summarizes the heights measured for wt and mutant MlotiK1 channels in the presence and absence of cAMP. Every experiment from which we calculated the average heights was repeated 12 times (see Materials and Methods). In every experiment that involved removing cAMP from the buffer solution, we observed that the mutant channels switched from the cAMP-bound to the cAMP-unbound conformation, and upon adding cAMP to the buffer solution, the mutant channels readopted the cAMP-bound conformation. However, these nucleotide-dependent conformational changes could not be recorded for wt MlotiK1 channels. In summary, these results show that the conformational changes observed for mutant MlotiK1 are fully reversible and dependent on cyclic nucleotide. They further support the idea that these changes are involved in the gating mechanism of the cyclic nucleotide-regulated potassium channel MlotiK1.
Discussion
Using AFM, we have imaged at the single molecule level two different conformational states of the cyclic nucleotide-regulated potassium channel MlotiK1 in a lipid membrane. For these experiments, we used wt MlotiK1 and the R348A point mutant MlotiK1. Consistent with previous reports (4, 6, 23), the wt MlotiK1 channel could only be imaged in the cAMP-bound state. In contrast, the mutant channel is activated at a higher cAMP concentration, allowing us to visualize both the unbound and bound states. Importantly, the conformations of the bound state of wt and mutant MlotiK1 were indistinguishable. In the bound state, the cytoplasmic CNB domains are clearly discernible and organized in a fourfold arrangement (Figs. 1 B and C and 3 A and B), matching the symmetry of the membrane-buried regions of the channel (10). This disposition of the CNB domains was previously observed by electron microscopy (12). Strikingly, with AFM, it was possible to image a vestibule at the center of the tetrameric arrangement (Figs. 1C and 3B and Fig. S5b).
We compared the AFM topograph of the channel in the bound state to a model generated (Fig. 4 C, E, and G) with MlotiK1 X-ray structures of the transmembrane channel regions [Protein Databank (PDB) code 3BEH] (10) and of the cAMP-bound domain (PDB code 1VP6) (4). Because residues 219–224 of MlotiK1 are present in a α-helical conformation in both crystal structures, the four CNB domains could be docked to the transmembrane channel region (Fig. 4 E and G). The CNB domains were then rotated outward to minimize steric clashes with the long S2–S3 channel loops and between the four CNB domains. Superimposing the CNB domain X-ray structure to the AFM topograph of the cAMP-bound state (Fig. 4 A and C) confirms that the four protrusions contoured by AFM are the cytoplasmic CNB domains. The model also shows the presence of a vestibule created by the CNB domains and the helical linker (C linker) that connects the domains to the transmembrane regions of the channel.
Fig. 4.

Model of the conformational change gating the cyclic nucleotide-regulated potassium channel MlotiK1. Correlation-averaged AFM topographs of the cAMP-bound (A) and -unbound (B) conformations of the cytoplasmic surface of the MlotiK1 channel. Yellow lines represent height profiles of cross-sections along the averaged topographs. The dashed yellow line is that of the MlotiK1 channel in the cAMP-bound state. (C and D) Superimposition of averaged topograph and structural models for the cAMP-bound (C) and -unbound (D) conformations. Cytoplasmic CNB domains of the MlotiK1 channel are shown in red and yellow (see E and F); transmembrane domains are shown in gray. (E–H) Top (E and F) and side (G and H) view of structural models.
AFM imaging revealed that removal of cAMP from the buffer solution caused a dramatic conformational change in the mutant MlotiK1 channel. In the unbound state, the well-defined arrangement of the CNB domains is lost and a single large protrusion without reproducible substructures is detected (Figs. 3D and 4 B and D). The protrusion stands out ∼1.7 nm relative to the CNB domains in their cAMP-bound conformation. The topographs also show that during the structural rearrangement, the cytoplasmic vestibule has disappeared. Moreover, AFM detected an increased structural variability of CNB domains that was not observed for the nucleotide-bound state. This variability could result from the ability of the four CNB domains in a single MlotiK1 channel to adopt distinct positions from each other. Importantly, this conformational change was reversible, and upon addition of cAMP, the CNB domains converted back to the bound state (Fig. 3G and Figs. S8 and S9). In their rebound state, the CNB domains adopted the same structural conformation and regained the reduced structural flexibility observed before removal of cAMP.
Unlike for the bound state, the molecular interpretation of the AFM topographs of the channel in the unbound state is not straightforward, mainly because it is not possible to identify individual CNB domains. However, we can use what is known about the structural properties of the MlotiK1 channel to try to understand the changes detected by AFM. The transition between cAMP-bound and -unbound states involves the disappearance of the cytoplasmic vestibule and an increase in the height of the CNB domains. A possible explanation for the height change between the two states is revealed by creating a molecular model with the MlotiK1 X-ray structures of the transmembrane channel regions (PDB code 3BEH) (10) and of the cAMP-unbound CNB domain (PDB code 1U12) (4). A comparison between the model created with the cAMP-unbound CNB domains (Fig. 4 F and H) and the one created with cAMP-bound CNB domains (Fig. 4 E and G) shows a height difference of ∼1.6–1.9 nm, a value that compares very well with the height change measured by AFM between the channel bound and unbound states (Fig. 4 A and B). This comparison reveals that the height increase detected by AFM could result from the conformational change that occurs in the CNB domains upon ligand-unbinding, a change that has been well characterized by X-ray crystallography and NMR (4–6).
An intriguing aspect detected in the transition between the bound to the unbound state is the increase in the structural variability (or flexibility) of the CNB domains. This increase was assessed from a series of features revealed by AFM. (i) The SD map of the unbound-state protrusions (Fig. 3F) shows much larger values than similar maps for the bound state (Figs. 1D and 3C). This reflects a larger structural variability between protrusions of individual MlotiK1 channels. (ii) The averaged single protrusion in the unbound state lacks structural details; (iii) the CNB domains of single MlotiK1 channels in the unbound state are no longer distinguishable (Fig. 3D and Figs. S8 and S9a); and (iv) the protrusions of some channels in the unbound state can group with protrusions of neighboring MlotiK1 channels, indicating that the CNB domains are free to extend and to establish contacts with CNB domains from adjacent channels (Fig. 3D and Figs. S8 and S9).
Structural variability had been previously associated with the MlotiK1 CNB domains: (i) in the X-ray structure of the full-length MlotiK1, with partial ligand occupancy (10), the linker connecting the domains to the last transmembrane helix was clearly defined, but the CNB domains were crystallographically disordered and not observed; and (ii) in a comparison between different cAMP-unbound domain structures (5), the helices on the surface of the CNB domain, including the C-linker helix that connects to the channel gate, adopted different positions reflecting accessibility to multiple conformational states. In contrast, different X-ray structures in the cAMP-bound state were basically identical.
The conformational change observed for the CNB domains upon cAMP release is associated with an apparent volume increase of the cytoplasmic MlotiK1 surface. This increase is illustrated by the height profiles of the correlation averages (Fig. 4B). Based on the AFM topographs, we estimate that the apparent increase in volume is between 16–31 nm3, depending on whether or not we consider that the cytoplasmic vestibule is filled with protein. Using as rule of thumb an average volume of 0.14 nm3 for each amino acid (24), this apparent volume increase corresponds to 114–220 residues more in the cytoplasmic region in the unbound state relative to the bound state. From everything we know about potassium channels, a conformational change involving the transfer of these many amino acids from the transmembrane region to the cytoplasm is not possible. One possible explanation is that the apparent volume increase results from the conformational change of CNB domains that upon cAMP-unbinding increase height and distance from the transmembrane MlotiK1 domain, thereby creating a dome-like structure.
In conclusion, with AFM imaging of the MlotiK1 channel in two different functional states, we have shown that CNB domains in their cAMP-bound conformation are close to the membrane surface and adopt a well-defined conformation, whereas in the cAMP-unbound conformation, the CNB domains extend considerably from the transmembrane channel. A central characteristic of this ligand-induced conformational change is an order-to-disorder transition where in the bound state, CNB domains are ordered, and in the unbound, state the domains display a clear increase in their structural variability.
Materials and Methods
Protein Expression and Purification.
Protein expression and purification were based on the procedure described previously (11). Full-length wt MlotiK1 was expressed in E. coli C41 (DE3) cells after induction (at OD600, ∼1.0) for 5 h with 0.3 μg/mL anhydrotetracycline (Fluka). Cells were lysed in PBS buffer, and membranes containing MlotiK1 were harvested by ultracentrifugation (257,000 × g, 90 min). MlotiK1 was extracted from membranes with PBS buffer containing 25 mM n-decyl-β-d-maltopyranoside (DM), 5 mM β-mercaptoethanol, 200 μM cAMP. The histidine-tagged MlotiK1 was bound to Ni-NTA agarose beads (Qiagen) and eluted with 500 mM imidazole. The histidine tag was cleaved off with thrombin (HIT) and MlotiK1 was twice purified in a Superdex 200 (Amersham Pharmacia Biotech) size-exclusion chromatography column equilibrated in 20 mM Tris-HCl (pH 7.5), 150 mM KCl, 200 μM cAMP, 3 mM DTT, and 5 mM lauryldimethylamine-N-oxide (LDAO). The same procedure was used for the MlotiK1 R348A mutant, where the cAMP concentration was kept at 400 μM throughout purification (if not stated otherwise).
Reconstituting Densely Packed MlotiK1 Membranes.
MlotiK1 was reconstituted into lipid membranes forming densely packed assemblies using E. coli polar lipid extract (Avanti) as described previously (11). Lipids were dissolved in 20 mM Tris-HCl (pH 7.5), 150 mM KCl, 200 μM cAMP, 3 mM DTT, 5 mM LDAO, and 60 mM n-octyl-β-d-glucopyranoside. Samples were prepared by mixing protein and lipids at the lipid/protein ratios (mg/mg) of 1.5, 1.6, 1.7, or 1.8 (final volume was 109–111 μL). Mixtures were incubated at 30 °C for 1 h with agitation. Membranes were formed by dialyzing the samples against 2 L of a solution composed by 20 mM Tris-HCl (pH 7.5), 50 mM KCl, 200 μM cAMP for the wt channel and 600 μM cAMP for the mutant, 2 mM DTT, and 0.02% sodium azide using Slide-A-Lyzer MINI Dialysis units (Thermo Scientific) with a 10 kDa cutoff. Dialysis was continued for 2–3 d at 31 °C.
To prepare MlotiK1 channels without cyclic nucleotide, the membranes were formed in the presence of cAMP as described above, but then the dialysis buffer was changed for a dialysis solution without cAMP, and the dialysis was extended for 2 d at 31 °C. After this time, the temperature was changed to 20 °C, and the dialysis was continued for additional 7 d during which the cAMP-free dialysis solution was changed once. The expected nucleotide concentration after these dialysis steps was <300 pM for mutant and <100 pM for wt MlotiK1. These concentrations are well below the cAMP affinities of the channel (KD (wt), ∼80 nM; KD (mutant), ∼18 μM). Fresh DTT was added every 2 d. Reconstituted membranes were stored at 4 °C until AFM analysis.
Radioactive Flux Assay.
The 86Rb+ uptake assay was performed as described previously (4, 25). Briefly, MlotiK1 was reconstituted in proteoliposomes in the presence of high concentration of K+. K+ was removed from the external solution, 86Rb+ was added, and after incubating for 90 min, the radioactivity associated with the proteoliposomes was measured. The data presented here display decreased baseline noise by comparison with our previous study (4). We attribute this to decreased contamination by other proteins, achieved by incremental improvements of multiple purification steps.
AFM.
The AFM (Nanocope IIe; Veeco) was equipped with a fluid cell and oxide-sharpened Si3N4 cantilevers (OMCL TR400PSA; Olympus) having nominal spring constants of ∼0.09 N/m. Reconstituted MlotiK1 membranes were adsorbed onto freshly cleaved mica (26) in 200 mM KCl, 20 mM Tris-HCl (pH 7.5), and at cAMP concentrations indicated. After an adsorption time of ∼30 min, the sample was gently rinsed with the imaging buffer to remove nonadsorbed membranes. Imaging buffer solutions were either 50 mM KCl; 200, 600, or 900 μM cAMP; and 20 mM Tris-HCl (pH 7.5); or 50 mM KCl and 20 mM Tris-HCl (pH 7.5). All buffer solutions were freshly made using nano-pure water (18.2 MOhm/cm) and pro analysi (>98.5%) purity-grade reagents from Sigma and Merck. Upon buffer exchange, the AFM setup was thermally equilibrated for ∼30 min. When changing cAMP-containing buffer for cAMP-free buffer, the sample was incubated for >3 h before imaging. High-resolution contact-mode AFM topographs were recorded at room temperature and at imaging forces of ∼50 pN that do not to perturb the native membrane protein structure (13, 27). Imaging forces were manually adjusted to compensate for thermal drift (13). Proportional and integral gains were adjusted manually to minimize the error (deflection) signal and to maximize the height signal. When approaching a lateral resolution of ∼2 nm, the scanning speed of the AFM stylus was between 500 and 1500 nm/s.
To prove the reproducibility of the experimental findings, we repeated every experimental condition for wt and mutant MlotiK1 in at least 12 independent experiments. In every experiment, we recorded between 20 and 60 AFM topographs of MlotiK1 membranes and channels. For every experimental condition, the statistical height analysis of MlotiK1 membranes (Table S1) was determined from membranes imaged in at least 12 independent experiments. All experiments conducted were consistent and showed that the height changes observed upon cAMP-binding and cAMP-unbinding of mutant MlotiK1 channels were fully reproducible (Tables S1 and S2).
Image Processing and Averaging.
AFM topographs (512 × 512 pixels) were selected by the structural details of the reproducibly imaged MlotiK1 surface and when showing identical structural features in the simultaneously monitored trace and retrace scanning directions. Correlation averaging was performed using the SEMPER image processing system (28, 29). Single particles were translationally and rotationally aligned to a reference MlotiK1 and averaged. This correlation average was used as a reference for refinement cycles. Correlation-averaged unit cells of the MlotiK1 tetramer were fourfold symmetrized. To assess the SD, σk,l, individual unit cells were aligned angularly, as well as translationally, before single-particle averaging (30). The SD was then calculated from the averaged topograph μk,l for each pixel (k, l) for xi particles:
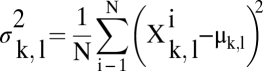 |
SD maps are displayed as image in a one-to-one pixel correspondence with the correlation-averaged topograph.
Supplementary Material
Acknowledgments
We thank P. Bosshart for discussions and C. Bippes for experimental advice. This study was supported by the Deutsche Forschungsgemeinschaft; European Union; European Life Scientist Organization; Klaus Tschira Stiftung; Swiss National Science Foundation; Fundação para a Ciência e a Tecnologia (PhD Fellowship SFRH/BD/60274/2009 to J.P.); and European Molecular Biology Organization for an installation grant to J.H.M.-C.
Footnotes
The authors declare no conflict of interest.
This article is a PNAS Direct Submission.
This article contains supporting information online at www.pnas.org/lookup/suppl/doi:10.1073/pnas.1111149108/-/DCSupplemental.
References
- 1.Kaupp UB, Seifert R. Molecular diversity of pacemaker ion channels. Annu Rev Physiol. 2001;63:235–257. doi: 10.1146/annurev.physiol.63.1.235. [DOI] [PubMed] [Google Scholar]
- 2.Kaupp UB, Seifert R. Cyclic nucleotide-gated ion channels. Physiol Rev. 2002;82:769–824. doi: 10.1152/physrev.00008.2002. [DOI] [PubMed] [Google Scholar]
- 3.Matulef K, Zagotta WN. Cyclic nucleotide-gated ion channels. Annu Rev Cell Dev Biol. 2003;19:23–44. doi: 10.1146/annurev.cellbio.19.110701.154854. [DOI] [PubMed] [Google Scholar]
- 4.Clayton GM, Silverman WR, Heginbotham L, Morais-Cabral JH. Structural basis of ligand activation in a cyclic nucleotide regulated potassium channel. Cell. 2004;119:615–627. doi: 10.1016/j.cell.2004.10.030. [DOI] [PubMed] [Google Scholar]
- 5.Altieri SL, et al. Structural and energetic analysis of activation by a cyclic nucleotide binding domain. J Mol Biol. 2008;381:655–669. doi: 10.1016/j.jmb.2008.06.011. [DOI] [PMC free article] [PubMed] [Google Scholar]
- 6.Schünke S, Stoldt M, Lecher J, Kaupp UB, Willbold D. Structural insights into conformational changes of a cyclic nucleotide-binding domain in solution from Mesorhizobium loti K1 channel. Proc Natl Acad Sci USA. 2011;108:6121–6126. doi: 10.1073/pnas.1015890108. [DOI] [PMC free article] [PubMed] [Google Scholar]
- 7.Kim C, Xuong NH, Taylor SS. Crystal structure of a complex between the catalytic and regulatory (RIalpha) subunits of PKA. Science. 2005;307:690–696. doi: 10.1126/science.1104607. [DOI] [PubMed] [Google Scholar]
- 8.Sharma H, Yu S, Kong J, Wang J, Steitz TA. Structure of apo-CAP reveals that large conformational changes are necessary for DNA binding. Proc Natl Acad Sci USA. 2009;106:16604–16609. doi: 10.1073/pnas.0908380106. [DOI] [PMC free article] [PubMed] [Google Scholar]
- 9.Taraska JW, Puljung MC, Olivier NB, Flynn GE, Zagotta WN. Mapping the structure and conformational movements of proteins with transition metal ion FRET. Nat Methods. 2009;6:532–537. doi: 10.1038/nmeth.1341. [DOI] [PMC free article] [PubMed] [Google Scholar]
- 10.Clayton GM, Altieri S, Heginbotham L, Unger VM, Morais-Cabral JH. Structure of the transmembrane regions of a bacterial cyclic nucleotide-regulated channel. Proc Natl Acad Sci USA. 2008;105:1511–1515. doi: 10.1073/pnas.0711533105. [DOI] [PMC free article] [PubMed] [Google Scholar]
- 11.Clayton GM, Aller SG, Wang J, Unger V, Morais-Cabral JH. Combining electron crystallography and X-ray crystallography to study the MlotiK1 cyclic nucleotide-regulated potassium channel. J Struct Biol. 2009;167:220–226. doi: 10.1016/j.jsb.2009.06.012. [DOI] [PMC free article] [PubMed] [Google Scholar]
- 12.Chiu PL, et al. The structure of the prokaryotic cyclic nucleotide-modulated potassium channel MloK1 at 16 A resolution. Structure. 2007;15:1053–1064. doi: 10.1016/j.str.2007.06.020. [DOI] [PMC free article] [PubMed] [Google Scholar]
- 13.Müller DJ, Engel A. Atomic force microscopy and spectroscopy of native membrane proteins. Nat Protoc. 2007;2:2191–2197. doi: 10.1038/nprot.2007.309. [DOI] [PubMed] [Google Scholar]
- 14.Frederix PL, Bosshart PD, Engel A. Atomic force microscopy of biological membranes. Biophys J. 2009;96:329–338. doi: 10.1016/j.bpj.2008.09.046. [DOI] [PMC free article] [PubMed] [Google Scholar]
- 15.Engel A, Müller DJ. Observing single biomolecules at work with the atomic force microscope. Nat Struct Biol. 2000;7:715–718. doi: 10.1038/78929. [DOI] [PubMed] [Google Scholar]
- 16.Müller DJ, Dufrêne YF. Atomic force microscopy as a multifunctional molecular toolbox in nanobiotechnology. Nat Nanotechnol. 2008;3:261–269. doi: 10.1038/nnano.2008.100. [DOI] [PubMed] [Google Scholar]
- 17.Müller DJ, Hand GM, Engel A, Sosinsky GE. Conformational changes in surface structures of isolated connexin 26 gap junctions. EMBO J. 2002;21:3598–3607. doi: 10.1093/emboj/cdf365. [DOI] [PMC free article] [PubMed] [Google Scholar]
- 18.Yu J, Bippes CA, Hand GM, Muller DJ, Sosinsky GE. Aminosulfonate modulated pH-induced conformational changes in connexin26 hemichannels. J Biol Chem. 2007;282:8895–8904. doi: 10.1074/jbc.M609317200. [DOI] [PubMed] [Google Scholar]
- 19.Mari SA, et al. pH-induced conformational change of the beta-barrel-forming protein OmpG reconstituted into native E. coli lipids. J Mol Biol. 2010;396:610–616. doi: 10.1016/j.jmb.2009.12.034. [DOI] [PubMed] [Google Scholar]
- 20.Müller DJ, et al. Observing membrane protein diffusion at subnanometer resolution. J Mol Biol. 2003;327:925–930. doi: 10.1016/s0022-2836(03)00206-7. [DOI] [PubMed] [Google Scholar]
- 21.Yamashita H, et al. Dynamics of bacteriorhodopsin 2D crystal observed by high-speed atomic force microscopy. J Struct Biol. 2009;167:153–158. doi: 10.1016/j.jsb.2009.04.011. [DOI] [PubMed] [Google Scholar]
- 22.Müller DJ, Fotiadis D, Engel A. Mapping flexible protein domains at subnanometer resolution with the AFM. FEBS Lett. 1998;430:105–111. doi: 10.1016/s0014-5793(98)00623-1. [DOI] [PubMed] [Google Scholar]
- 23.Cukkemane A, et al. Subunits act independently in a cyclic nucleotide-activated K(+) channel. EMBO Rep. 2007;8:749–755. doi: 10.1038/sj.embor.7401025. [DOI] [PMC free article] [PubMed] [Google Scholar]
- 24.Harpaz Y, Gerstein M, Chothia C. Volume changes on protein folding. Structure. 1994;2:641–649. doi: 10.1016/s0969-2126(00)00065-4. [DOI] [PubMed] [Google Scholar]
- 25.Nimigean CM. A radioactive uptake assay to measure ion transport across ion channel-containing liposomes. Nat Protoc. 2006;1:1207–1212. doi: 10.1038/nprot.2006.166. [DOI] [PubMed] [Google Scholar]
- 26.Müller DJ, Amrein M, Engel A. Adsorption of biological molecules to a solid support for scanning probe microscopy. J Struct Biol. 1997;119:172–188. doi: 10.1006/jsbi.1997.3875. [DOI] [PubMed] [Google Scholar]
- 27.Müller DJ, Engel A. Voltage and pH-induced channel closure of porin OmpF visualized by atomic force microscopy. J Mol Biol. 1999;285:1347–1351. doi: 10.1006/jmbi.1998.2359. [DOI] [PubMed] [Google Scholar]
- 28.Saxton WO, Pitt TJ, Horner M. Digital image processing: The semper system. Ultramicroscopy. 1979;4:343–354. [Google Scholar]
- 29.Saxton WO, Baumeister W. The correlation averaging of a regularly arranged bacterial cell envelope protein. J Microsc. 1982;127:127–138. doi: 10.1111/j.1365-2818.1982.tb00405.x. [DOI] [PubMed] [Google Scholar]
- 30.Frank J, Bretaudiere J-P, Carazo J-M, Veschoor A, Wagenknecht T. Classification of images of biomolecular assemblies: A study of ribosomes and ribosomal subunits of Escheria coli. J Microsc. 1987;150:99–115. doi: 10.1111/j.1365-2818.1988.tb04602.x. [DOI] [PubMed] [Google Scholar]
Associated Data
This section collects any data citations, data availability statements, or supplementary materials included in this article.