

Abstract
Integration sites for many retrotransposons and retroviruses are determined by interactions between retroelement-encoded integrases and specific DNA-bound proteins. The Saccharomyces retrotransposon Ty5 preferentially integrates into heterochromatin because of interactions between Ty5 integrase and the heterochromatin protein silent information regulator 4. We mapped over 14,000 Ty5 insertions onto the S. cerevisiae genome, 76% of which occurred in heterochromatin, which is consistent with the known target site bias of Ty5. Using logistic regression, associations were assessed between Ty5 insertions and various chromosomal features such as genome-wide distributions of nucleosomes and histone modifications. Sites of Ty5 insertion, regardless of whether they occurred in heterochromatin or euchromatin, were strongly associated with DNase hypersensitive, nucleosome-free regions flanking genes. Our data support a model wherein silent information regulator 4 tethers the Ty5 integration machinery to domains of heterochromatin, and then, specific target sites are selected based on DNA access, resulting in a secondary target site bias. For insertions in euchromatin, DNA access is the primary determinant of target site choice. One consequence of the secondary target site bias of Ty5 is that insertions in coding sequences occur infrequently, which may preserve genome integrity.
The insertion of mobile genetic elements into new chromosomal sites profoundly impacts genome structure and evolution. For many mobile elements, integration sites are not chosen randomly. Target site biases are particularly well-documented for the LTR retrotransposons and retroviruses (1–3). These retroelements replicate by reverse-transcribing mRNA into cDNA and then inserting the cDNA into their host's genome using an element-encoded integrase (IN). Retrotransposons are among the most abundant interspersed repeats in eukaryotic genomes, and retroviruses are often used as vectors for gene therapy. Understanding mechanisms of retroelement target site choice, therefore, has value for both basic and applied research.
In the best studied cases, retroelement target site choice is dictated by interactions between IN and specific DNA-bound proteins. HIV IN, for example, interacts with the transcription coactivator lens epithelial-derived growth factor (4), and sites of HIV integration are influenced by sites of this protein's chromosomal occupancy (5). The role of chromatin in target site choice is also well-established for model yeast retrotransposons. The Schizosaccharomyces pombe Tf1 element inserts preferentially into regions upstream of some genes transcribed by RNA polymerase (pol) II (6). Tf1 IN interacts with the transcription factor Atf1p (7), and at the fbp1 promoter, Atf1p alone mediates target site choice (8). The Saccharomyces cerevisiae Ty1 and Ty3 retrotransposons prefer to integrate upstream of genes transcribed by RNA pol III, likely because of interactions between IN and components of the pol III machinery or associated chromatin (9, 10). In the case of Ty3, critical factors for targeting are the TATA binding protein and Brf (also called TFIIIB70) (11, 12).
The first retroelement for which a targeting mechanism was described in detail was the Saccharomyces retrotransposon Ty5. Ty5 integrates preferentially into heterochromatin, which in yeast, is found near the telomeres and silent mating loci (HML and HMR) (13–15). Ty5 IN selects integration sites using a 6-aa motif at the IN C terminus (16, 17). This IN targeting domain interacts with a protein component of heterochromatin, namely silent information regulator 4 (Sir4) (16, 18). The Ty5 IN/Sir4 interaction tethers the integration complex to target sites and results in the primary target site bias of Ty5.
In this study, we applied high-throughput DNA sequencing to characterize a large number of Ty5 insertions that we mapped to the S. cerevisiae genome. Whereas the majority of Ty5 elements integrated as predicted in heterochromatin, a secondary target site bias was revealed for both euchromatic and heterochromatic insertions. Logistic regression established that this secondary bias was influenced by chromosomal features characteristic of open chromatin, including DNase hypersensitivity, lack of nucleosomes, presence of transcription factors, and epigenetic marks associated with gene transcription. We provide evidence suggesting that this secondary target site bias reflects sites that can be easily accessed by the Ty5 integration complex during integration.
Results
Ty5 Insertion Dataset.
To observe genome-wide patterns of Ty5 integration, we created an integrant library of ∼400,000 independent transposition events. This library was derived from 16 separate Ty5 transposition assays—8 assays using the WT YPH499 haploid strain and 8 assays using the isogenic WT diploid YPH501. Ty5/host DNA junction fragments were recovered from each of the 16 populations using linker-mediated PCR. Linkers were ligated to genomic DNA that had been digested with restriction enzymes. Four enzymes (each recognizing four bases) were used to maximize potential to recover sites and minimize recovery bias. The genomic sequence at each insertion site was determined by pyrosequencing using the 454 GS FLX platform.
In total, ∼337,000 sequencing reads were obtained (Table 1). Specific barcode sequences in the PCR primers made it possible to assign reads to 1 of 16 transposition assays. Reads were excluded that (i) did not have a perfect match to a barcode and surrounding DNA or (ii) had more than four mismatches to the primer. Furthermore, insertions at a given position and orientation were only counted once in each pool. In total, ∼160,000 reads passed our filters. Sequences sharing more than 98% sequence identity to a single site on the S. cerevisiae genome were designated as unambiguous insertions. Because Ty5 integrates preferentially into repetitive, subtelomeric regions, reads mapping to multiple sites in the genome (greater than 98% sequence identity) were also considered. These ambiguous insertions were down-weighted by a factor equal to the number of sites to which the read mapped (i.e., each ambiguous site was assigned a fraction of an integration event); 40% of the high-quality reads were ambiguous.
Table 1.
Ty5 insertion sites recovered by pyrosequencing
| Strain name and pool number | Ploidy | All reads | Clean reads | Base pairs hosting ambiguous alignments | Base pairs hosting unambiguous alignments |
| YPH499-1 | Haploid | 21,960 | 10,368 | 468 | 743 |
| YPH499-2 | Haploid | 22,050 | 11,082 | 423 | 847 |
| YPH499-3 | Haploid | 22,559 | 10,356 | 370 | 673 |
| YPH499-4 | Haploid | 23,351 | 10,868 | 444 | 766 |
| YPH499-5 | Haploid | 22,102 | 10,525 | 400 | 719 |
| YPH499-6 | Haploid | 21,367 | 9,161 | 361 | 637 |
| YPH499-7 | Haploid | 21,361 | 9,816 | 540 | 912 |
| YPH499-8 | Haploid | 21,779 | 10,749 | 568 | 987 |
| YPH501-1 | Diploid | 18,605 | 9,127 | 348 | 389 |
| YPH501-2 | Diploid | 20,365 | 9,485 | 207 | 228 |
| YPH501-3 | Diploid | 19,292 | 8,680 | 264 | 214 |
| YPH501-4 | Diploid | 20,889 | 9,903 | 222 | 287 |
| YPH501-5 | Diploid | 19,572 | 9,182 | 212 | 234 |
| YPH501-6 | Diploid | 21,967 | 10,460 | 205 | 279 |
| YPH501-7 | Diploid | 21,014 | 10,542 | 346 | 450 |
| YPH501-8 | Diploid | 19,237 | 8,906 | 205 | 243 |
| Not assigned | 6,399 | — | — | — |
Primary Target Site Bias of Ty5.
The majority of Ty5 insertions mapped to the ends of all 16 S. cerevisiae chromosomes (Fig. 1 and Fig. S1). Thus, the primary pattern of Ty5 integration matched what we predicted based on our previous work showing the key role played by heterochromatin in target site choice (15, 18). Because most Ty5 insertions were subtelomeric, for subsequent analyses, the genome was split into two regions, designated euchromatin and heterochromatin. Heterochromatic regions began at the end of a chromosome and ended 10 kb centromere proximal to the subtelomeric X repeat or one of the silent mating loci, HML or HMR. By this definition, heterochromatin constituted 4% of the genome and received 76% of the insertions. This insertion density is likely an underestimate, because reads mapping to the same position were excluded if they were derived from the same pool; such duplicate reads may represent independent insertions at the same site. Euchromatic regions comprised most of the chromosomes and were bounded by centromere-proximal points 40 kb distant from an X repeat, HML or HMR. This left a 30-kb buffer between heterochromatin and euchromatin to ensure that signals were distinct. The euchromatin and buffer regions constituted 88% and 7% of the genome, respectively. The rDNA and MAT were excluded from euchromatin, because the former is not accurately represented in the reference genome and the latter contained many ambiguous insertions because of duplicated sequences at the silent mating loci.
Fig. 1.

Distribution of Ty5 insertions on chr 3. The x axis denotes position along the chromosome at 1,000-bp resolution. Black bars indicate the number of unambiguous integrations at a particular site; stacked green bars indicate additional ambiguous integrations. Bars above the x axis indicate data from the haploid strain; bars below the x axis denote data from the diploid strain.
Selection could influence the distribution of Ty5 insertions; for example, insertions may not be recovered if they occur in essential genes in haploid strains. To assess impacts of selection, Ty5 insertion sites were compared between the haploid and diploid populations. Both the haploid and diploid chromosomal distributions were nearly identical, with a Pearson's correlation of 0.82 at 10-bp resolution. Selection, therefore, does not play a significant role in global patterns of Ty5 integration.
Relationships Between Ty5 Insertions and Chromosomal Features.
For S. cerevisiae, a large body of genome-wide data has accumulated describing, for example, distributions of various histone modifications, transcription factor binding sites, and nucleosome occupancy (Table S1). To better understand factors that influence Ty5 target site choice, we used logistic regression to establish associations between insertions and these chromosomal features as well as DNA sequence landmarks such as ORFs or specific gene classes (e.g., those genes transcribed by RNA pol III). Our implementation compared sites of observed integration (case) with a random subset of sites without integrations (control). The random distribution was corrected for possible recovery bias because of restriction site distribution. Additionally, the overall quality of the model was evaluated using receiver operating characteristic (ROC) analysis, particularly the value of the area under the curve (AUC). Logistic regression was applied to the euchromatic and heterochromatic datasets separately (Fig. 2). Both single- and multidimensional models were evaluated, and both gave the same overall conclusions. In the following paragraphs, we illustrate the major findings of 1D logistic regression using representative examples of euchromatic and heterochromatic Ty5 target sites. Details about the multidimensional models are provided in Fig. S2.
Fig. 2.

Associations between Ty5 insertions and chromosomal features. Heat maps showing the area under the curve (AUC) of the receiver operating characteristic (ROC) curve from logistic classifiers trained on single features. Actual values shown are AUC-0.5. As such, zero indicates a model of no predictive power, whereas 0.5 and −0.5 indicate models of perfect predictive power. Positive AUCs signify features associated with case integrations; negative AUCs signify sites associated with control integrations. Heat maps for insertions in euchromatin (on the left) and heterochromatin (on the right) were generated from separate models. Details of the datasets used for various chromosomal features can be found in Table S1.
Ty5 insertions in heterochromatin.
Recently, a genome-wide map of Sir4 chromosomal occupancy was determined (19), and to our initial surprise, logistic regression did not reveal an association between Ty5 insertions and sites of Sir4. In Fig. 3, we plot Ty5 insertions and Sir4 distribution at a few subtelomeric regions, and as can be seen, peaks of Sir4 and Ty5 insertions occur near the subtelomeric X repeats and the silencers flanking HMR (Fig. S1). As illustrated by these examples, Sir4 is highly localized, and sites of Sir4 occupancy are predictive of sites of Ty5 integration. However, because very little Sir4 is found elsewhere throughout the subtelomeric region (or the remainder of the genome), the majority of insertions in heterochromatin (or euchromatin) have no clear link to Sir4 distribution. Our logistic regression model only considers chromosomal features at or near (e.g., within 1 kb) a Ty5 insertion site, and therefore, logistic regression did not reveal a strong Ty5/Sir4 association.
Fig. 3.

Ty5 insertions in heterochromatin. Representative heterochromatic domains are shown for the left subtelomeric region of chr 15 (A), the left subtelomeric region of chr 12 (B), and the right subtelomeric region of chr 3 (C). Verified (red) and uncharacterized (tan) ORFs are depicted. Black and green bars indicate the frequency of unambiguous and ambiguous integration events, respectively. Bars above the x axis indicate integrations in the haploid strain; bars below the x axis are integrations in the diploid. The heat map at the top of the graph displays Sir4 occupancy in red; the color intensity was normalized to the chromosomal regions depicted.
Sir4 aside, logistic regression identified several chromosomal features in heterochromatin that were positively or negatively associated with Ty5 insertions. Among these features was a positive association (AUC-0.5 = 0.11) with 1-kb regions centered on known autonomously replicating sequences (ARSs), which often serve as sites of DNA replication (Fig. 2) (20). The subtelomeric X repeats, which are bound in Sir4, also contain an ARS, and in our previous work, Ty5 insertions were considered targeted if they occurred within a 3-kb window centered on an X ARS (15). The high incidence of insertions near X repeats (Fig. 3) likely explains the observed association with ARSs.
A negative association (AUC-0.5 = −0.12) was identified between Ty5 insertions and Y′ elements—repeats at the ends of some yeast chromosomes that are typically either 5.5 or 6.7 kb in length and encode a helicase (21). The Y′ coding region, in particular, was a cold spot for integration, which is illustrated for the two tandem Y′ elements on chr 12L (Fig. 3B). Insertion hotspots, however, occurred on the centromere-proximal side of the Y′ elements—the side adjacent to an X repeat—and at sites rich in Sir4 between the Y′ elements and at the telomere itself. The coding sequences of Y′ elements are bound by nucleosomes, and the Ty5 insertion hotspots flanking Y′ elements lack nucleosomes (22, 23). The pattern of Ty5 insertions is, therefore, consistent with the finding that nucleosome occupancy is a strong negative predictor of Ty5 insertion sites (Fig. 2). Nucleosomes were represented in two different forms in the regression model: either as processed ChIP probe values (AUC-0.5 = −0.25) or as a ternary prediction from a hidden Markov model trained on the ChIP data (AUC-0.5 = −0.14) (23). Nucleosomes were also avoided if they contained H2AZ (AUC-0.5 = −0.18), an H2 variant enriched in transcriptionally inactive genes (24).
On chr 3, heterochromatic domains are found at the telomeres and silent mating loci, the latter of which are located up to 30 kb from the end of the chromosome. As illustrated for the right arm of chr 3 (Fig. 3C), in addition to peaks of Ty5 insertions near the silencers flanking HMR and at the X repeat, clusters of insertions occur throughout the region telomere proximal to HMR, particularly in intergenic regions. Localized selection does not contribute to the distribution pattern, because none of the genes on the right arm of chr 3 are essential (25). Furthermore, a similar insertion distribution is observed in both haploid and diploid strains. Clustering of Ty5 insertions adjacent to coding sequences can also be seen in other subtelomeric regions (e.g., chr 12L) (Fig. 3B). This pattern is consistent with the results of logistic regression, indicating that heterochromatic insertions are slightly associated with upstream regions of genes (AUC-0.5 = 0.06) and very strongly associated with DNase hypersensitive sites (AUC-0.5 = 0.25), a feature characteristic of many promoters.
Ty5 insertions in euchromatin.
Logistic regression performed on euchromatic insertions revealed a similarly pronounced association between Ty5 and regions flanking genes. As with heterochromatin, Ty5 insertions showed a strong positive association with DNase hypersensitive sites (AUC-0.5 = 0.25) and regions upstream of verified ORFs (AUC-0.5 = 0.20). Other features characteristic of actively transcribed genes were also positively associated, such as H3 K14 and H3 K9 acetylation (AUC-0.5 = 0.15) (26) and sites bound by transcription factors (AUC-0.5 = 0.14). Negative associations were similar to those of heterochromatin, namely that Ty5 was less likely to be found in coding sequences (AUC-0.5 = −0.20) and sites bound by nucleosomes (AUC-0.5 = −0.20 hidden Markov model or −0.25 ChIP). Representative Ty5 hotspots in euchromatin are illustrated in Fig. S3.
Secondary Target Site Bias of Ty5.
Because Ty5 insertions in both euchromatin and heterochromatin were enriched in intergenic regions, we generated composite figures relating Ty5 insertions to ORFs in both of these chromatin environments (Fig. 4). On average, insertions begin to occur near the start codon and peak ∼100 bp upstream at a site corresponding to minimal nucleosome occupancy. Insertion frequency falls off to background levels ∼1,000 bp upstream of the translational start. A smaller peak of insertions is also observed in a nucleosome-poor region downstream of the ORFs. As indicated by the logistic regression analyses, Ty5 avoids integrating into the nucleosome-bound coding sequences. Subtle discrepancies distinguished euchromatin and heterochromatin integration patterns; for example, there is a clear peak of Sir4 density downstream of ORFs in heterochromatin and an adjacent peak of Ty5 insertions. In the Δsir4 strain, the Ty5 peak shifts to the site occupied by Sir4 in the WT, suggesting that this site may now be more accessible to the integration complex.
Fig. 4.

Ty5 insertions near verified ORFs. The X dimension represents position in and around verified ORFs. To account for ORFs of different lengths, the region within the ORFs was scaled as a percentage of ORF length. Datasets were smoothed and scaled for easy comparison. As a result of scaling, all units are arbitrary, and the integrals of all curves are equal.
One hypothesis to explain local Ty5 integration patterns is that there is a host protein like Sir4 that acts as a positive targeting determinant, drawing Ty5 insertions to promoter regions. To assess whether Sir4 itself contributes to local integration patterns, we evaluated a large dataset of Ty5 insertions recovered from a Δsir4 strain. These insertions where generated to establish baseline patterns of Ty5 integration for calling card experiments (27). A given transcription factor can be made into a Ty5 calling card by fusing it to the domain of Sir4 that interacts with Ty5 IN (28). Ty5 insertion sites in yeast strains expressing the calling cards identify chromosomal sites occupied by the transcription factor. We treated Ty5 insertions in the Δsir4 strain as chromosomal features and evaluated their association with insertions generated in WT strains using logistic regression. The Ty5 insertions in Δsir4 showed a significant positive association with insertions generated in WT in both euchromatin (AUC-0.5 = 0.24) and heterochromatin (AUC-0.5 = 0.16) (Fig. 2). Insertion sites in both strains were correlated (assuming 1-kb windows; Spearman ρ = 0.255, P < 2.2e-16). This finding is evidenced in Fig. 4, where insertions in Δsir4 are mapped relative to ORFs. Secondary targeting patterns, therefore, are not caused by Sir4, and if a different positive targeting determinant is responsible, it remains elusive.
An alternative hypothesis to explain secondary targeting patterns is that insertion hotspots simply reflect sites accessible to the Ty5 integration complex. This hypothesis is consistent with DNase hypersensitivity being the strongest positive predictor of Ty5 integration sites in both heterochromatin and euchromatin (Fig. 2). Recently, a large number of insertion sites were recovered in yeast using the Hermes DNA transposon from housefly (29). Like Ty5, Hermes strongly prefers nucleosome-free regions. The Hermes dataset proved to be the second best predictor of Ty5 integration sites in both euchromatin (AUC-0.5 = 0.24) and heterochromatin (AUC-0.5 = 0.19) (Fig. 2). Correspondence between Hermes insertions and Ty5 insertions in WT and Δsir4 strains can be visualized on a genome-wide level (Fig. 1 and Fig. S1) and at select euchromatic sites (Fig. S3). As with the Ty5 insertions in Δsir4, the distribution of Hermes insertions is correlated with the distribution of Ty5 insertions in WT (assuming 1-kb windows; Spearman ρ = 0.257, P < 2.2e-16). One explanation for the similarity in integration patterns of Hermes and Ty5 in WT and Δsir4 strains is that these preferred sites represent open chromatin where these mobile elements can gain access to DNA. This explanation is also supported by the observation that Ty5 insertion sites are most positively associated with sites of DNase hypersensitivity and by our multidimensional model (Fig. S2), which produces an AUC-0.5 of 0.30 using only features associated with open DNA. Access to DNA, therefore, is likely the basis for the secondary target site bias of Ty5.
Discussion
The ability to recover large numbers of transposable element insertions using high-throughput DNA sequencing technologies provides a powerful means to understand mechanisms underlying target site choice. Complementing the robust and quantitative measures of target specificity afforded by this approach is the wealth of genome-wide information that makes it possible to discern associations between mobile element insertions and specific chromosomal features. Pioneering work in this regard was performed with HIV, in which associations between insertion sites and various chromosomal features were assessed by computational approaches, including logistic regression (30, 31). We adopted a similar approach with our dataset of over 14,000 Ty5 insertions and the extensive genome-wide datasets available for S. cerevisiae. One additional advantage of applying this approach in a model organism like yeast is that insertions can be readily recovered in various mutant backgrounds (e.g., Δsir4). The additional use of genetic resources available for S. cerevisiae will undoubtedly lead to new insights into mechanisms by which Ty5 and other yeast transposable elements select chromosomal integration sites.
Our genome-wide analysis reinforced what was previously known about the primary target site preference of Ty5, namely that insertions predominantly occur in domains of heterochromatin. To our surprise, however, we did not observe a tight association between sites of Ty5 integration and Sir4 occupancy; rather, insertions occurred throughout subtelomeric domains, including regions largely devoid of Sir4. Our 2D view of the genome and Sir4 occupancy, however, most certainly belies the actual architecture of subtelomereic regions. We believe that much of the subtelomeric DNA is actually within close proximity to sites enriched in Sir4 (Fig. 5); therefore, after the Ty5 IN/Sir4 tether is established, integration can occur throughout the subtelomeric region. Alternatively, Ty5 IN could be loaded onto heterochromatin by Sir4 and then scan the subtelomeric regions for target sites.
Fig. 5.

A model describing the primary and secondary target site biases of Ty5. Ty5 IN interacts with Sir4, which localizes the integration complex to heterochromatin. This interaction results in the primary target site bias of Ty5, namely the association of ∼75% of Ty5 insertions with domains of heterochromatin. The secondary target site bias of Ty5 is determined by DNA access. Sites in heterochromatin are chosen for being nucleosome-free and accessible to the integration complex. Access to DNA also dictates the preferred integration sites of Ty5 in euchromatin, resulting in integration primarily in nucleosome-free regions flanking genes.
Ty5 integration patterns provide a readout for boundaries of heterochromatin on the yeast chromosomes. Probing chromatin is not a new role for Ty5, because changes in integration patterns have previously documented the chromatin dynamics that occur during aging, particularly the movement of Sir4 from the telomeres to the rDNA (32). In addition, the recently developed calling card approach cleverly uses Ty5's ability to mark chromosomal occupancy of proteins (28). Ty5 calling cards are created by fusing the domain of Sir4 that interacts with Ty5 to a transcription factor, and Ty5 insertions mark chromosomal sites where the transcription factor is bound. Because many retroelements recognize specific chromatin features during integration, retroelements may increasingly prove to be valuable probes of chromatin dynamics.
Regardless of whether Ty5 integrates into euchromatin or heterochromatin, the chromosomal features influencing Ty5 target site choice were remarkably consistent. Ty5 insertions were associated with DNase hypersensitive, nucleosome-free sites, and other features linked to transcription—a pattern that we refer to as the secondary target bias of Ty5. On average, Ty5 insertions peak in nucleosome-free windows ∼100 bp upstream and downstream of coding sequences. A very similar pattern is observed for insertions generated in a Δsir4 strain, indicating that this secondary target site bias is not caused by Sir4. Hermes, a completely unrelated DNA transposon from the housefly, has an integration pattern correlated to that of Ty5. Hermes is not adapted to life in its heterologous host and uses a very different enzyme to catalyze integration into the yeast genome. Hermes insertion sites, therefore, likely identify open chromatin, and this finding is consistent with their correlation with DNase hypersensitive sites (Spearman ρ = 0.715, P < 2.2e-16). We believe that, based on the data at hand, the most parsimonious explanation of the secondary target site bias of Ty5 is that it is dictated by accessibility of the Ty5 integration complex to DNA.
Secondary targeting patterns are not without consequence for genome structure and evolution. One consequence of integrating into nucleosome-free sites is that coding regions are often avoided, thereby limiting a negative consequence of transposition, namely insertional mutagenesis. It has been argued that heterochromatin, because it is gene-poor, provides a safe haven for Ty5 integration that minimizes deleterious consequences of transposition (33). It may be that integration into open chromatin provides an additional mechanism to avoid genes. That said, insertions in promoter regions likely have consequences for the regulation of adjacent genes, which could have important evolutionary outcomes. Our proposed mechanism underlying the secondary target bias of Ty5 may underlie well-established associations between other mobile genetic elements and promoter regions (6, 34, 35). Clearly, the discovery and initial characterization of the secondary target site bias of Ty5 as reported here reinforces the importance of chromatin in dictating retroelement target site choice.
Materials and Methods
Recovery of Ty5 Insertions.
Ty5 transposition assays were performed as previously described using the haploid and diploid strains YPH499 and YPH501, respectively (15). The donor Ty5 plasmid was pNK254, which contains a galactose-inducible Ty5 element with a marker gene to detect transposition. Each Ty5 transposition assay gave rise to a pool of ∼25,000 Ty5 integrants. Genomic DNA was prepared from the pools and treated with two sets of restriction enzymes, AciI/TaqI and MspI/HinplI (Fig. S4). Linker-mediated amplification of integration sites was performed using the protocol found in the work by Ciuffi et al. (36). Digested DNA was ligated to a linker made up of two oligonucleotides, DVO4621 and DVO4622 (Table S2 shows linker sequences). To prevent amplification of the 5′ LTR, DNA samples treated with AciI/TaqI were digested with AseI; samples treated with MspI/HinplI were digested with EcoRI. The first round of PCR amplification used the Ty5 LTR-specific primer DVO495 and the linker-specific primer DVO4632. The second round of PCR amplification used DVO4665 and one of several barcoded Ty5 LTR primers (DVO4666–DVO4681) (Table S2). PCR products were gel-purified, and fragments between 100 and 500 bp were sequenced using a 454 GLX sequencer.
Random Control Insertions.
A total of 19,934 control insertions were produced in silico for euchromatin and 7,034 were produced for heterochromatin. Each control insertion was the product of three random values: a restriction site value, a position value, and an orientation value. These values select, respectively, a restriction site in the genome, a distance away from the restriction site, and an orientation for the control insertion. The probability distribution function for a control insertion's position and orientation was calculated as the normalized frequency of recovered insertions relative to the restriction sites used in recovery. Control insertions were made to be disjointed from known insertion sites. This process resulted in a set of control insertions with restriction bias similar to that of the recovered insertions.
Data Annotation and Analysis.
Logistic regression was used to identify discriminative features for integration (Table S1). Regression models were trained using the glm log-linear regression function in the R statistical package (37, 38). Our implementation compared the sites of observed integration (case) with a random subset of the sites without integrations (control). Logistic regression fits the equation (Eq. 1)
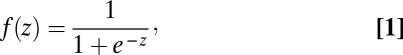 |
where  is the class prediction and z is a linear function,
  , of the levels
  of the n chromosomal features.
Predictions from a logistic regression fall within the interval (0, 1), with proximity to the endpoints indicating greater certainty of a class designation. This information was used to produce a ROC curve, a plot of the true-positive rate vs. the false-positive rate parameterized on a discrimination threshold. An area under a ROC curve (AUC-ROC or AUC) of 0.5 indicates a model with no predictive power, whereas an AUC of 1.0 indicates perfect prediction. All AUC data presented herein are in the form of an AUC-0.5, where negative values indicate features showing a greater association with the control dataset.
Supplementary Material
Acknowledgments
We thank H. Wang, D. Mayhew, and R. Mitra for making data available before publication. We thank R. Bushman and N. Milani for advice on data processing and statistical approaches.
Footnotes
The authors declare no conflict of interest.
This article is a PNAS Direct Submission. J.C. is a guest editor invited by the Editorial Board.
This paper results from the Arthur M. Sackler Colloquium of the National Academy of Sciences, “Telomerase and Retrotransposons: Reverse Transcriptases That Shaped Genomes” held September 29 and 30, 2010, at the Arnold and Mabel Beckman Center of the National Academies of Sciences and Engineering in Irvine, CA. The complete program and audio files of most presentations are available on the NAS Web site at www.nasonline.org/telomerase_and_retrotransposons.
This article contains supporting information online at www.pnas.org/lookup/suppl/doi:10.1073/pnas.1103665108/-/DCSupplemental.
References
- 1.Ciuffi A, Bushman FD. Retroviral DNA integration: HIV and the role of LEDGF/p75. Trends Genet. 2006;22:388–395. doi: 10.1016/j.tig.2006.05.006. [DOI] [PubMed] [Google Scholar]
- 2.Bushman FD. Targeting survival: Integration site selection by retroviruses and LTR-retrotransposons. Cell. 2003;115:135–138. doi: 10.1016/s0092-8674(03)00760-8. [DOI] [PubMed] [Google Scholar]
- 3.Sandmeyer S. Integration by design. Proc Natl Acad Sci USA. 2003;100:5586–5588. doi: 10.1073/pnas.1031802100. [DOI] [PMC free article] [PubMed] [Google Scholar]
- 4.Cherepanov P, et al. HIV-1 integrase forms stable tetramers and associates with LEDGF/p75 protein in human cells. J Biol Chem. 2003;278:372–381. doi: 10.1074/jbc.M209278200. [DOI] [PubMed] [Google Scholar]
- 5.Ciuffi A, et al. A role for LEDGF/p75 in targeting HIV DNA integration. Nat Med. 2005;11:1287–1289. doi: 10.1038/nm1329. [DOI] [PubMed] [Google Scholar]
- 6.Guo Y, Levin HL. High-throughput sequencing of retrotransposon integration provides a saturated profile of target activity in Schizosaccharomyces pombe. Genome Res. 2010;20:239–248. doi: 10.1101/gr.099648.109. [DOI] [PMC free article] [PubMed] [Google Scholar]
- 7.Leem YE, et al. Retrotransposon Tf1 is targeted to Pol II promoters by transcription activators. Mol Cell. 2008;30:98–107. doi: 10.1016/j.molcel.2008.02.016. [DOI] [PMC free article] [PubMed] [Google Scholar]
- 8.Majumdar A, Chatterjee AG, Ripmaster TL, Levin HL. Determinants that specify the integration pattern of retrotransposon Tf1 in the fbp1 promoter of Schizosaccharomyces pombe. J Virol. 2011;85:519–529. doi: 10.1128/JVI.01719-10. [DOI] [PMC free article] [PubMed] [Google Scholar]
- 9.Chalker DL, Sandmeyer SB. Ty3 integrates within the region of RNA polymerase III transcription initiation. Genes Dev. 1992;6:117–128. doi: 10.1101/gad.6.1.117. [DOI] [PubMed] [Google Scholar]
- 10.Devine SE, Boeke JD. Integration of the yeast retrotransposon Ty1 is targeted to regions upstream of genes transcribed by RNA polymerase III. Genes Dev. 1996;10:620–633. doi: 10.1101/gad.10.5.620. [DOI] [PubMed] [Google Scholar]
- 11.Yieh L, Hatzis H, Kassavetis G, Sandmeyer SB. Mutational analysis of the transcription factor IIIB-DNA target of Ty3 retroelement integration. J Biol Chem. 2002;277:25920–25928. doi: 10.1074/jbc.M202729200. [DOI] [PubMed] [Google Scholar]
- 12.Yieh L, Kassavetis G, Geiduschek EP, Sandmeyer SB. The Brf and TATA-binding protein subunits of the RNA polymerase III transcription factor IIIB mediate position-specific integration of the gypsy-like element, Ty3. J Biol Chem. 2000;275:29800–29807. doi: 10.1074/jbc.M003149200. [DOI] [PubMed] [Google Scholar]
- 13.Zou S, Voytas DF. Silent chromatin determines target preference of the Saccharomyces retrotransposon Ty5. Proc Natl Acad Sci USA. 1997;94:7412–7416. doi: 10.1073/pnas.94.14.7412. [DOI] [PMC free article] [PubMed] [Google Scholar]
- 14.Zou S, Kim JM, Voytas DF. The Saccharomyces retrotransposon Ty5 influences the organization of chromosome ends. Nucleic Acids Res. 1996;24:4825–4831. doi: 10.1093/nar/24.23.4825. [DOI] [PMC free article] [PubMed] [Google Scholar]
- 15.Zou S, Ke N, Kim JM, Voytas DF. The Saccharomyces retrotransposon Ty5 integrates preferentially into regions of silent chromatin at the telomeres and mating loci. Genes Dev. 1996;10:634–645. doi: 10.1101/gad.10.5.634. [DOI] [PubMed] [Google Scholar]
- 16.Xie W, et al. Targeting of the yeast Ty5 retrotransposon to silent chromatin is mediated by interactions between integrase and Sir4p. Mol Cell Biol. 2001;21:6606–6614. doi: 10.1128/MCB.21.19.6606-6614.2001. [DOI] [PMC free article] [PubMed] [Google Scholar]
- 17.Gai X, Voytas DF. A single amino acid change in the yeast retrotransposon Ty5 abolishes targeting to silent chromatin. Mol Cell. 1998;1:1051–1055. doi: 10.1016/s1097-2765(00)80105-7. [DOI] [PubMed] [Google Scholar]
- 18.Zhu Y, Dai J, Fuerst PG, Voytas DF. Controlling integration specificity of a yeast retrotransposon. Proc Natl Acad Sci USA. 2003;100:5891–5895. doi: 10.1073/pnas.1036705100. [DOI] [PMC free article] [PubMed] [Google Scholar]
- 19.Zill OA, Scannell D, Teytelman L, Rine J. Co-evolution of transcriptional silencing proteins and the DNA elements specifying their assembly. PLoS Biol. 2010;8:e1000550. doi: 10.1371/journal.pbio.1000550. [DOI] [PMC free article] [PubMed] [Google Scholar]
- 20.Rehman MA, Yankulov K. The dual role of autonomously replicating sequences as origins of replication and as silencers. Curr Genet. 2009;55:357–363. doi: 10.1007/s00294-009-0265-7. [DOI] [PubMed] [Google Scholar]
- 21.Louis EJ, Haber JE. The structure and evolution of subtelomeric Y’ repeats in Saccharomyces cerevisiae. Genetics. 1992;131:559–574. doi: 10.1093/genetics/131.3.559. [DOI] [PMC free article] [PubMed] [Google Scholar]
- 22.Zhu X, Gustafsson CM. Distinct differences in chromatin structure at subtelomeric X and Y’ elements in budding yeast. PLoS One. 2009;4:e6363. doi: 10.1371/journal.pone.0006363. [DOI] [PMC free article] [PubMed] [Google Scholar]
- 23.Lee W, et al. A high-resolution atlas of nucleosome occupancy in yeast. Nat Genet. 2007;39:1235–1244. doi: 10.1038/ng2117. [DOI] [PubMed] [Google Scholar]
- 24.Li B, et al. Preferential occupancy of histone variant H2AZ at inactive promoters influences local histone modifications and chromatin remodeling. Proc Natl Acad Sci USA. 2005;102:18385–18390. doi: 10.1073/pnas.0507975102. [DOI] [PMC free article] [PubMed] [Google Scholar]
- 25.Cherry JM, et al. Genetic and physical maps of Saccharomyces cerevisiae. Nature. 1997;387(6632 Suppl):67–73. [PMC free article] [PubMed] [Google Scholar]
- 26.Pokholok DK, et al. Genome-wide map of nucleosome acetylation and methylation in yeast. Cell. 2005;122:517–527. doi: 10.1016/j.cell.2005.06.026. [DOI] [PubMed] [Google Scholar]
- 27.Wang H, Mayhew D, Chen X, Johnston M, Mitra RD. Calling Cards enable multiplexed identification of the genomic targets of DNA-binding proteins. Genome Res. 2011;21:748–755. doi: 10.1101/gr.114850.110. [DOI] [PMC free article] [PubMed] [Google Scholar]
- 28.Wang H, Johnston M, Mitra RD. Calling cards for DNA-binding proteins. Genome Res. 2007;17:1202–1209. doi: 10.1101/gr.6510207. [DOI] [PMC free article] [PubMed] [Google Scholar]
- 29.Gangadharan S, Mularoni L, Fain-Thornton J, Wheelan SJ, Craig NL. DNA transposon Hermes inserts into DNA in nucleosome-free regions in vivo. Proc Natl Acad Sci USA. 2010;107:21966–21972. doi: 10.1073/pnas.1016382107. [DOI] [PMC free article] [PubMed] [Google Scholar]
- 30.Berry C, Hannenhalli S, Leipzig J, Bushman FD. Selection of target sites for mobile DNA integration in the human genome. PLoS Comput Biol. 2006;2:e157. doi: 10.1371/journal.pcbi.0020157. [DOI] [PMC free article] [PubMed] [Google Scholar]
- 31.Wang GP, Ciuffi A, Leipzig J, Berry CC, Bushman FD. HIV integration site selection: Analysis by massively parallel pyrosequencing reveals association with epigenetic modifications. Genome Res. 2007;17:1186–1194. doi: 10.1101/gr.6286907. [DOI] [PMC free article] [PubMed] [Google Scholar]
- 32.Zhu Y, Zou S, Wright DA, Voytas DF. Tagging chromatin with retrotransposons: Target specificity of the Saccharomyces Ty5 retrotransposon changes with the chromosomal localization of Sir3p and Sir4p. Genes Dev. 1999;13:2738–2749. doi: 10.1101/gad.13.20.2738. [DOI] [PMC free article] [PubMed] [Google Scholar]
- 33.Boeke JD, Devine SE. Yeast retrotransposons: Finding a nice quiet neighborhood. Cell. 1998;93:1087–1089. doi: 10.1016/s0092-8674(00)81450-6. [DOI] [PubMed] [Google Scholar]
- 34.Bellen HJ, et al. The BDGP gene disruption project: Single transposon insertions associated with 40% of Drosophila genes. Genetics. 2004;167:761–781. doi: 10.1534/genetics.104.026427. [DOI] [PMC free article] [PubMed] [Google Scholar]
- 35.Liu S, et al. Mu transposon insertion sites and meiotic recombination events co-localize with epigenetic marks for open chromatin across the maize genome. PLoS Genet. 2009;5:e1000733. doi: 10.1371/journal.pgen.1000733. [DOI] [PMC free article] [PubMed] [Google Scholar]
- 36.Ciuffi A, et al. Integration site selection by HIV-based vectors in dividing and growth-arrested IMR-90 lung fibroblasts. Mol Ther. 2006;13:366–373. doi: 10.1016/j.ymthe.2005.10.009. [DOI] [PubMed] [Google Scholar]
- 37.R Development Core Team . Vienna: R Foundation for Statistical Computing; 2008. R: A language and environment for statistical computing. Available at http://www.R-project.org. Accessed February 2011. [Google Scholar]
- 38.Friedman J, Hastie T, Tibshirani R. Regularization paths for generalized linear models via coordinate descent. J Stat Softw. 2010;33:1–22. [PMC free article] [PubMed] [Google Scholar]
Associated Data
This section collects any data citations, data availability statements, or supplementary materials included in this article.