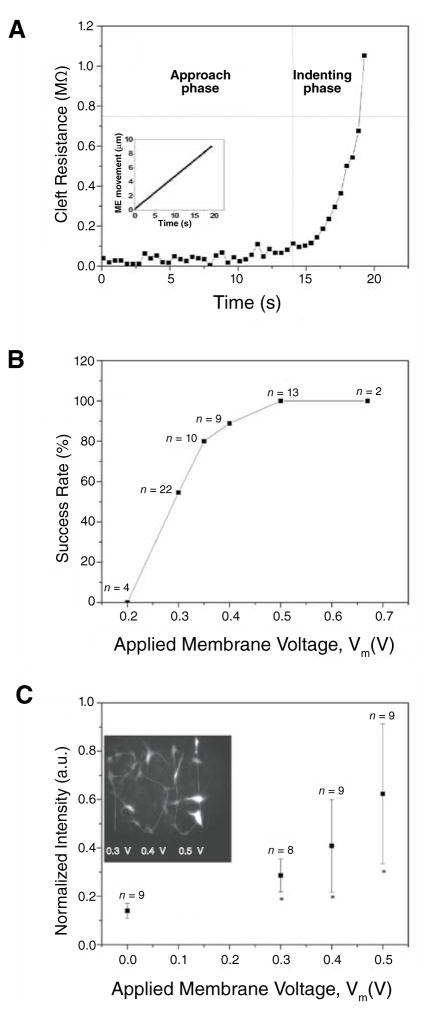
Figure 2. Electroporation degree and efficiency.
(A) Cleft resistance (Rcl) versus time; Rcl was stable during approach phase, then sharply increased when micropipet electrode (ME) touched and indented the cell membrane. Indentation improves pipet sealing by the membrane. Horizontal dashed line indicates Rcr. Inset: ME movement as a function of time. (B) Electroporation success rate versus applied membrane voltage (Vm). Success was achieved when cell fluorescence was 2 sd above cellular intrinsic fluorescence; success ratio increased as Vm increased; 90% success rate was achieved with Vm = 0.4 V. (C) Inserted BODIPY FL-GTP intensity versus applied Vm; cells were selected individually using Vm of 0.3, 0.4, and 0.5 V for cells marked by P, S, and U, respectively. Inserted dye intensity was highly dependent on Vm. Cell viability was confirmed by calcein staining, phase microscopy, and absence of electroporation-induced vesicles, dye leakage, or membrane bleb formation. * Indicates significant difference from average cell intrinsic fluorescence as determined by analysis of variance (ANOVA) and a Student’s t-test (P < 0.01). a.u., arbitrary units.

