Abstract
This paper presents a feasibility study for using two new imaging geometries for synchrotron X-ray fluorescence emission tomography (XFET) applications. In the proposed approaches, the object is illuminated with synchrotron X-ray beams of various cross-sectional dimensions. The resultant fluorescence photons are detected by high-resolution imaging-spectrometers coupled to collimation apertures. To verify the performance benefits of the proposed methods over the conventional line-by-line scanning approach, we have used both Monte Carlo simulations and an analytical system performance index to compare several different imaging geometries. This study has demonstrated that the proposed XFET approach could lead to a greatly improved imaging speed, which is critical for making XFET a practical imaging modality for a wide range of applications.
Keywords: synchrotron radiation, X-ray fluorescence emission tomography (XFET)
I. Introduction
X-ray fluorescence techniques are widely used for elemental analysis. These technques offer excellent sensitivity to trace elements, down to the picogram level. Tomographic studies of volumetric samples using X-ray fluorescence computed tomography were first proposed by Boisseau et al. [1]. The topic was subsequently studied by many researchers, including Cesareo et al. [2], Hogan et al. [3], Takeda et al. [4–6], Simionovici et al. [7], Kanngiesser et al. [8], Janssens et al. [9], Golosio et al. [10], Schroer et al. [11] and so on. In recent years, modern synchrotron X-ray sources have been widely used in X-ray fluorescence computed tomography (XFCT) studies, which allows for microscopic mapping of elemental distributions with spatial resolution down to sub-micron level [12–16]. In a typical XFCT study, a pencil-beam of synchrotron X-rays is used to illuminate the object, causing the emission of fluorescent X-rays from the elements contained in the sub-volume covered by the beam. This geometry is shown in Fig. 1 (a). The resultant fluorescence photons are collected by a non-position-sensitive spectrometer. In this approach, the object must be scanned and rotated through the beam to obtain sufficient data for 3-D reconstruction. As an alternative approach, confocal geometries have also been explored. Chukalina et al. have reported an analytical evaluation of XCFT with a converging aperture system [17]. Woll et al. [18] and Vekemans et al. [19] have reported the use of polycapillary X-ray optics for confocal fluorescence X-ray microscopy. Like the line-by-line scanning scheme, these methods rely on scanning the focal-spot point-by-point through the volume (or surface) of interest to obtain a spatial mapping of trace elements. Despite the excellent imaging performance demonstrated in these studies, the need for mechanical scanning procedures typically leads to long data acquisition times for 3-D imaging studies, which limits the throughput of XFCT studies at existing synchrotron X-ray facilities.
Fig. 1.
Three different imaging modes compared in this study.
To overcome this hurdle for current XFCT methods, we have proposed and evaluated an alternative approach. In this new approach, the object is irradiated by either a parallel-beam or a pencil-beam of synchrotron X-rays. Fluorescence photons emitted from the object are collected by a detection system consisting of position-sensitive X-ray spectrometers coupled to collimation apertures. Since the new geometries rely on image-formation techniques similar to that used in emission tomography (ET) [20–28], we will refer the proposed imaging approach to as X-ray fluorescence emission tomography (XFET) throughout this text. Compared to the conventional line-by-line scanning approach, the proposed XFET approach, in general, has lower detection efficiency (due to the use of collimators for image formation), but provides more imaging information per detected photon. The amount of imaging information provided by each detected photon is determined based on the number of potential source voxels that could initiate the given detection. When comparing two geometries, if each photon detected with geometry #1 is associated with a smaller average number of potential source voxels, we would state that this geometry provides more imaging information per detected photon. This notation is used throughout this text. Through this study, we will show that the XFET approach could offer an improved tradeoff between these two factors, and therefore lead to a dramatically improved imaging speed.
We will demonstrate the performance benefits of the XFET approach in two ways. First, different approaches will be compared qualitatively based on the visual appearance of images generated through Monte Carlo simulations. Second, we will use an analytical approach to evaluate the optimum resolution-variance tradeoffs attainable with different imaging approaches. This study provides a quantitative assessment on how much the proposed approaches could speed up XFCT studies.
II. Material and Methods
A. XFCT with the Conventional Geometry
Conventional XFCT studies involve the use of a pencil-beam of synchrotron X-rays to scan the object line by line. The fluorescence photons emitted from the narrow strip of volume, covered by the synchrotron beam, are collected with a non-position-sensitive X-ray spectrometer. The number of fluorescence photons detected at a given beam position provides a line-integral of fluorescence X-ray emission from the volume irradiated (after corrections for the attenuation of both incident and fluorescent photons). 3-D distribution of trace elements can be reconstructed using modified filtered backprojection (FBP) or (penalized) maximum-likelihood (ML) algorithms [3, 13, 29–32]. As previously emphasized, one of the major limitations of this approach is the very long imaging time typically required for 3-D imaging studies.
B. XFET with Multiple-Pinhole Apertures
To speed up XFCT studies, we have proposed two new geometries that are shown as Modes 2, 3 in Fig. 1. In Mode 2 geometry, the object is scanned by a thin sheet-beam of synchrotron photons. Fluorescence X-rays emitted by the object are collected by a detection system that consists of several X-ray imaging-spectrometers, each coupled to a multiple-pinhole aperture. Note that the detectors should have a very-high energy resolution (typically a few hundred electron-volts) to distinguish fluorescence X-rays from different elements and to separate the fluorescence X-rays from scattered synchrotron X-rays. The transmission image could be obtained, with a separate measurement, by placing an X-ray detector against the synchrotron beam and by rotating the object as in typical transmission X-ray CT imaging studies. This allows for an accurate measure of the attenuation of synchrotron X-rays in the object.
The difference between the imaging performances offered by Modes 1 and 2 comes from the interplay of three factors. First, compared to Mode 1, Mode 2 delivers a much greater amount of imaging information per detected fluorescence photon. Second, the use of multiple pinhole apertures in Mode 2 severely reduces the detection efficiency and results in relatively poor counting statistics. Third, Mode 2 uses a sheet-beam, rather than a pencil-beam, of X-rays to irradiate a slice of volume through the object. Given a fixed synchrotron X-ray intensity (photons per cm2 per second), this geometry typically produces a much stronger signal – more fluorescence photons emitted by the object per second than in Mode 1. This helps to offset its lower detection efficiency.
One of the problems of Mode 2 is its limited resolution capability. Although small pinholes could be used to achieve a high resolution, the sensitivity of the system typically goes down with the square of pinhole diameter. If pinholes of a few microns in diameter were to be used to achieve imaging resolutions similar to those available with Mode 1, the geometrical detection efficiency would be so low that requires an even longer imaging time (than that needed by Mode 1) to obtain a sufficient counting statistic, which simply defeats the purpose of using XFET approaches.
C. XFET with Multiple-Slit Apertures
To improve the resolution capability of XFET, one could use another approach shown as Mode 3 in Fig. 1(c). With this approach, the object is illuminated by a pencil-beam as in Mode 1. Fluorescence photons are collected by position-sensitive detectors coupled to multiple-slit-apertures. The object will be scanned line by line and, in principle, no object rotation is required for 3-D imaging. This leads to a simplified scanning process. However, the attenuation of synchrotron X-rays in the object would lead to a rapidly decreasing X-ray intensity along the beam direction. This could result in an uneven image quality across the object space. If necessary, this problem could be partially alleviated by rotating the object as in Mode 1 (Fig. 1).
Compared to the pinhole-apertures used in Mode 2, the multiple-slit-apertures could offer a greater geometrical efficiency, so that very narrow slits could be used to achieve an excellent spatial resolution. Although the system sensitivity would still be lower than those achievable in Mode 1, the new geometry overcomes this disadvantage by offering more information-content per detected photon. With Mode 3, each detected fluorescence X-ray photon can be traced back to just a few source pixels. By comparison, each photon detected in Mode 1 is associated with as many pixels as those covered by the incident beam. With properly chosen geometries, Mode 3 has the potential of providing a greatly improved imaging speed.
D. Image Reconstruction for FXET
Given the relatively low photon energies involved in XFET studies, it is essential to correct for the attenuation of the stimulating beam as it travels through the sample and for the attenuation of the fluorescence X-rays as they exit the sample in order to obtain qualitatively and quantitatively accurate reconstructed images. For the proposed imaging geometry, the attenuation map for the incident synchrotron X-rays could be obtained from the transmission data. However, the self-attenuation of fluorescence photons by the object is more difficult to derive. To solve this issue, Golosio et al. [30] and LaRiviere [13] explored reconstruction strategies that jointly estimate the distribution of trace-elements and the spatially-variant attenuation coefficient for fluorescence photons. To ensure the algorithm to seek out a reasonable local maximum, the algorithm developed in [13] included (in the objective function) an imaging prior. It encourages a relationship (based on physical considerations) between the fluorescence attenuation map and the distribution of the element being reconstructed. Examples of reconstructed images using this approach can be found in [13]. This method could be adapted to the new XFET geometries proposed here.
E. Feasibility Studies with Monte Carlo Simulations
The three imaging modes were first compared qualitatively based on the visual appearances of images generated through Monte Carlo simulation. We used GEANT 4 [33] to model X-ray transport, and used a recently developed simulation package [21, 34, 35] to model the responses of the detection systems. Many physical factors, such as photoelectric effect, Compton scattering, Rayleigh scattering, and the emission of fluorescence X-rays, were incorporated in this simulation. The polarization of synchrotron X-rays was included to account for the non-isotropic distribution of Compton background. The attenuation of both synchrotron and fluorescence X-rays were modeled in this study. A comparison between simulated and measured fluorescence X-ray spectra is shown in Fig. 2. Note that the measurement was performed based on an X-ray CCD detector that was read out at 0.5 frames/second. In the measured spectrum, the lower-energy tail is due to partial collection of ionizing charge from x-ray interactions. This effect was not modeled in the simulation. Furthermore, as shown in Fig. 2, the probability of synchrotron X-rays being scattered then mistakenly collected as fluorescence photon is relatively low. First, at the low photon energies (below 15 keV), the energy-loss due to Compton scattering is very small. It requires several consecutive Compton scattering for a photon of 15 keV to be moderated to have a remaining energy similar to those for fluorescence photons (12 keV or lower). Second, the excellent energy resolution of direction detection CCD detectors (typically a few hundred eV) allows for an effective rejection of scattered photons. Therefore, we have ignored this effect in subsequent Monte Carlo studies.
Fig. 2.
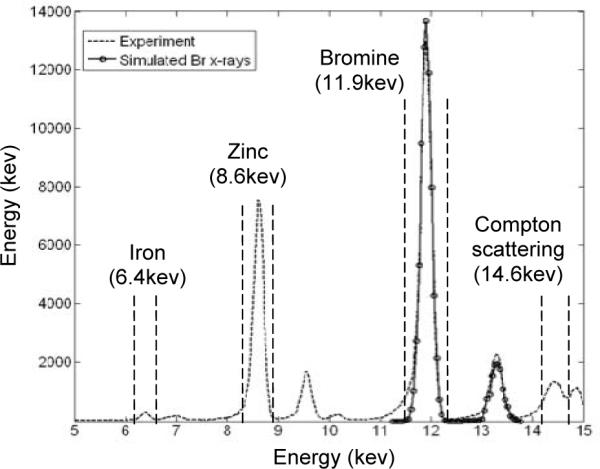
Comparison between measured and simulated Br fluorescence X-ray spectra.
The simulated object is a cylinder of 5 mm in diameter and 5 mm tall. It contains a uniform water solution of bromine with a concentration of 1.24 mg/ml as the background. To evaluate the spatial resolution properties attainable with different imaging modes, three groups of hot-rods and one group of cold-rods were inserted. The diameters of the hot-rods in each group were 0.1 mm, 0.2 mm, 0.3 mm, respectively, and the diameter of the cold rods was 0.4 mm. Within each group, the minimum spacing between the centers of two adjacent rods is twice their diameter. The hot-rods have a fixed bromine concentration of 6.21 mg/ml, and the cold-rods do not contain any bromine. The axis of the cylinder is perpendicular to the beam direction (Fig. 1). A cross section view of the phantom is shown in Fig. 3.
Fig. 3.
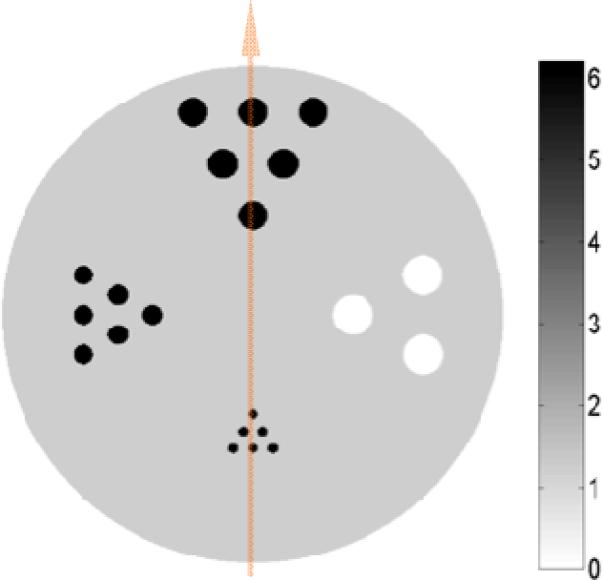
Cross section of the simulated phantom. The vertical line indicates the position of a pencil beam used to irradiate the object. The corresponding fluorescence X-ray projection detected on one of the detectors with a three-silt aperture is shown in Fig. 4.C.
To ensure the same average dose-rate delivered to the object, the intensity of the X-ray beam was ranged from 2×10⁶ to 2.56×10⁸ photons per second per mm2 for different imaging modes. The energy of each synchrotron X-ray photon was fixed at 15 keV. All simulation studies had the same imaging time of 2 hours.
For Mode 1, we have simulated an idealized non-position-sensitive X-ray spectrometer. It had a fixed detection efficiency of 5% for fluorescence photons from the sample and an energy resolution of 250 eV (as we experimentally obtained with a commercial X-ray CCD camera [44]). Note that the extreme incident x-ray flux, typically associated with XFCT studies, leads to a vast number of scattered x-rays from the object. In most of experimental studies, the X-ray detectors are placed relatively far from the object. To reduce the background from scattered photons, the detectors are often shielded to restrict the acceptance angle for incoming photons. Up to our knowledge, the 5% overall sensitivity assumed in this study is significantly higher than the detection efficiencies obtained in previously published experimental studies [4, 5, 14, 15, 30, 36–38].
For Modes 2 and 3, six detectors were simulated in a ring configuration as shown in Fig. 1. Each detector has 512 × 512 pixels of 25 μm × 25 μm in size. The detector has an efficiency of 50% for 10 keV photons and the energy resolution was 250 eV. Bromine fluorescence X-rays were selected with an 1 keV wide energy window, centered at 10 keV. The simulated pinhole apertures were made of a thin sheet of gold of 100 μm thickness. Each pinhole has a perfect knife-edge and an acceptance angle of 120 degrees on both sides. We chose to use the 9 pinhole and 25 pinhole apertures based on the following considerations. First, we would ensure a relatively small amount of overlapping between the individual projections, which follows the trend in aperture designs for modern emission tomography systems. Second, the pinholes are so placed to best utilize the detection area available and to ensure the areas with overlapping distributed uniformly. Therefore, the pinholes are located around 3×3 or 5×5 square patterns. In order to avoid over sampling at a certain spatial frequency, the actual location of each pinhole was randomly moved around the corresponding square grid point by an average distance of 300 microns. Depending on the object to be imaged, there could be plenty of room for further improving the design of pinhole apertures for Mode 2, but this is beyond the scope of the current work.
The slit openings in apertures used in Mode 3 have an acceptance angle of 75 degrees in the plane perpendicular to the central line through the slits. In reality, pinhole and slit openings as simulated here could be produced with electric-discharge machining (EDM) techniques. Examples of simulated projection data are shown in Fig. 4. In this study, the images were reconstructed using the standard MLEM algorithm [39].
Fig. 4.
Fluorescence x-ray projection data obtained with the three imaging modes. The object is a cylinder with features shown in Fig. 3. A: The sinogram obtained with the line-by-line scanning approach (Geom. 1 in Table I).B The projection on shown an X-ray detector in Mode 2 geometry (Table II, Geom. 7). A thin sheet-like synchrotron X-ray beam was used to irradiate the central slice of the object as shown in Fig. 1 (b). The detector is coupled to a nine-pinhole aperture. C: The projections on an X-ray was used to irradiate the object through the center as shown in Fig. 1 (c).
F. Quantitative Comparison
In order to quantify the performance benefits of XFET approaches, e.g., how much the proposed approaches would speed up imaging studies, it is necessary to evaluate the statistical properties (mean and covariance) of reconstructed images attainable with different approaches. In principle, this could be done with brute-force Monte Carlo simulations. But the need for generating many random realizations would lead to a substantial computation load, especially when we have a large number of different imaging geometries to evaluate.
To overcome this difficulty, we have used an analytical solution to approximate the resolution and covariance properties of reconstructed images. This method is based on the modified Cramer-Rao bound (MUCRB) [34, 40] that was developed for system design and optimization purposes. For this application, the MUCRB approach offers two attractive features. First, it greatly reduces the computation load for evaluating the mean and covariance. Second, it provides the minimum imaging noise attainable with a given imaging system, regardless the reconstruction method used. These features make the MUCRB approach well suited for evaluating the proposed XFET geometries.
Here we will briefly introduce this method. We denote by x=[x1, x2, …, xN]T εRN the set of parameters to be estimated through XFET measurements, such as the concentration of a given trace element in each individual voxel. The mapping from x to the projection data y is governed by a conditional probability density function p(y;x). For XFCT studies, y is a collection of random Poisson (or Gaussian) variables that represent the measured numbers of fluorescence X-rays detected on each detector element. The expectation of y is given by the following transform:
| (1) |
where A is the system-response matrix, which is a discrete form of p(y;x), and r denotes extra noise components. Let be an estimator of the underlying distribution of a trace metal, whose mean is
| (2) |
where E[·] denotes the expectation operator. The gradient of the mean estimator is defined as:
| (4) |
It is closely related to the point-spread function (PSF) in the corresponding reconstruction [41]. For a shift-invariant imaging system, the two functions are identical. Therefore, we used the mean gradient vector gj to represent the point-spread function in reconstructed images.
We have demonstrated in [34, 40] that for any estimator with a spatial resolution function gj sufficiently close to a predefined target function fj,
| (5) |
where gj is the point-spread-function at the j'th pixel and γ is a small scalar defining the similarity between the two functions, the minimum variance achievable at the j'th pixel, regardless of the estimator used, is given by
| (6) |
where J is the Fisher information matrix (FIM) [42] and λ is a scalar constant. The actual mean-gradient function (or point-spread function) of the estimator(s) that achieve the minimum variance (6) is given by
| (7) |
Eqs. (6) and (7) are the key results that will be used for this study. These solutions give the minimum variance attainable with a given imaging system (or geometry), under the condition that the system delivers an arbitrarily chosen spatial resolution property as specified by vector goptimum (or approximately by fj). Therefore, one can evaluate the optimum tradeoffs between spatial resolution and image variance attainable with any given imaging system (or geometry). This fundamental tradeoff will be used as a performance index to compare XFET geometries.
G. Further Considerations for Quantitative Comparison
To compare different imaging modes, one needs to consider three key factors, image quality, imaging time and radiation dose rate to the object. In this study, different imaging modes were compared based on the intrinsic performance that is defined as the minimum image noise levels attainable at given reconstructed spatial resolutions, while the imaging data is acquired with a fixed imaging time and a fixed average dose-rate delivered during the study.
This approach was chosen for two reasons. First, the intrinsic performance itself is a good indicator of the efficiency of an imaging mode. For studies that have known upper limits on imaging time and radiation dose-rate, the intrinsic performance could be used directly to determine the relative performances of different modes. Second, given the intrinsic performances that we have derived through this study, it is straightforward to evaluate the expected performances of different imaging modes with any arbitrary combination of imaging time and dose-rate tolerance.
For evaluating the intrinsic performance, we have defined the average dose-rate, Davg, as:
| (8) |
For generality, the comparison was performed around three resolution levels of 50 μm, 150 μm and 250 μm respectively. At each resolution level, several geometries were chosen from the three modes, with their physical resolutions close to the target resolution level. The physical resolution of a given geometry is derived based on the Fisher Information matrix (FIM), J, whose elements are given by [42]
| (9) |
where anm's are the elements of the system response matrix A defined in Eq. 1. Each column vector of the FIM, Ji, reveals the weighted correlations between the response of the system to a target-pixel (the i'th pixel) and the responses of the system to other pixels throughout the object-space. One can re-arrange Ji into the 3-D object-space, which is referred to as the i'th Fisher Information Image (FII). The FII has a peak around the i'th pixel and the FWHM of the peak was used as the physical resolution of the geometry around the target pixel.
Based on these considerations, we have chosen three groups of imaging geometries for this comparative study. These are detailed in Tables I–III. For the geometries within each group, we have defined the imaging parameters (the beam dimension and intensity, the number of linear and angular steps, the duration at each step, etc.) to ensure that (a) their corresponding physical resolutions are similar to a target spatial resolution, (b) all studies take the same 2 hour imaging time and (c) all studies lead to the same average dose-rate to the object. This allows us to compare the intrinsic performance of Modes 1–3 for imaging around the three different resolution levels.
Table 1.
Mode 1 and Mode 3 Geometries with Physical Resolutions of Around 50 μm
| Imaging Mode | Detection System | Object Illumination Scheme (Total imaging time: 7200s) | Physical resolution (mm) | Dose-rate (mGy/s) | ||||||
|---|---|---|---|---|---|---|---|---|---|---|
| Aperture | Raw sen. | Flux rate (/sec/mm2) | Beam-size (mm2) | Time per step (s) | Linear steps | Angular steps | ||||
| M1 | G1 |
|
5% | 2.56+08 | 0.04×0.04 | 0.3125 | 128 × 0.04mm | 180 × 2° | 0.065 | 0.452 |
| M3 | G2 |
|
0.29% | 2.56E+08 | 0.04×0.04 | 56.25 | 128 × 0.04mm | 1 | 0.048 | |
| G3 | Aperture: 3-slit, 20 μm, 1.85 mm | 0.44% | ||||||||
| G4 | Aperture: 10-slit, 20 μm, 0.415 mm | 1.49% | ||||||||
| G5 | Aperture: 20-slit, 20 μm, 0.195 mm | 2.99% | ||||||||
Table 3.
Modes 1, 2 and 3 Geometries with Physical Resolutions of Around 200 μm
| Detection System | Object Illumination Scheme (Total imaging time: 7200s) | Phys. reso. (mm) | Dose-rate (mGy/s) | |||||||
|---|---|---|---|---|---|---|---|---|---|---|
| Detector and Aperture | Raw sen. | Flux rate (/sec/mm2) | Beam-size (mm2) | Time per step (s) | Linear steps | Angular steps | ||||
| M1 | G10 |
|
5% | 6.40E+07 | 0.16×0.04 | 1.25 | 32 × 0.16mm | 180 × 2° | 0.22 | 0.452 |
| M2 | G11 | 9 (3×3) pinhole, ∅120 μm, spacing: 3.41 mm | 1.6% | 2.00E+06 | 5.12×0.04 | 7200 | 1 | 1 | 0.23 | |
| M3 | G12 | Aperture: 3-slit, 100 μm, 1.85 mm | 2.18% | 6.40E+07 | 0.16×0.04 | 225 | 32 × 0.16mm | 1 | 0.20 | |
III. Results
A. Radiation Dose-Rate
Fig. 5 shows a comparison between the simulated distributions of radiation dose-rate associated with the three imaging modes (including all the 12 geometries detailed in Tables I–III). As shown in this figure, the rotational scanning in Mode 1 results in an isotropic dose-rate distribution with respect to the rotation axis. By contrast, Modes 2, 3 would lead to dose-rate profiles that decrease from the beam-incident side to the exit side. The averaged dose-rate per pixel within the object of 5-mm diameter ranges from 0.2 mGy/s to 0.8 mGy/s. Similarly, the image quality obtained with the proposed Mode 2 and 3 (without rotating the object) will also be spatially variant. This is due to the attenuation of synchrotron and fluorescence X-rays in the object. An improved uniformity in image quality could be achieved by rotating the object. We did not include object rotation in the following Monte Carlo simulations, but this would be an important practical issue to be explored in future studies.
Fig. 5.
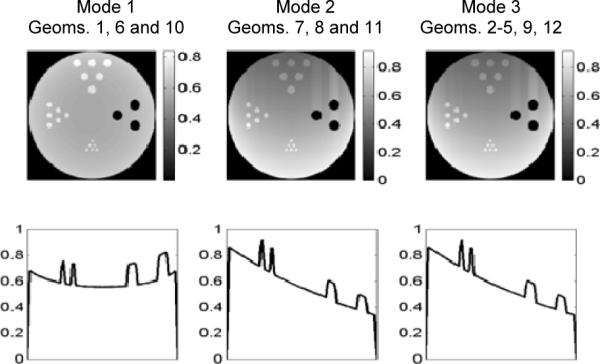
Top panels: 2-D cross-sectional view of the dose-rate distribution (averaged over the entire observation period) in the object. Bottom panels: 1-D cross sections of the profiles across the vertical diameters (y-direction). The unit used in the figures is mGy/s.
Note that all imaging geometries compared will produce a fixed dose-rate of 0.45 mGy/s, averaged over a fixed imaging time of 2 hours. This allows the comparison of different imaging modes based on their intrinsic performance as detailed in Sec. II.G.
B. Comparing Modes 1 and 3 for High Resolution Studies
We first compared Modes 1 and 3 for XFET imaging at spatial resolutions of 50–100 μm. XFET studies with Mode 2 at this resolution level will require apertures having very small pinholes. This would lead to an extremely small sensitivity (10−5–10−6) for the detection system and a long imaging time. Therefore, Mode 2 was not included in this comparison.
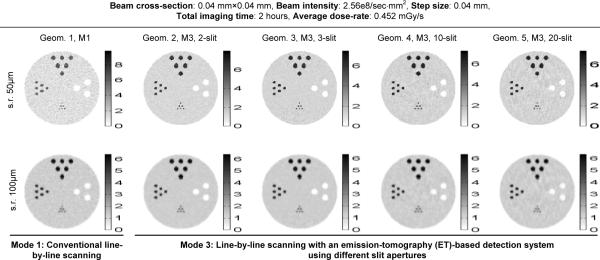
In Fig. 6, we compare several reconstructed images obtained with five geometries in Mode 1 and Mode 3 (as detailed in Table I). These images were reconstructed with the post-filtered MLEM algorithm [39, 43]. The filters used were 3-D Gaussian functions with two different widths, 50 μm (full-width-at-half-maximum) for the images shown in the top row in Fig. 6 and 100 μm for the bottom row. The spatial resolution values at the center of these images were derived and shown in Fig. 7. In this study, we have also derived the variance across 12×12×12 pixels at the center of each reconstructed image, which is used as an indicator of the noise level in the image.
Fig. 6.
Reconstructed images obtained with Mode 1 and Mode 3 geometries. Top row: all images were chosen to have a spatial resolution of around 50 μm (FWHM) at the center. Bottom row: images with spatial resolutions of around 100 μm (FWHM) at the center. The unit used in the figure is mg/ml.
Fig. 7.
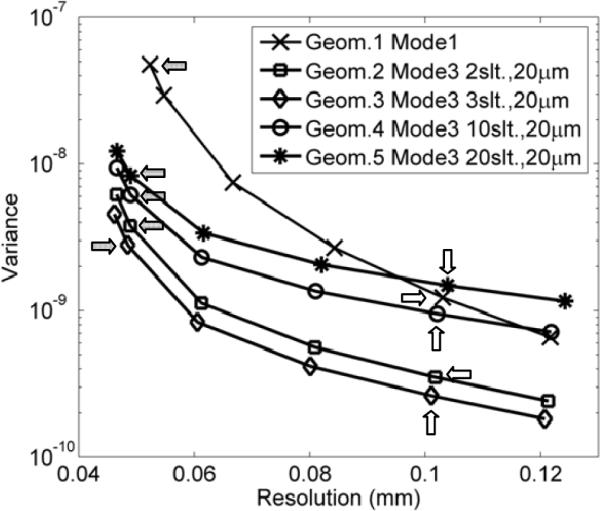
The noise-resolution tradeoff curves obtained with Mode 1 and Mode 3 geometries. The points labeled by arrows indicate the resolution-noise tradeoffs obtained in the reconstructed images shown in Fig. 6. Dark arrows indicate the data points corresponding to reconstructed resolutions of around 50 microns (images in the top row of Fig. 6) and white arrows are corresponding to reconstructed images with around 100 micron spatial resolution (Bottom row in Fig. 6).
In this comparison, Mode 3 geometry with the 3-slit aperture offered the best intrinsic performance – lowest image noise at similar spatial resolutions. As shown in Fig. 4.C, this particular geometry leads to slight overlapping between the projections of the object volume (irradiated by the pencil-beam) through individual slit-openings. This can be visualized by the fact that the two thinner horizontal strips (formed by fluorescence X-rays from the two 0.1 mm diameter hot-rods) are located very closed to the two thicker strips (from the 0.3 mm diameter hot-rods) at the center region of the projection. Without overlapping, these two groups of strips should be well separated given the source-irradiation scheme shown in Fig. 3. By comparison, the 2-slit-aperture does not lead to any overlapping and the 10- and 20-slit-apertures introduce severe overlapping.
Compared to Mode 1 (Geom. 1 in Table I), Mode 3 geometry with the 3-slit-aperture (G3) reduces the variance by a factor of ×25 for images reconstructed with 50 μm resolution. Since the variance is (roughly) inversely proportional to imaging time, we would expect Mode 3 with proper aperture could speed up XFET studies by more than an order of magnitude, without increasing dose-rate. In practice, it is relatively easy to produce slit-apertures with narrower openings, e.g., a few μm in width. Mode 3 would be a natural replacement for Mode 1 for high-resolution XFET studies.
C. Comparing Modes 1–3 with Medium Resolution Geometries
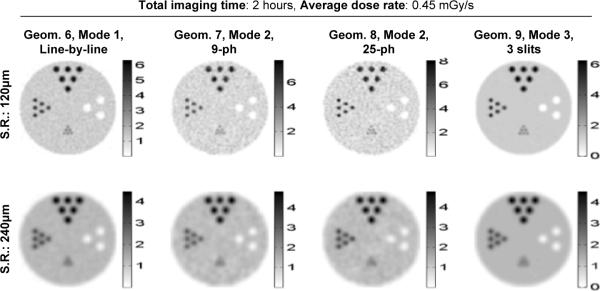
We have also compared several other geometries from all three imaging modes that have their physical resolutions being around 120 μm. Detailed imaging parameters for these geometries are given in Table 2. Note that the intensities of the incident X-ray beam were different for Mode 2 (2×10⁶ photons/sec/mm2) and Mode 3 (2.56×10⁸ photons/sec/mm2) to ensure the same average dose-rate to the object. The images shown in Fig. 8 were reconstructed with the post-filtered MLEM algorithm, using 3-D Gaussian filters of 120 μm and 240 μm in widths. The corresponding resolution-noise curves are given in Fig. 9.
Table 2.
Modes 1 – 3 Geometries with Physical Resolutions of Around 120 μm
| Detection System | Object Illumination Scheme (Total imaging time: 7200s) | Phys. reso. (mm) | Dose-rate (mGy/s) | |||||||
|---|---|---|---|---|---|---|---|---|---|---|
| Detector and Aperture | Raw sen. | Flux rate (/sec/mm2) | Beam-size (mm2) | Time per step (s) | Linear steps | Angular steps | ||||
| M1 | G6 |
|
5% | 1.28E+08 | 0.08×0.04 | 0.625 | 64 × 0.08mm | 180 × 2° | 0.12 | 0.452 |
| M2 | G7 |
|
0.06% | 2.00E+06 | 5.12×0.04 | 7200 | 1 | 1 | 0.12 | |
| G8 | 25 (5×5) pinhole, ∅70 μm, 1.79 mm | 0.15% | ||||||||
| M3 | G9 | Aperture: 3-slit, 60 μm, 1.85 mm | 1.31% | 1.28E+08 | 0.08×0.04 | 112.5 | 64 × 0.08mm | 1 | 0.12 | |
Fig. 8.
Reconstructed images obtained with Modes 1–3 geometries for XFET studies. The geometries (G6–G9 in Table II) were chosen to have a modest physical resolution of around 150 μm. The images were reconstructed at a spatial resolutions 120 μm and 240 μm.
Fig. 9.
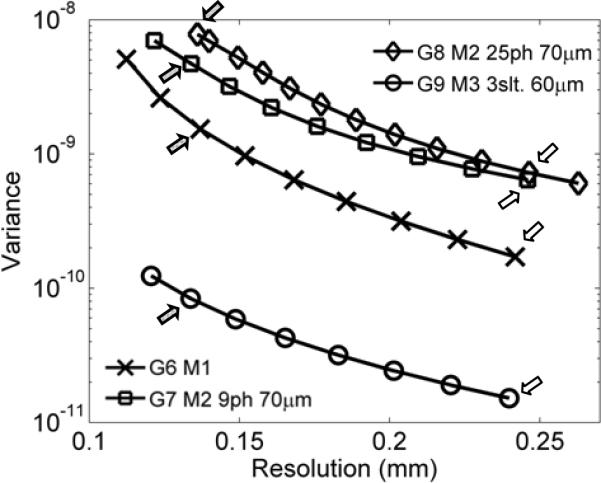
Noise-resolution having modest curves obtained with Modes 1–3 geometries having modest physical resolutions (Table II). The arrows in the figure indicate the operating points corresponding to the reconstructed images shown in Fig. 8.
Since the rationale for comparing different imaging modes is to compare the noise level attainable at similar resolutions, it is important to ensure that all images compared in each row of Fig. 8 have similar resolution properties. This is not easy to verify directly from the visual appearance of the images. In Fig. 10, we plotted the actual point-spread-functions (PSFs) corresponding to these images. Clearly, despite the different image-formation mechanisms underlying Modes 1–3, the post-filtered MLEM reconstructions did produce very similar PSFs and therefore near identical resolution properties.
Fig. 10.
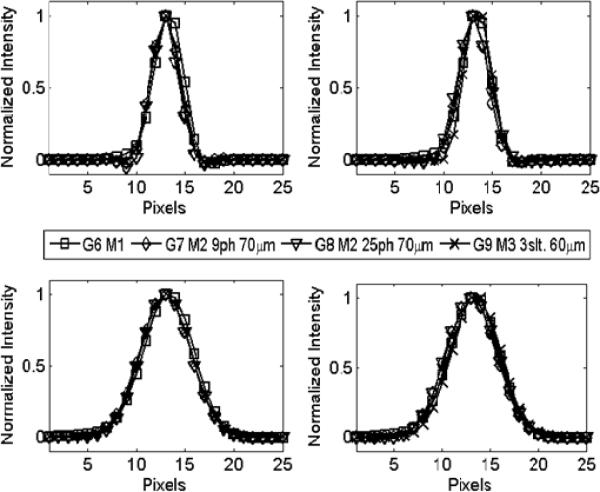
The actual point-spread functions (PSF) achieved in the reconstructed images shown in Fig. 8. Top row: All PSFs have FWHM values close to 120 μm in both X (top left) and Y-directions (top right); Bottom row: PSFs with FWHM values of around 240 μm.
Within the imaging geometries compared in this study, Mode 3 is the most efficient for XFET imaging at resolutions between 120–240 μm. Compared to Mode 1, it offers an order of magnitude reduction in image noise (indicated by variance values). In contrast, Mode 2 consistently produced the poorest intrinsic performance, which is due to the severely reduced detection efficiency associated with this imaging approach.
D. Quantitative Comparisons of Modes 1–3
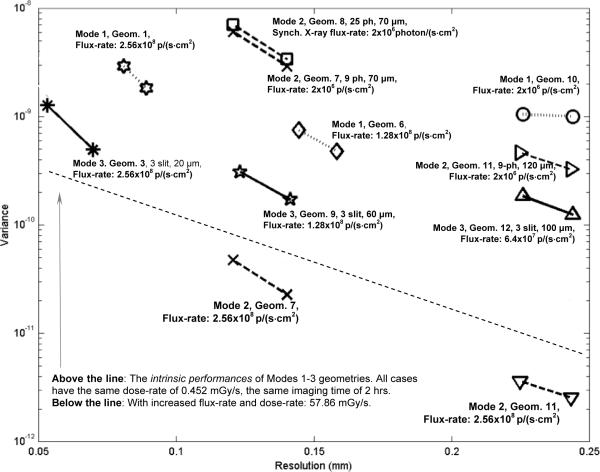
Using Eqs. (6) and (7), we have derived the optimum resolution-variance tradeoff curves attainable with all 12 geometries as detailed in Tables I–III. These geometries were divided into three groups based on their corresponding physical resolutions. The results from this study are shown in Fig. 11. Note that the relative imaging performances of the three imaging modes, derived using the MUCRB approach, agreed very well with previous studies based on reconstructed images (Figs. 6–9).
Fig. 11.
Resolution-variance tradeoffs achieved with Modes 1–3 geometries as detailed in Tables I–III.
Among the imaging geometries compared, Mode 3 offers a greatly improved intrinsic performance over both Mode 1 and Mode 2 – more than an order of magnitude reduction in imaging variance can be achieved with the same imaging time and radiation dose-rate, while offering the same spatial resolution in reconstructed images.
In practice, Mode 2 geometry could offer a further improved imaging speed. This is due to the fact that Mode 2 allows the use of wide parallel or fan beams to irradiate a larger portion of the object. With a fixed beam intensity for all three imaging modes, Mode 2 geometry could produce more fluorescence photons from the sample per unit time. This helps to offset its disadvantage of having the lowest detection-efficiency and could lead to a further improved imaging speed as shown in Fig. 11. However, the increased imaging speed is achieved at the cost of a much greater radiation dose-rate to the object as also shown in Fig. 11.
IV. Conclusions and Discussions
We have proposed and evaluated a novel imaging approach for speeding up XFCT studies. This approach utilizes position-sensitive X-ray spectrometers, coupled to collimation apertures, to detect fluorescence photons from the object. Compared to the conventional line-by-line scanning geometry, the new approach provides more imaging information per detected fluorescence photon, but at the cost of reduced detection efficiency. In this study, we have used Monte Carlo studies and an analytical approach to demonstrate the performance benefits of the new approach.
Mode 3 offers an interesting alternative to the conventional Mode 1 geometry. Its underlying image-formation method provides a different tradeoff between detection efficiency and the imaging information carried by each detected fluorescence photon. Compared to the current XFET setups using Mode 1 geometries and detectors with <5% overall detection efficiency, Mode 3 could provide an order of magnitude improvement in imaging speed without increasing radiation dose-rate. The use of slit-apertures could also offer a reasonable detection efficiency, even with very fine slit widths (down to a few microns). This makes it well suited for rapid, high-resolution XFET imaging studies.
In principle, one could use multiple X-ray spectrometers to improve the detection efficiency of Mode 1 geometry and therefore the counting statistics. However, this approach has certain limitations. To achieve a very high energy-resolution with semiconductor detectors, one needs to use relatively long pulse shaping-times, typically at the order of microsecond. This factor limits the count-rate capabilities of semiconductor spectrometers used in current XFCT studies, which is also the key reason for most of experimental XFCT setups to use extensive shielding to limit the detection efficiency to a few percent [4, 5, 14, 15, 30, 36–38]. A possible solution is to surround the object with more detectors collecting photons independently. This approach inevitably leads to increased cost and complexity of the detection system. Furthermore, major upgrades are planned for several synchrotron X-ray sources, which are aimed at improving X-ray beam intensity by several orders of magnitude. With the greatly improved beam intensity, Mode 2 and 3 would be far better choices over Mode 1 with multiple independent detectors, due to the presence of the collimators that naturally limit the X-ray flux reaching the detectors.
Compared to the conventional line-by-line scanning imaging geometry (Mode 1), Mode 2 geometry achieves a much improved imaging speed by allowing synchrotron X-rays to irradiate an extended volume of the object. This helps to offset the low efficiency of the detection system. However, the improvement in imaging speed is attained at the cost of a much greater dose-rate to the object and this imaging mode is less suitable for high-resolution XFET studies. Note that the parameters for the X-ray imaging spectrometer used in the simulation were determined based on experimental results. One of key factors ignored is the loss in photon counts due to pulse pileup. This accounts for 5–10% reduction in detection efficiency in our current experimental studies using a commercial CCD detector. This effect was ignored in simulation. However, similar count loss will also happen to the non-position sensitive detector. Taking this effect into account, we would expect the conclusions on the relative performances of Modes 1–3 to hold. In fact, the pulse pile-up will be more severe in the non-position-sensitive detector used in Mode 1, which could further separate Mode 1 and Modes 2–3 in terms of real-world imaging performance.
We have recently demonstrated experimental results acquired using a commercial X-ray CCD camera [44]. For the detection of relatively low energy fluorescence X-rays, such as the 6.4 keV photons from Fe, we are currently evaluating several commercial X-ray CCD cameras that have pixel sizes of 10–50 μm. Deep-depleted CCD sensors could offer detection efficiencies of 40–60% at this energy range. One of the major limitations of CCD detectors is the low readout speed, especially for achieving good energy resolution. Scientific CMOS devices may be one of the future directions for achieving excellent spatial and energy resolutions. These developments offer the possibility of performing XFET studies at further improved spatial resolution, say below 25 μm. Another attractive feature of CMOS detector is the much improved readout speed and count-rate capability. This allows future XFET studies using the proposed Mode 2 and 3 geometries at upgraded synchrotron beamlines that offer much greater photon flux.
For the detection of fluorescence X-rays with higher energies, such as iodine X-rays of around 30 keV, it would be more difficult to achieve an excellent resolution (sub-50 μm), a reasonable detection-efficiency and an adequate energy resolution (<500 eV) with a single detector. In such case, a cooled double-sided silicon strip detector could be a possibility, although multiple layers would be needed to provide an adequate stopping power. In order to truly explore the capability of the proposed imaging schemes for high-speed XFET studies, further developments in X-ray detector technologies are clearly needed.
As for indented applications of the XFET techniques, we are currently evaluating the use of these techniques for elemental mapping in living plants and other biological samples, such as zebra fish stained with uranium and osmium. Whilst the radiation dose induced by synchrotron radiation could be too high for in vivo human imaging, it may be possible to use the XFET technique for imaging the iodine-loaded thyroid of a mouse, as has been reported in [4–6].
V. References
- [1].Boisseau P, Grodzins L. Fluorescence Tomography Using Synchrotron Radiation at the NSLS. Hyperfine Interactions. 1987 Jan–Feb;33:283–292. [Google Scholar]
- [2].Cesareo R, Mascarenhas S. A New Tomographic Device Based on the Detection of Fluorescent X-Rays. Nuclear Instruments & Methods in Physics Research Section a-Accelerators Spectrometers Detectors and Associated Equipment. 1989 May 1;277:669–672. [Google Scholar]
- [3].Hogan JP, et al. Fluorescent Computer-Tomography - a Model for Correction of X-Ray Absorption. IEEE Transactions on Nuclear Science. 1991 Dec;38:1721–1727. [Google Scholar]
- [4].Takeda T, et al. Fluorescent Scanning-X-Ray Tomography with Synchrotron-Radiation. Review of Scientific Instruments. 1995 Feb;66:1471–1473. [Google Scholar]
- [5].Takeda T, et al. Iodine imaging in thyroid by fluorescent X-ray CT with 0.05 mm spatial resolution. Nuclear Instruments & Methods in Physics Research Section a-Accelerators Spectrometers Detectors and Associated Equipment. 2001 Jul 21;467:1318–1321. [Google Scholar]
- [6].Takeda T. Phase-contrast and fluorescent X-ray imaging for biomedical researches. Nuclear Instruments & Methods in Physics Research Section a-Accelerators Spectrometers Detectors and Associated Equipment. 2004 Aug 11;548:38–46. [Google Scholar]
- [7].Simionovici A, et al. High-resolution X-ray fluorescence microtomography of homogeneous samples. IEEE Transactions on Nuclear Science. 2000 Dec;47:2736–2740. [Google Scholar]
- [8].Kanngiesser B, et al. A new 3D micro X-ray fluorescence analysis set-up - First archaeometric applications. Nuclear Instruments & Methods in Physics Research Section B-Beam Interactions with Materials and Atoms. 2003 Oct;211:259–264. [Google Scholar]
- [9].Janssens K, et al. Confocal microscopic X-ray fluorescence at the HASYLAB microfocus beamline: characteristics and possibilities. Spectrochimica Acta Part B-Atomic Spectroscopy. 2004 Oct 8;59:1637–1645. [Google Scholar]
- [10].Golosio B, et al. X-ray fluorescence tomography of individual waste fly ash particles. Journal De Physique Iv. 2003 Mar;104:647–650. [Google Scholar]
- [11].Schroer CG, et al. High-resolution 3D imaging microscopy using hard x-rays. Mrs Bulletin. 2004 Mar;29:157–165. [Google Scholar]
- [12].La Riviere PJ, et al. Penalized-likelihood image reconstruction for x-ray fluorescence computed tomography. Optical Engineering. 2006 Jul;45:-. doi: 10.1109/tmi.2006.877441. [DOI] [PubMed] [Google Scholar]
- [13].La Riviere PJ, Vargas PA. Monotonic penalized-likelihood image reconstruction for X-ray fluorescence computed tomography. IEEE Transactions on Medical Imaging. 2006 Sep;25:1117–1129. doi: 10.1109/tmi.2006.877441. [DOI] [PubMed] [Google Scholar]
- [14].Pereira GR, et al. Computed tomography and X-ray fluorescence CT of biological samples. Nuclear Instruments & Methods in Physics Research Section a-Accelerators Spectrometers Detectors and Associated Equipment. 2007 Oct 1;580:951–954. [Google Scholar]
- [15].Yu QW, et al. Preliminary experiment of fluorescent X-ray computed tomography to detect dual agents for biological study. Journal of Synchrotron Radiation. 2001 May;8:1030–1034. doi: 10.1107/s0909049500020483. [DOI] [PubMed] [Google Scholar]
- [16].Zamburlini M, et al. In vivo study of an x-ray fluorescence system to detect bone strontium non-invasively. Physics in Medicine and Biology. 2007 Apr 21;52:2107–2122. doi: 10.1088/0031-9155/52/8/005. [DOI] [PubMed] [Google Scholar]
- [17].Chukalina M, et al. Quantitative comparison of X-ray fluorescence microtomography setups: Standard and confocal collimator apparatus. Spectrochimica Acta Part B-Atomic Spectroscopy. 2007 Jul;62:544–548. [Google Scholar]
- [18].Woll AR, et al. Development of confocal X-ray fluorescence (XRF) microscopy at the Cornell high energy synchrotron source. Applied Physics a-Materials Science & Processing. 2006 May;83:235–238. [Google Scholar]
- [19].Vekemans B, et al. Processing of three-dimensional microscopic X-ray fluorescence data. Journal of Analytical Atomic Spectrometry. 2004;19:1302–1308. [Google Scholar]
- [20].Meng L-J, Tan JW. An Ultrahigh Resolution SPECT System Based on a Novel Energy-Resolved Photon-Counting CdTe Detector. IEEE NSS/MIC; Orlando. 2009. [Google Scholar]
- [21].Meng LJ. An intensified EMCCD camera for low energy gamma ray imaging applications. IEEE Transactions on Nuclear Science. 2006 Aug;53:2376–2384. doi: 10.1109/TNS.2006.878574. [DOI] [PMC free article] [PubMed] [Google Scholar]
- [22].Kastis GA, et al. Compact CT/SPECT small-animal imaging system. IEEE Transactions on Nuclear Science. 2004 Feb;51:63–67. doi: 10.1109/TNS.2004.823337. [DOI] [PMC free article] [PubMed] [Google Scholar]
- [23].Peterson TE, et al. Application of silicon strip detectors to small-animal imaging. Nuclear Instruments & Methods in Physics Research Section a-Accelerators Spectrometers Detectors and Associated Equipment. 2003 Jun 1;505:608–611. [Google Scholar]
- [24].Accorsi R, et al. Preliminary evaluation of the tomographic performance of the mediSPECT small animal imaging system. Nuclear Instruments & Methods in Physics Research Section a-Accelerators Spectrometers Detectors and Associated Equipment. 2007 Feb 1;571:415–418. [Google Scholar]
- [25].Beekman FJ, Vastenhouw B. Design and simulation of a high-resolution stationary SPECT system for small animals. Physics in Medicine and Biology. 2004 Oct 7;49:4579–4592. doi: 10.1088/0031-9155/49/19/009. [DOI] [PubMed] [Google Scholar]
- [26].Meng LJ, et al. Design and feasibility study of a single photon emission microscope system for small animal I-125 imaging. IEEE Transactions on Nuclear Science. 2006 Jun;53:1168–1178. doi: 10.1109/TNS.2006.871405. [DOI] [PMC free article] [PubMed] [Google Scholar]
- [27].Meng FB, Ma H. A comparison between photon counting histogram and fluorescence intensity distribution analysis. Journal of Physical Chemistry B. 2006 Dec 28;110:25716–25720. doi: 10.1021/jp063845r. [DOI] [PubMed] [Google Scholar]
- [28].Miller BW, et al. A Low-Cost Approach to High-Resolution, Single-Photon Imaging Using Columnar Scintillators and Image Intensifiers. IEEE NSS/MIC Conference Record.2006. [Google Scholar]
- [29].Schroer CG. Reconstructing x-ray fluorescence microtomograms. Applied Physics Letters. 2001 Sep 17;79:1912–1914. [Google Scholar]
- [30].Golosio B, et al. Internal elemental microanalysis combining x-ray fluorescence, Compton and transmission tomography. Journal of Applied Physics. 2003 Jul 1;94:145–156. [Google Scholar]
- [31].McNear DH, et al. Application of quantitative fluorescence and absorption-edge computed microtomography to image metal compartmentalization in Alyssum murale. Environmental Science & Technology. 2005 Apr 1;39:2210–2218. doi: 10.1021/es0492034. [DOI] [PubMed] [Google Scholar]
- [32].La Riviere PJ. Approximate analytic reconstruction in x-ray fluorescence computed tomography. Physics in Medicine and Biology. 2004 Jun 7;49:2391–2405. doi: 10.1088/0031-9155/49/11/019. [DOI] [PubMed] [Google Scholar]
- [33].Agostinelli S, et al. GEANT4-a simulation toolkit. Nuclear Instruments & Methods in Physics Research Section a-Accelerators Spectrometers Detectors and Associated Equipment. 2003 Jul 1;506:250–303. [Google Scholar]
- [34].Meng LJ, et al. An ultrahigh resolution SPECT system for I-125 mouse brain imaging studies. Nuclear Instruments & Methods in Physics Research Section a-Accelerators Spectrometers Detectors and Associated Equipment. 2009 Mar 1;600:498–505. doi: 10.1016/j.nima.2008.11.149. [DOI] [PMC free article] [PubMed] [Google Scholar]
- [35].Meng LJ, Li N. Non-uniform Object-Space Pixelation (NUOP) for Penalized Maximum-Likelihood Image Reconstruction for a Single Photon Emission Microscope System. IEEE Transactions on Nuclear Science. 2009 doi: 10.1109/TNS.2009.2024677. in press. [DOI] [PMC free article] [PubMed] [Google Scholar]
- [36].Camerani MC, et al. X-ray fluorescence tomography of individual municipal solid waste and biomass fly ash particles. Analytical Chemistry. 2004 Mar 15;76:1586–1595. doi: 10.1021/ac030282w. [DOI] [PubMed] [Google Scholar]
- [37].Golosio B, et al. Algorithmic techniques for quantitative Compton tomography. Nuclear Instruments & Methods in Physics Research Section B-Beam Interactions with Materials and Atoms. 2004 Jan;213:108–111. [Google Scholar]
- [38].Golosio B, et al. Nondestructive three-dimensional elemental microanalysis by combined helical x-ray microtomographies. Applied Physics Letters. 2004 Mar 22;84:2199–2201. [Google Scholar]
- [39].Vardi Y, et al. A Statistical-Model for Positron Emission Tomography. Journal of the American Statistical Association. 1985;80:8–20. [Google Scholar]
- [40].Meng LJ, Clinthorne NH. A modified uniform Cramer-Rao bound for multiple pinhole aperture design. IEEE Transactions on Medical Imaging. 2004 Jul;23:896–902. doi: 10.1109/TMI.2004.828356. [DOI] [PMC free article] [PubMed] [Google Scholar]
- [41].Fessler JA, Rogers WL. Spatial resolution properties of penalized-likelihood image reconstruction: Space-invariant tomographs. IEEE Transactions on Image Processing. 1996 Sep;5:1346–1358. doi: 10.1109/83.535846. [DOI] [PubMed] [Google Scholar]
- [42].Barrett HH, Myers K. Foundations of Image Science. John Wiley & Sons, Inc.; 2004. [Google Scholar]
- [43].Shepp LA, et al. Maximum-Likelihood Pet with Real Data. IEEE Transactions on Nuclear Science. 1984;31:910–913. [Google Scholar]
- [44].Meng LJ, et al. Beam Testing of Imaging Spectrometry Detectors for Synchrotron X-ray Fluorescence Computed Tomography. IEEE NSS/MIC Conference; Dresden, Germany. 2008. [Google Scholar]


